
There are many things that we know about markets. Probably the most basic and understood truism of the markets is that they have a propensity to price in future expectations, they are forward-looking discount mechanisms. In other words, the changing daily price action is not usually about what is in the media today or even tomorrow, but the expectations of future economic growth and earnings growth. There’s no perfect correlation in the market, and this truism isn’t necessarily perfect either, but it lends itself well over time. With that being said, we’ve seen and heard from a great many investors/traders over the last 24 hours who are perplexed about Monday’s market rally.
Equity markets rose sharply on Monday, with the S&P 500 (SPX) rising just over 7% and the tech-heavy Nasdaq (NDX) leading the big 3 indices with a gain of nearly 7.75% on the trading session. With Monday’s gains, the relief rally that began 2 weeks ago but was interrupted with a down week last week, has been renewed in price and time. The reason for the market rally was well-forecasted weeks ago by Finom Group and validated by the VIX this past week. Remember, the VIX fell nearly 29% last week while the S&P 500 also fell roughly 2 percent. More importantly, the VIX has been tracking the cause for this whole economic and market mess in the first place, COVID-19. From this weekend’s Research Report to subscribers:
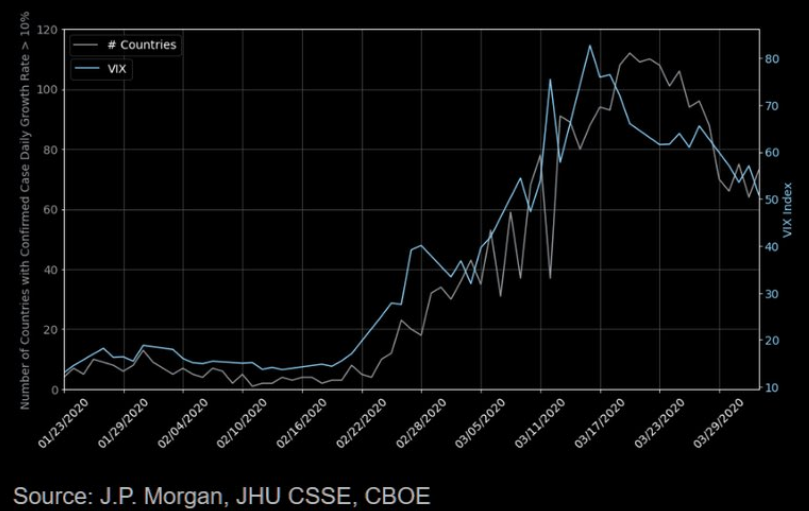
“As I’ve been saying for several weeks now, the VIX is our market guide near-term and the best gauge of sentiment in this environment. The following chart from J.P. Morgan shows the number of countries with daily virus new infection rate of greater than 10% relative to VIX. As the number of countries with the daily virus infection rate of greater than 10% grew, the VIX rose, as the infection rate has declined, so has the VIX.“
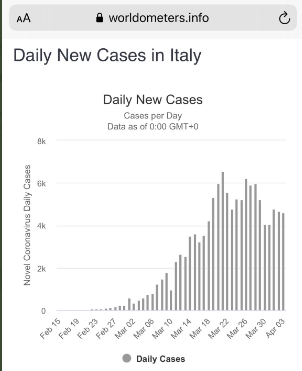
And then over the weekend, there was a better indication that new cases and deaths were plateauing in the U.S./New York and both had already plateaued in Italy.
The VIX had already been expecting this news, pricing it in so to speak. On Monday, the major averages took the opportunity to “price” the macro-news and the implications for forward-looking growth to return, in the future. So what’s next for the markets and with the improved news surrounding the epidemic curve? That’s the million-dollar question as they say! But trust, trust that everyone knows what’s going to happen next except for you, at least, that’s what everyone would you believe. Kind of amazing we have all these genius investors, and very few Lotto winners! Truth be told, most investors/traders have their best guesses and a lack of humility.
I don’t recall anybody last Friday and after a weekly drop of 2% for the S&P 500 forecasting a 7% rise in the market on Friday. Market breadth remained poor, sentiment and relative strength were waning and many market correlations were decisively bearish for equities. My my my how things can turn so quickly and perplex the masses. With this in mind, Finom Group has religiously promoted the idea that investors are best served by remaining cautiously optimistic, flexible, having ample cash on the sidelines and trading intermittently with defined risk. The main reasons for this perspective and guidance is due to the uniqueness surrounding COVID-19 and its affect on all things. Remember, for some unvalidated reason, everyone has a market analogue and/or model to offer even though the market and economy are setting cycle records in a “never seen before in history” set of circumstances. And how wide-ranging are the opinions amongst the professionals, the experts? Well, let’s explore!
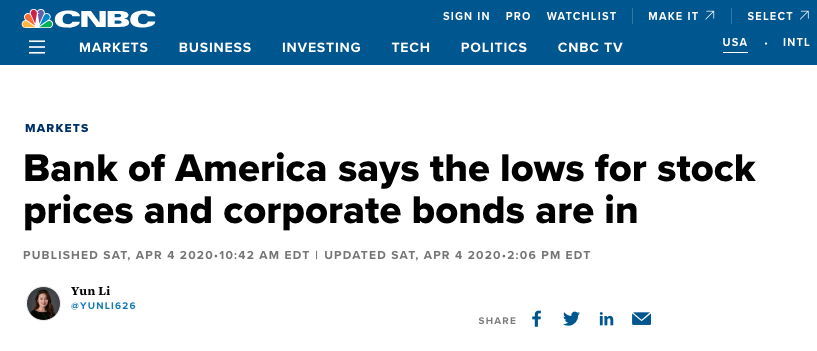
Is the bottom in; is Bank of America right. That’s the message from Bank of America’s Chief Investment Strategist Michael Hartnett. In his notes to clients the firm’s strategist offers the following:
“Some signs are emerging that the bulk of the selling in stock and corporate bonds is behind us.
More than $20 trillion in U.S. stocks value was wiped out during the pandemic-induced sell-off, and investment-grade credit spreads have widened to 400 basis points from 100 basis points.
Tough for asset prices & volatility to subside until human beings can safely leave their homes; that said … lows on corporate bond & stock prices are in.
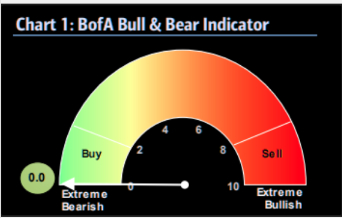
A powerful contrarian “buy” signal for the market has been triggered. Bank of America’s proprietary “Bull & Bear” indicator, which looks at recommended positioning of Wall Street, points to “extreme bear.”
Least we not forget Hartnett’s former call for the S&P 500 in early 2020. His call was for 3s to rule in early 2020. Hartnett forecasted the S&P 500 to climb to 3,333 by 3/3/2020. His forecast slightly overshot as the S&P 500 achieved this feat of strength in February of 2020, but was quite the contrarian call nonetheless.
Unlike Bank of America, however, Credit Suisse is unconvinced that a bottom won’t be retested at least. The firm’s strategists called for equity markets to turn lower over the weekend, offering the following notes to clients:
“We still have not seen all the preconditions we would expect for a market low. We believe that a consolidation/move down over the next month is likely, but that the old lows will hold. We stick to our targets for the S&P 500 of 2700 for year end.”

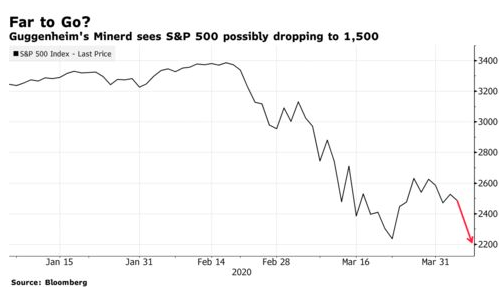
Based on their former sentiment offered less than 2 weeks ago, it becomes rather transparent how quickly price moves can dictate sentiment. But if you’re looking for a rather ominous and/or bearish call on markets near-term, such a call comes from Scott Minerd of Guggenheim. The chief investment officer at Guggenheim suggested over the weekend that the S&P 500 might fall to 1,500 as the coronavirus spreads and its impact is felt in the world’s largest economy. That’s a whopping 40% slide from current levels.
“We need to see the other shoe drop,” Minerd wrote in a report Sunday. “When the markets start to see some of the data on unemployment rising and economic growth and corporate earnings contracting, there will be another level of panic.”
While Minerd likes the Federal Reserve’s response to the pandemic, crediting emergency policy moves with helping restore liquidity, Minerd is less impressed by Congress and the White House. The fiscal programs put in place may be “nowhere near sufficient,” he said, and in some cases perhaps even misguided.
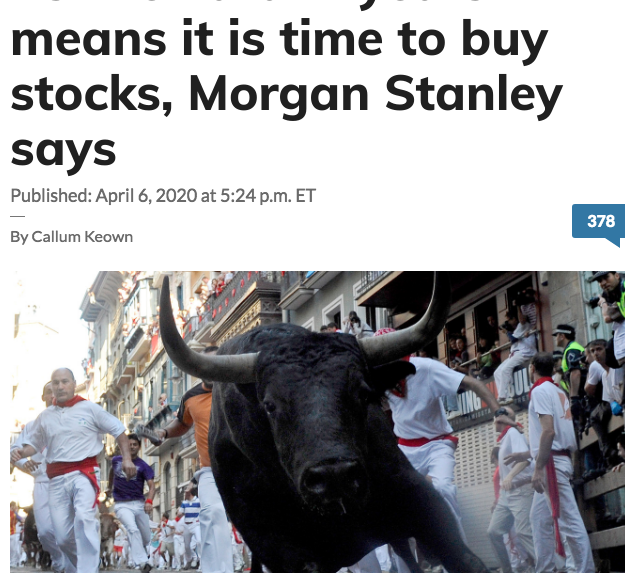
Lastly but certainly not least, Morgan Stanley’s chief U.S. equity strategist Mike Wilson said that, “The worst is very much ahead when it comes to the virus but, for stocks and investors the worst was behind us. Wilson added that bear markets end with recessions and that stocks had reached a good entry point for investors.
“With the forced liquidation of assets in the past month largely behind us, unprecedented and unbridled monetary and fiscal intervention led by the U.S. and the most attractive valuation we have seen since 2011, we stick to our recent view that the worst is behind us for this cyclical bear market that began two years ago, not last month.
Bear markets end with recessions, they don’t begin with them, making the risk/reward more attractive today than it’s been in years; with the twist that the next leg of the bull market could look much different than the last…”
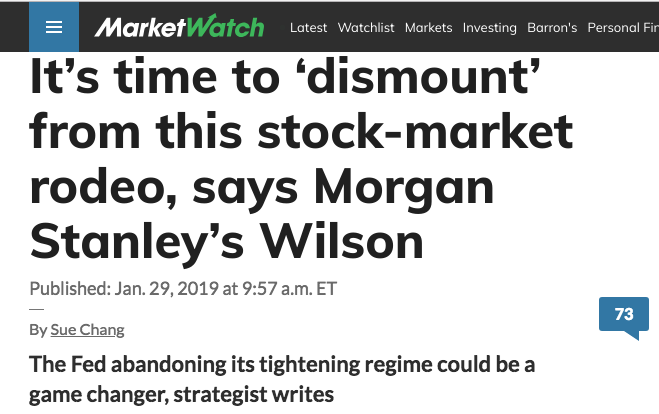
Mike Wilson, Mike Wilson, Mike Wilson!! Is he right? Wilson has been a prominent market bear for the better part of the last 2 years with a rolling bear market call. All of a sudden he’s turned bullish, as price has turned bearish. Once again, but in a contrarian fashion, we see price dictating sentiment. Nonetheless, let’s not forget Wilson’s 12-month bearish call for investors that was highlighted at the onset of 2019, after a robust relief rally in January of 2019. Oddly enough, MarketWatch highlight the analyst’s call with a caption of a bull back then as well. Do you think the publishers know what will get clicks?

After that urgent message to get off the bull market rebound in January 2020, the bull market rallied another 30% through early 2020. So again the question remains, “Do we buy into Wilson’s latest call after his misguidance in 2019?”
Don’t get us wrong, the job of an analyst/strategist isn’t easy. By and large, we appreciate the efforts of most of them, when we believe efforts are being made in earnest. With that being said and eyeing equity futures continued to rally into Tuesday’s market session, let’s take a look at some of market technicals and internals.
Coming into the week, market breadth and technicals were decisively bearish. After a strong relief rally 2 weeks ago, it was looking like the relief rally had run its course, even though such rallies can and have lasted for weeks in the past and during bear markets. (Table from LPL Financial)
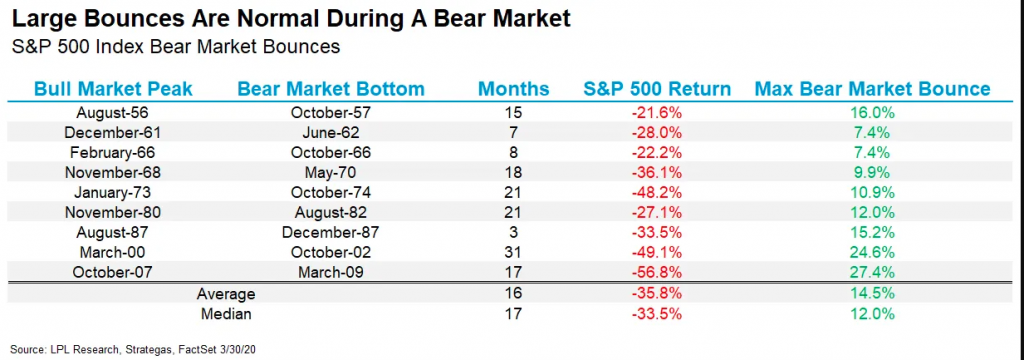
“As shown in the LPL Chart of the Day, there have been 9 bear markets that officially lost 20% since 1950, and the average maximum bear market bounce during those bear markets was 14.5%. Although we are optimistic that stocks are carving out a major low, it probably won’t be an easy ride and a potential move back to the recent lows can’t be ruled out.“
The table above only further emphasized that the market’s relief rally is typical during bear markets, even at the higher end of the range so far as rally returns. With respect to market breadth that accompanied the relief rally, it leaned defensive in nature and without confirming a reversal of trend. The number of stocks trading below their 50-DMA was nearly 95%, Consumer Staples were outperforming Consumer Discretionary, High Beta was underperforming Low Beta, Bonds (TLT) were outperforming Stocks (SPY) and Regional Banks were underperforming REITs. This is not the kind of breadth or positioning you want to see if hoping for a trend reversal from bearish to bullish. One of the very few breadth indicators that suggested cautious optimism was highlighted in our recent Research Report, but with recognition of the more recent S&P 500 Death Cross formation:
“So while all of our breadth indicators suggest caution on the part of investors, and remaining with a high cash position, the number of stocks trading above their 200-DMA did slightly improve on a WoW basis.
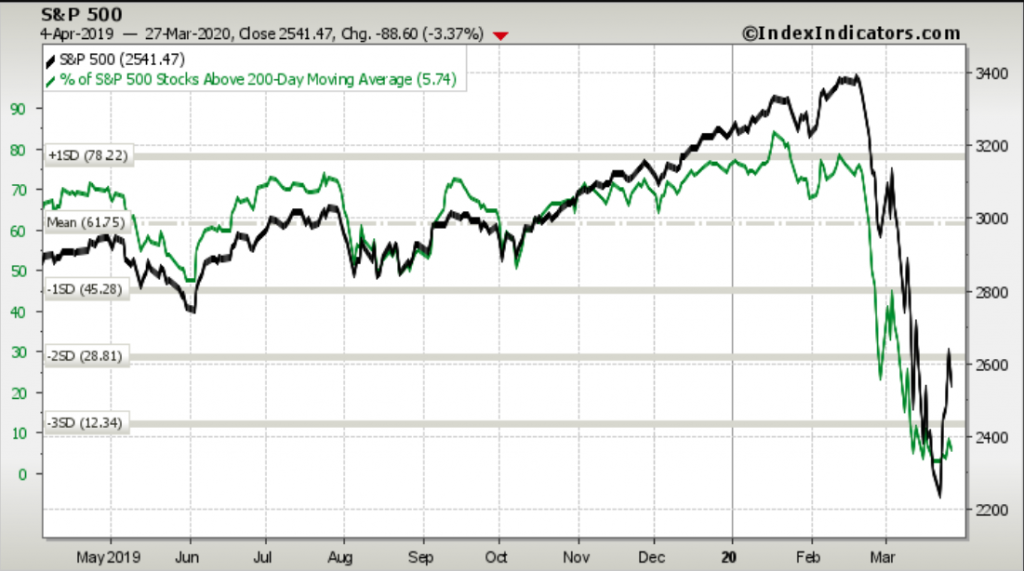
As shown in the chart above, only 5.74% of S&P 500 stocks were trading above their 200-DMA as of 3/27/2020. The chart below shows that 7.92% of S&P 500 stocks are now trading above their 200-DMA, as of Friday’s closing bell. Baby steps, right?

While there remains very little for bulls to hang their hat on, I don’t believe in being pessimistic. Such a view about most anything tends to lead to more pessimism and less success in ventures taken. Investing is no different in my opinion.
“A pessimist sees the difficulty in every opportunity; an optimist sees the opportunity in every difficulty.” ~ Winston Churchill
Maybe a bit of grasping at straws, but more importantly would come from what happened in the technicals and/or breadth correlations on Monday. Such breadth correlations on Monday suggested the potential for the market to continue moving higher and to an area where significant market volume has taken place in the past. Here is what Baycrest Partners offered yesterday regarding that key area:
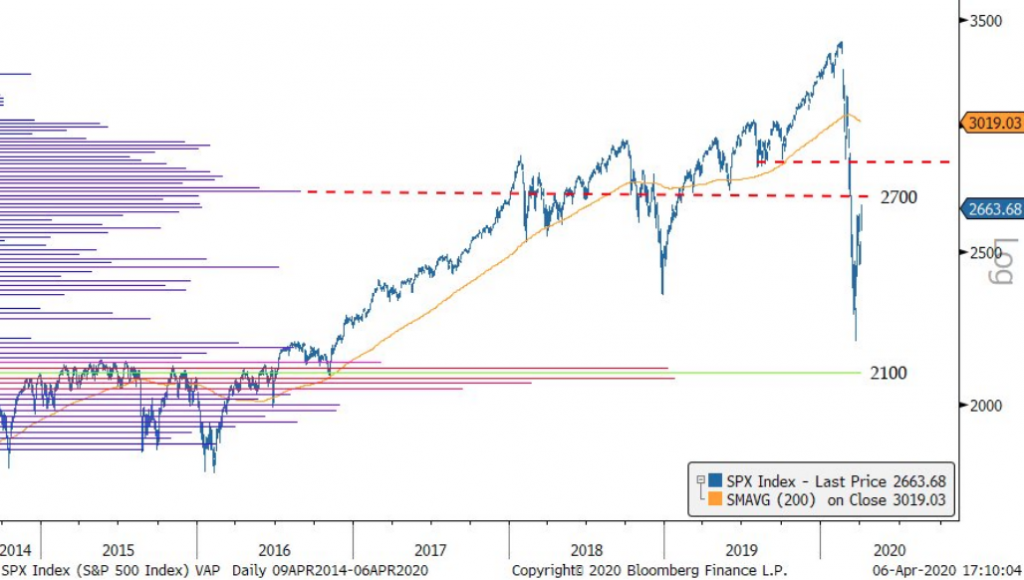
“2700 remains a very key level.. It’s the second highest volume based area in the last five years .. We don’t think surpassing 2700 on the initial attempt will be easy, but if it can, .. tomorrow would create an attractive area to tactically sell into..”
“Today was the 32nd time in history the SPX gained at least 7% in one day. 22 of those occurred between 1929 and 1933, and we have seen three in the last month. While forward returns have been pretty mixed, one-week later the SPX [is] up only 42% of the time.”
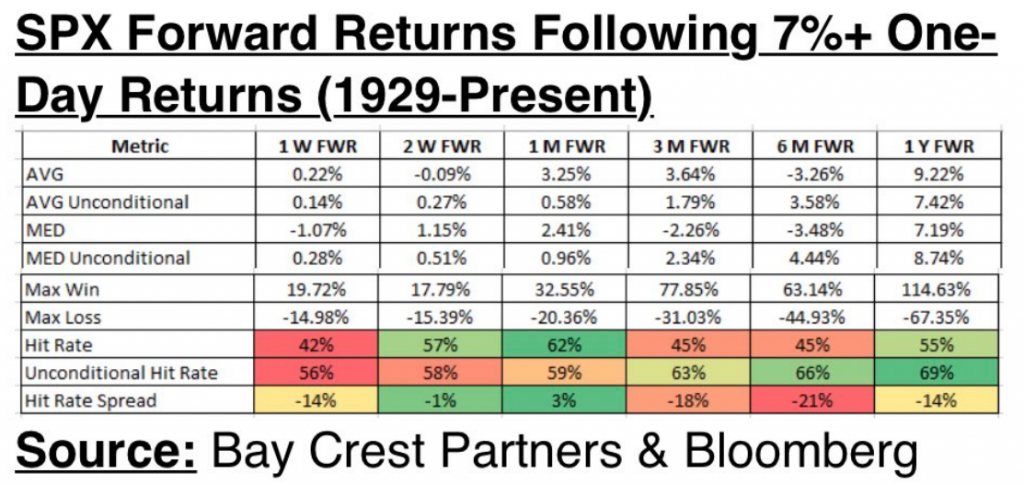
Pretty compelling historical data there regarding 2,700 and the S&P 500 forward-looking performance post 7%-one day returns. These kinds of studies seem to always catch our attention. We’ll circle back to market “studies/data” in just a bit.
What happened to the S&P 500 was rather natural and very technical in nature. The benchmark index made an attempt at closing above both its 20-DMA and 200-WMA on Monday, but failed to do so. From that point, strong resistance proved a reliable sell signal for many investors post the quarter-end rebalancing period. But on Monday and as highlighted in the latest blog from Chris Ciovacco, both resistance levels were breached with a positive close above these moving averages.
“Last week, the S&P 500 was rejected below the 200-week moving average. Monday, it closed above the 200-week moving average.
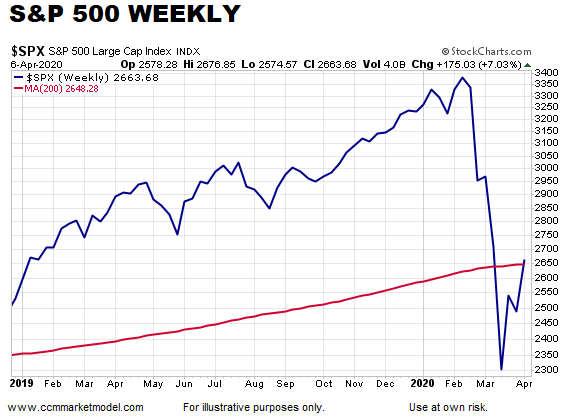
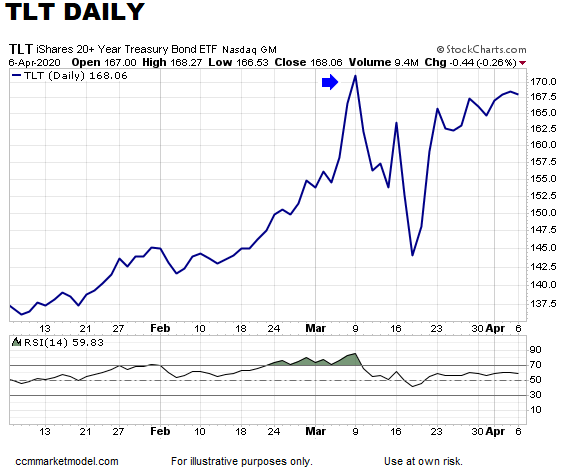
Recall that we denoted the recent TLT:SPY outperformance above. This also faltered on Monday, indicating a bullish tilt in favor of equities with respect to bond appetite. (See Ciovacco notes)
TLT, thus far, has been unable to exceed the closing high that was made in March. It is possible that if it goes on to make a new high, it will be accompanied by an RSI divergence (chart below). The CCM Heat Map for Ten-Year Yields is also flashing some yellow (not red) lights for bonds, something that was taken into account in today’s allocation tweaks.
While the latest breadth correlations and technicals have proven favorable for the bulls, a trend it does not make. Fits and starts, rallies and retreats are often found in a bear market bottoming process. It remains unknown as to whether or not the bottom is in, a retest of the low is achieved or a breakout is afoot. The severity and speed of the bear market breakdown suggests everyone was caught off-guard. As such, that likely means there will not be a sufficient, clear warning ahead of time before it bottoms and no certainty about the difference between a dead cat bounce and an actual end of the bear market. Nobody saw it coming, why should anybody see it going/rebounding?
In circling back to “market studies, this past weekend we reviewed the latest Chris Ciovacco YouTube video. We highly recommend making this part of every investors’ weekly market/macro research routine. The videos are fluid, theatrically pleasing and largely fact-based. More importantly, in this 20-year investing veteran’s opinion, they allow for the extrapolation of probabilities going forward, and based on like market conditions from the past. No analogues are guarantees, but probabilities are informative and lend themselves to risk management, something Chris emphasizes throughout his videos rather appropriately. With this in mind….
In one of the final minutes of Chris’ latest weekly video, he outlines a recent table from LPL Financial as follows:
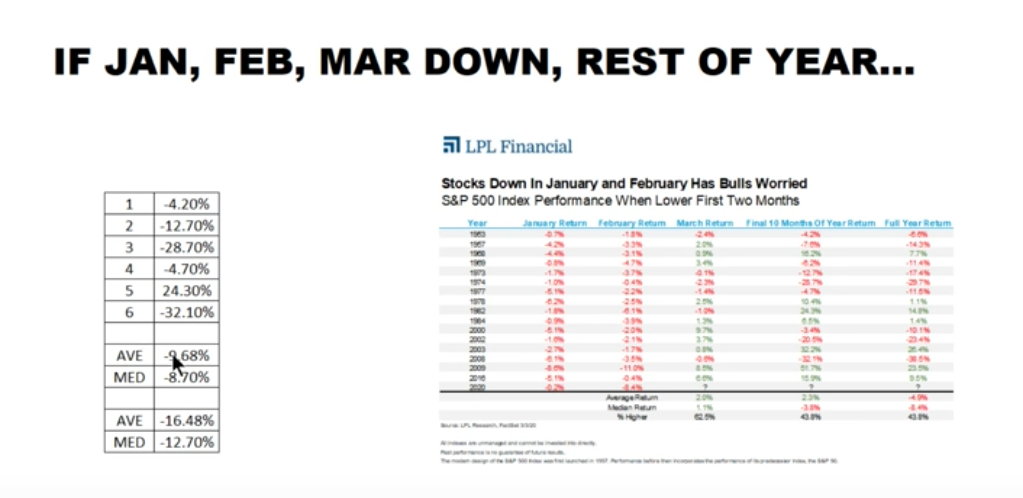
For the sake of clarity, here is a better screenshot that we’ve extrapolated from a recent blog post from LPL Financial with the following verbiage:
“As shown in the LPL Chart of the Day, a bounce in March is quite possible for stocks after being down the first two months of the year; that’s the good news. The bad news? The final 10 months have been up only 2.3% on average, while the full year has been lower 4.9% on average. Compare that to when the first two months have been positive, the final 10 months have been up 12.2% on average and the full year has been up 19.8% on average.”
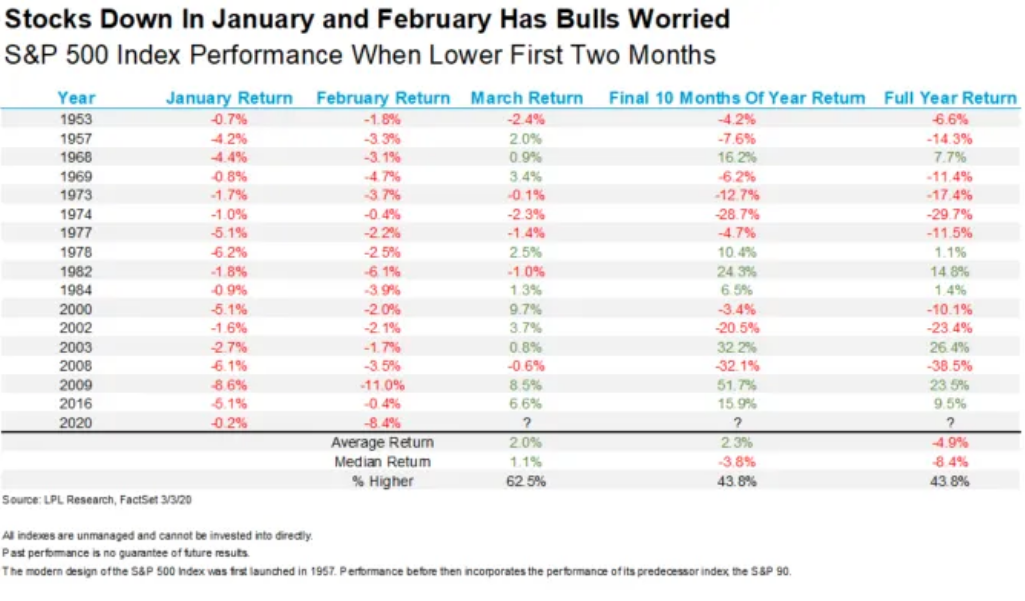
So here’s “the thing” because there is always “the thing”… Whenever reviewing analogues or historical data, we would desire to achieve the most like variables or inputs. In other words, we want the analogue or historical data to be as close to an apples-to-apples comparison as possible. Based on reviewing the LPL table of historical data, when the first 3 months of the year are negative, as they were in 2020, Chris concluded that the average return is negative by nearly 10% for the the rest of the year. Why? Because that is what the data says; it’s not open for debate, it’s black and white data. But again, “the thing”…
See in each of the previous 5 times that the S&P 500 declined in the first 3 months of the year, it did so by less than 10 percent. In fact, the closest to a 10% decline was in 2008. Is that how much the S&P 500 was down in the Q1 period for 2020? No, clearly not! The S&P 500 was actually down a full 20% in Q1 this calendar year. Does that matter? Naturally, we leave that up to you to decide. Furthermore, we lean on additional inputs/data/variables that suggest something very different from what Chris’ video offered. Remember, we want to compare the most “like/similar/apples-to-apples variables/data in order to extrapolate the most likely probabilities. So here is what we found, and knowing that this was actually the largest Q1 drop in history. That’s gotta mean something, right?
When things have become this bad in the market, sometimes we have to force ourselves to understand that it can possibly get better with the passage of time. That’s what is taking place with the COVID-19 epidemic curves around the globe, right? Some fun and positive facts about the passage of time when the 1st quarter of the year is so dire: When the S&P 500 Index is down >10% in Q1 (the key input), the rest of the year is up nearly 40% on average, according to LPL Financial’s Ryan Detrick. This is very different than the probabilities noted previously and simply looking at all the dates in the previous table from LPL Financial. Keep in mind too, the previous table start and end dates don’t include the 1930s or 2001. Hmmm, which inputs are the best remains a question!
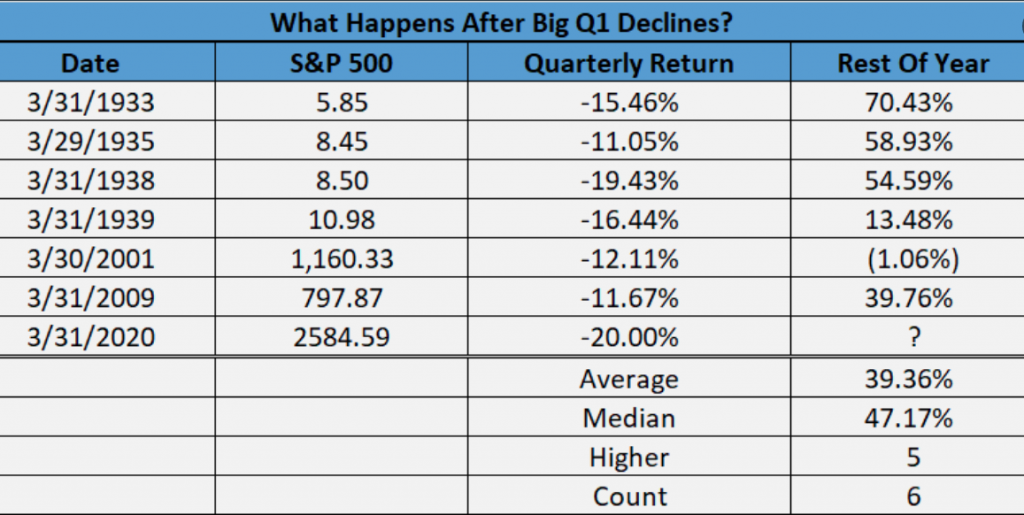
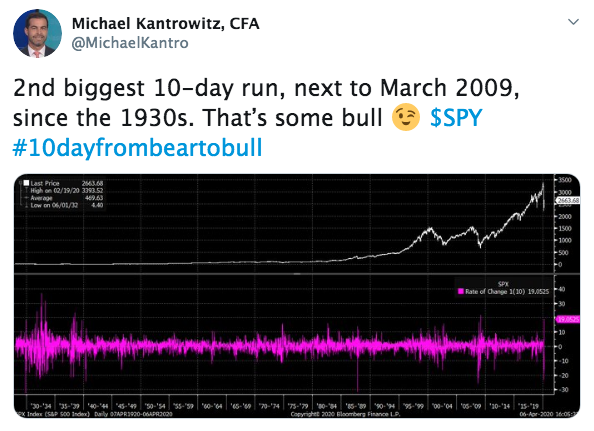
And maybe the latter table/study has the most like inputs and is the most comparable because it includes the 1930s. After all, the S&P 500’s 10-day rally is the largest since the 1930s.
Some more good news for investors is that April IS typically a good month of the year for returns, typically! Since 1950, April has been the second best month of the year for the S&P 500. The past 20 years it has been the absolute best. When March is lower? Higher 10 of the past 12 times also. When March was lower with a COVID-19 economy shuttered? We’ll know soon enough!
With all that being said, it wouldn’t be a Finom Group daily market dispatch without a recanting of one of our favorite market strategists, Tony Dwyer of Canaccord Genuity. Tony has a remarkable track record for forecasting market outcomes. He discussed his more near-term outlook on CNBC’s Fast Money show Monday evening.
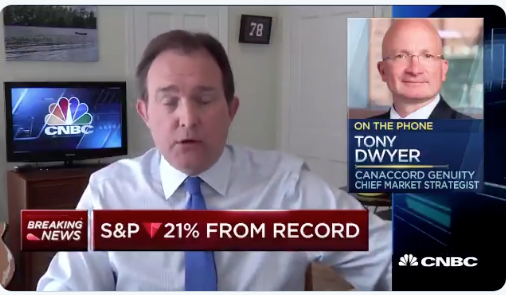
For a more concrete understanding and visual on what Tony Dwyer discussed on Fast Money, please see his notes below:
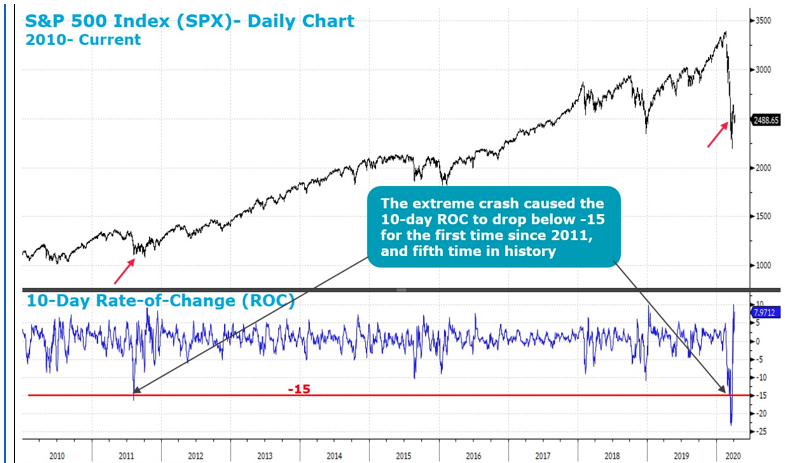
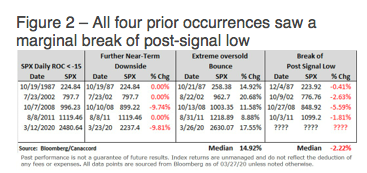
“Another indicator points to a test of the 03/23 low as we wait for stimulus to hit.We have no doubt that the incredible monetary and fiscal stimulus should help the economic recovery once we all begin coming out of our homes and have the stimulus in hand, but history continues to suggest such extreme drops are marginally broken on a test of the crash low. For only the fifth time since the S&P 500 (SPX) became a 500-stock index (1957), the March swoon saw the 10-day Rate-of Change Indicator hit a less than minus 15 reading (Figure 1). We found the other four occurrences of such a sharp swoon see an immediate low, followed by a median 14.92% extreme oversold bounce, and then a marginal break of the immediate low (Figure 2).
And there you have it folks! It’s a lot to consider, digest and ultimately put into action regarding portfolio management. One of the things we recently asked of finomgroup.com members begs of recognizing the level of uncertainty surrounding unique black swan events were opinions vary and confidence in the future is low: Would you rather be late to the new bull market when it arrives or early to a pending bull market arrival. The majority of our members stated they would be okay with being late, but late with more confidence. The retail investor/trader is already putting capital to work.
- JPMORGAN: After 4 wks of “heavy and indiscriminate selling,” retail investors “bought equity mutual funds for the 1st time since the beginning of Feb. .. $1.5tr of dollar cash is likely to gradually re-enter bond and equity markets as retail investors “normalize their behaviour.”
We can always make up for lost time with greater market exposure/leverage, as they say!


