
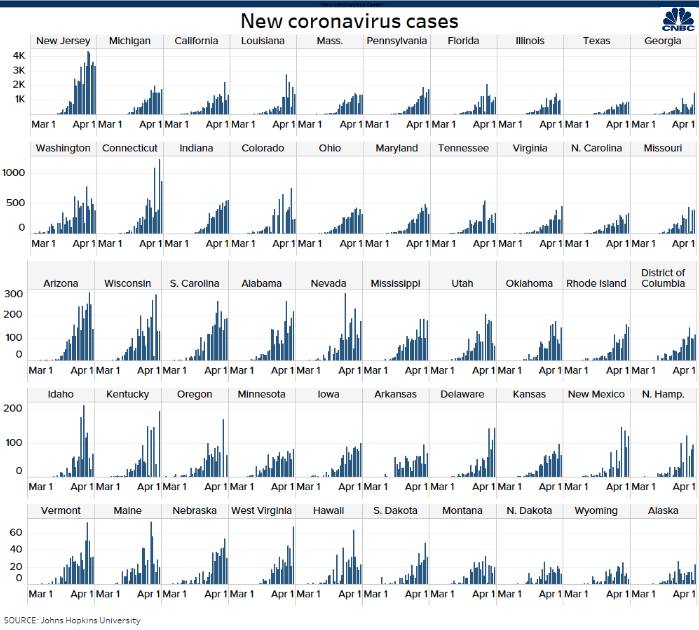
Welcome to this week’s State of the Markets with Wayne Nelson and Seth Golden. Please click the following link to review the SOTM video. We are achieving the turning point in the COVID-19 saga as the peak of the epidemic curve has been expressed this past week. Coincidentally, the markets’ relief rally compounded this week with key levels achieved as the S&P 500 has clawed back 50% of what it had lost in the depths of the bear market. We are still within the bottoming phase of a bear market with the probability of consolidating recent gains over the coming weeks and/or months. While the outlook for the economy and earnings remains murky, monetary and fiscal policy is aiming to build a bridge to the other side of the recession. Economic data is showing extreme levels of initial jobless claims and overall GDP contraction to come. As it was in the previous week, we continue to encourage investors to tread cautiously, but looking to put capital to work on pullbacks.
- 81% of advisors polled by Ned Davis Research said stocks will still eventually sink lower than the S&P’s March 23 level of 2,237, when it was down 34% from its Feb. 19 peak.
- More than half of advisors surveyed expect the market low to be reached by May 31, while 25% expect markets to bottom even later. NDR found that just 19% of advisors believe the bottom had already been reached by March 23.
- Ed Clissold, NDR’s chief U.S. strategist, says the market’s “bottoming” process typically has four stages:
- “Oversold,” “rally,” “retest” and “breadth thrust.” The 3-day rally after March 23 likely signaled a move to Stage 2, rally, according to an NDR statement, and the market may bounce between there and Stage 3 “until it sees a successful retest with less total volume, less downside volume, fewer stocks making new lows and fewer stocks below their moving averages.”
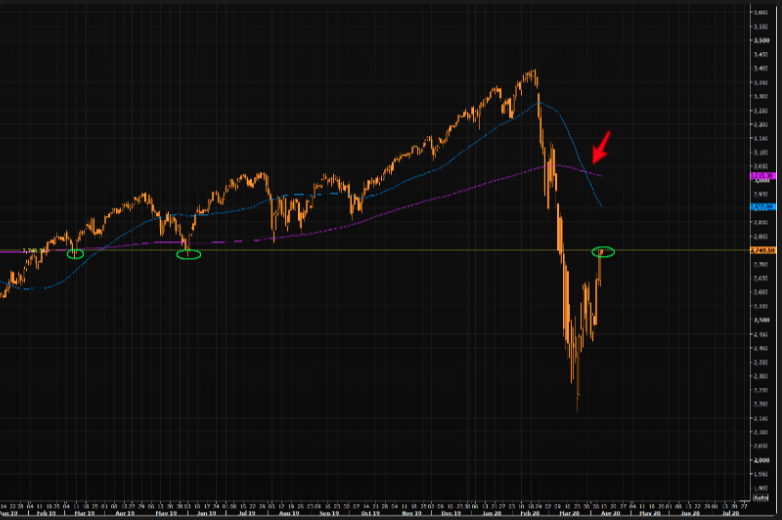
S&P – down 18% from ATHs, up 26% from recent panic lows
- Up some 250 handles since S&P 500 made a death cross.
- 2,750 is the first level to “care” about, but bigger resistance is at 2850/2900.
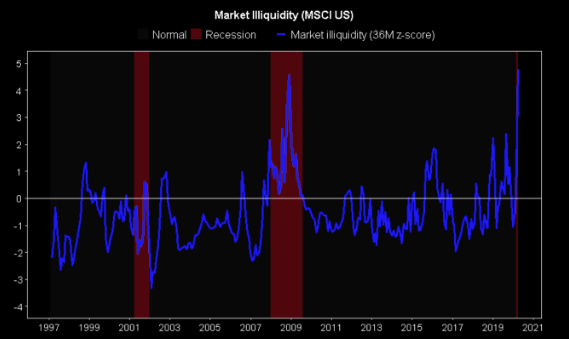
- Given the most illiquid market in history, S&P 500 can over react higher and lower.
- Momentum indicators, including MACD and RSI, are increasingly neutralizing, alleviating a significantly stretched condition that was apparent through the month of March.
- There still remains no signs that these indicators are peaking.

- Leading the action on Wednesday were those sectors that sold off the most during March’s decline. Traders continue to shed bearish bets (shorts) given the break of levels of short-term resistance in recent days.
- The Energy (XLE), Financial (XLF), and Material (XLB) ETFs were higher by over 4%. The Utilities ETF (XLU), which had been underperforming the market since earlier in March, was higher by 5.45%. And the REIT ETF (IYR), which was one of the hardest hit sectors in recent weeks, realized a gain of 7.16% on Wednesday. Each have now broken above their end of March highs, confirming a short-term trend for each of higher-highs and higher-lows.
- Meanwhile, Consumer Staples (XLP) and Technology (XLK), the outperformers during the market slide, lagged the market return on the day. The areas that had outperformed through the past month have approached levels of long-term resistance around their respective 50 and 200-DMAs, leaving little upside potential for investors to benefit from.
- The action is positive, for now, as it suggests a shift of sentiment that is allowing the extreme bearish bias to reset. However, while the cyclical rally is conducive to positive markets, the activity hints of a mere alleviation of the extreme oversold condition that these sectors experienced at the lows in March, resetting them for another move lower as investors gauge the prolonged nature of this economic contraction.
- When/if the cyclicals start to fade relative to the performance of the broader market, traders will likely start to fade the entire rebound rally from the past couple of weeks.


- While I’m convinced the momentum low is in, technically that doesn’t answer the question of whether the 26% rally off the 2,192 S&P 500 low is the start of a new bull market or merely a bear market rally that leads to a retest of the lows in coming weeks.
- In 1987 it took the S&P 500 almost 2 years to make new price highs. In 2008, after gaining 20% to 1008, it fell another 27% to 741 on 11/21 only to rally another 27% to 944 & then fall another 29% to its final low of 667 in March 2009.
- The index didn’t make a new high until 2013.
- This has been the most impressive recovery in history, even after Tuesday’s intraday reversal according to a study from SentimeTrader.
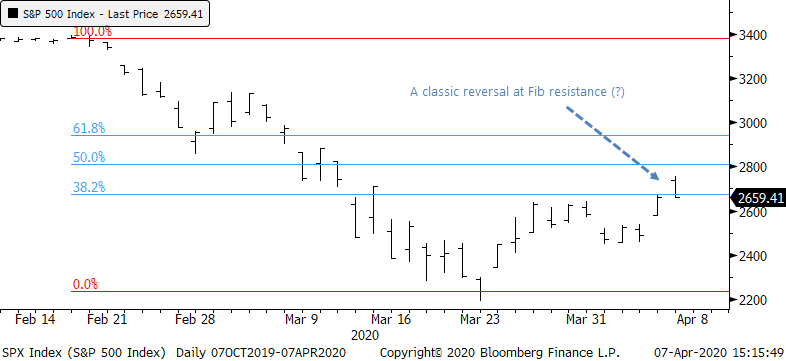
- Classic technicians will be all over the idea that stocks suffered an intraday reversal at the “classic” 38.2% Fibonacci resistance level.
- While it’s common knowledge that stocks enjoyed multiple large rallies during prior bear markets, at no point during the rallies in the 1930s or 2008 did stocks manage to claw back as much of the losses as quickly as they’ve done this time.
- The S&P 500 bottomed 11 days ago. In that short span, it’s retraced nearly 37% of its decline. Looking at all historical instances of the S&P clawing back more than 30% of its decline after 11 days, not a single one was was “just a bear market rally.”
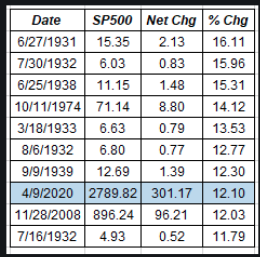
- As of Wednesday, this was the single greatest 12-day stretch of returns for the S&P 500 since 1950.
- Moved 03/23/2009’s 12 day gain of 20.57% into 2nd place.
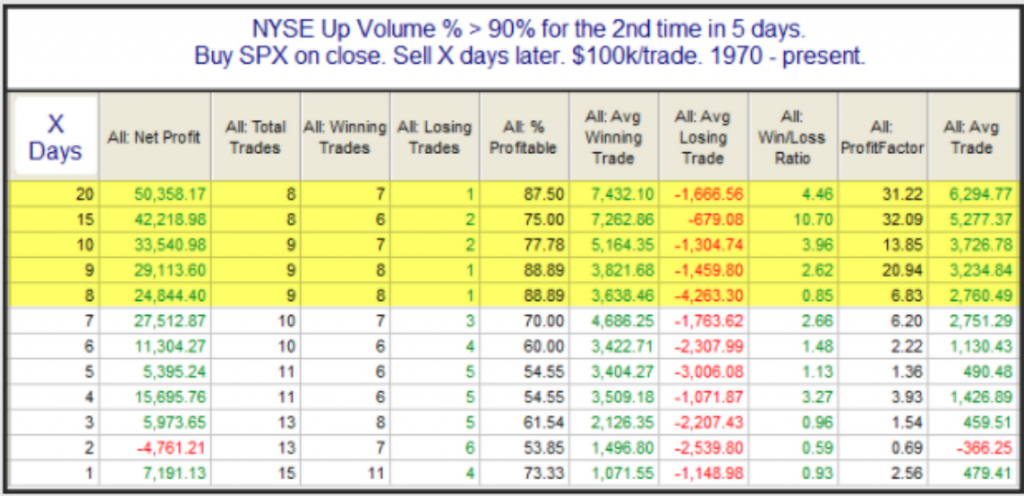
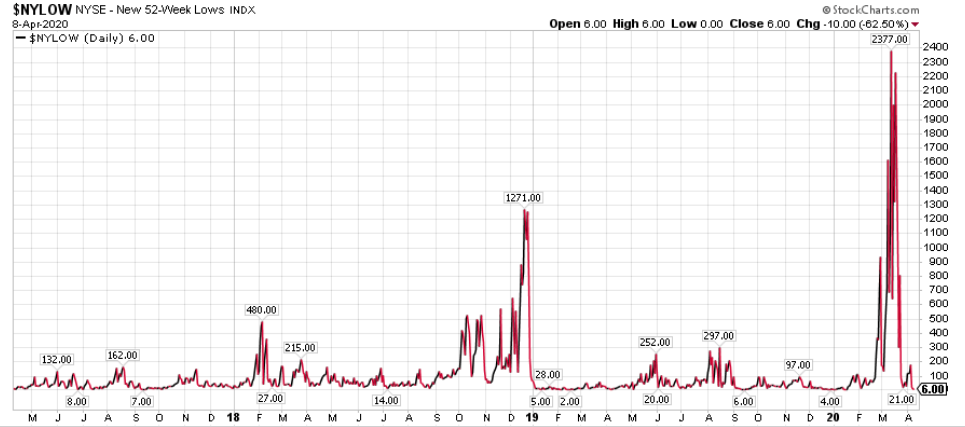
- Breadth: Now, two >90% up volume days this week.
- While rare, has led to some extremely bullish returns.
- What that means explained here:
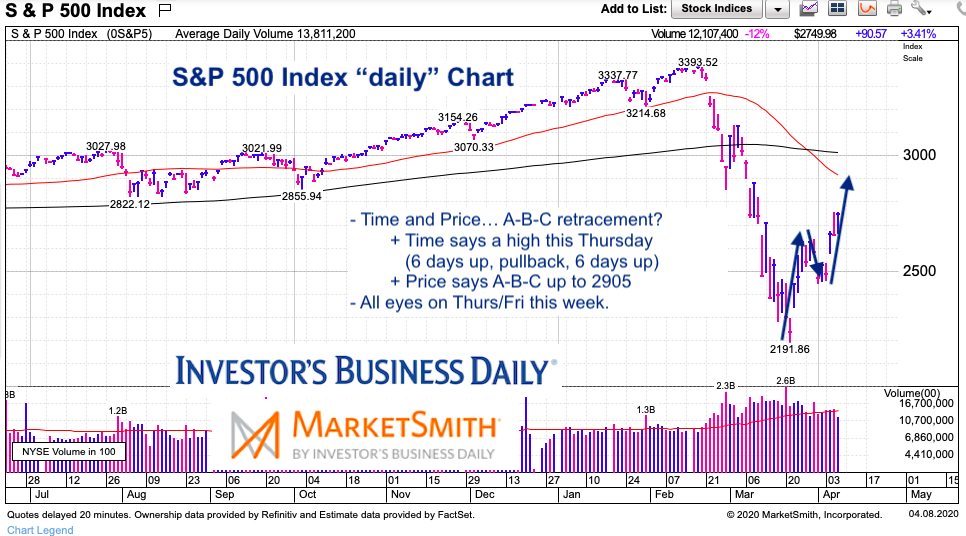
- “Time” is calling for a top Thursday or Friday. “Price” is a bit higher but it’s uncertain if time will get there. In short, it’s time to be cautious.
- Time = 6 day rally, 2 day pullback, 6 day rally? (ending Thursday)
- Price = 2191 rally up to 2641, down to 2455, and perhaps up to 2905?
- Either one or both will win out. I’m not willing to bet. Note that the 50% Fib is at 2793, followed by the 61.8% Fib at 2934. There’s also the 50/200 day moving averages. Resistance looms.
- As good as this rally feels, we are just now hitting the 50% retracement of the 34% bear market.
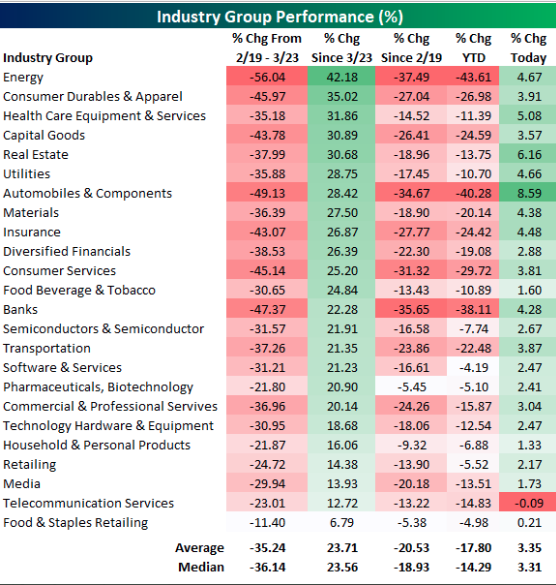
- 18 of the 24 S&P 500 Industry Groups are now up 20%+ since the March 23rd low.
- Energy=insane. Fell 56% from 2/19-3/23. Up 42% since 3/23.
- Still down 43.6% YTD and down 37.5% since 2/19.
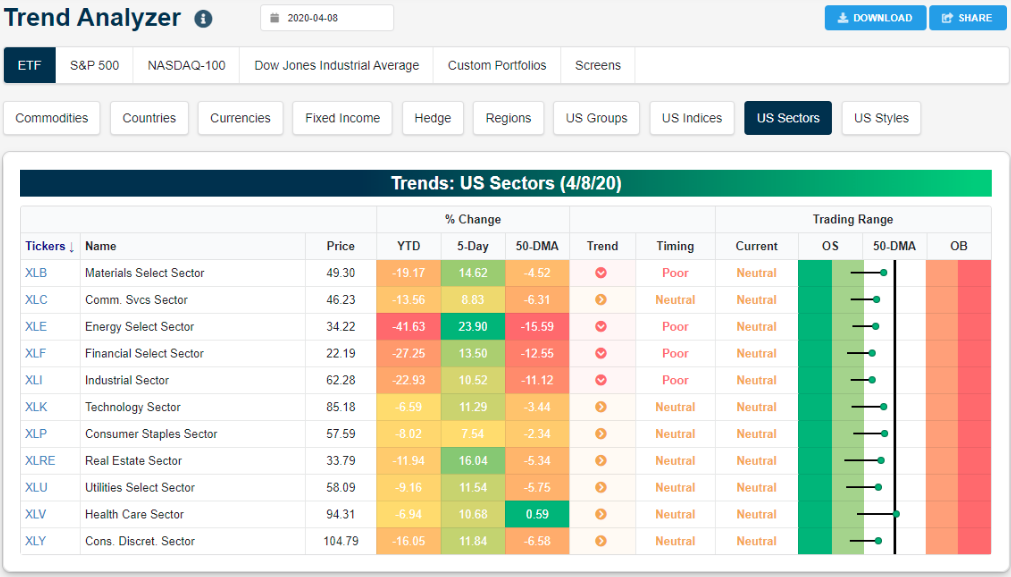
- All eleven S&P 500 sector ETFs are finally out of oversold territory for really the first time since early March.
- All of the major U.S. index ETFs are out of oversold territory and all but the micro-cap ETF are up 10%+ over the last 5 days.
- The S&P 500 had its best week since 1974.
- Same week printed 6.6mm jobless claims. Just saying, when market trades higher on bad news…

- It’s no surprise staples are recession resistant as the demand for necessities doesn’t change much in recessions.
- As you can see from the chart above, starting in December 2006 to December 2009, (global) staples earnings forecasts grew 29.7% while the overall market saw a decline of 16.1%.
- Staples’ earnings recovered quickly because they didn’t fall by much. The actual stock prices outperformed the most when the declines were the steepest and then underperformed as the recover started.
- Market earnings didn’t recover to their December 2007 peak until May 2011.

- Going all the way back to the 1920s, the index that would eventually become the S&P 500 has registered 14 bear markets as defined by a 20% fall from a record high. Within these bear markets, the market has staged a bear market rally in excess of 15% on 19 occasions.
- The duration of rallies ranged from just 2 days to over a year, with 1947’s rally lasting 393 days. And while some rallies stalled out at just 16% one bear market retrace ran up as much as 46% in 1929.

- The median bear market lasts 81 days past the initial 20% drop to trough and experiences an additional selloff of 18.41% on average.
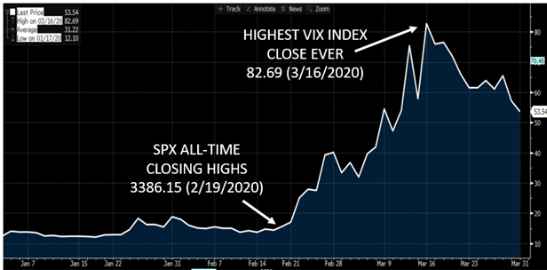
- The highest close ever occurred on March 16 with a measurement of 82.69.
- The average VIX Index value between January and March was 31.22.
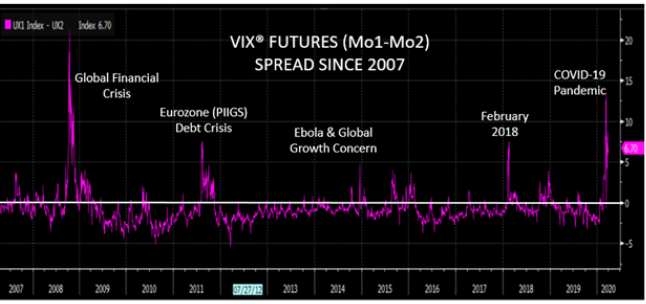
- Typically, the VIX term structure is in contango, a relationship where shorter-dated futures trade at a discount to longer-term VIX futures. Historically, when the S&P 500 Index declines (with velocity) the VIX term structure has a tendency to invert (backwardation). In those scenarios, the shorter-term VIX futures trade at a premium to longer-term contracts.
- The VIX futures curve has been inverted since February 24. April VIX futures remain at a significant premium to May as of April 3, which marks 30 consecutive sessions of Mo 1 over Mo 2 futures. That’s the longest persistent backwardation since late 2008.
- The current inversion has not exceeded the pinnacle (~22 handles over) from 2008, but it’s possible that could change. Since March VIX futures and SPX options rolled off, the VIX term structure has flattened. Nevertheless, April futures are trading at a 4.30 point premium to May (12.50%).
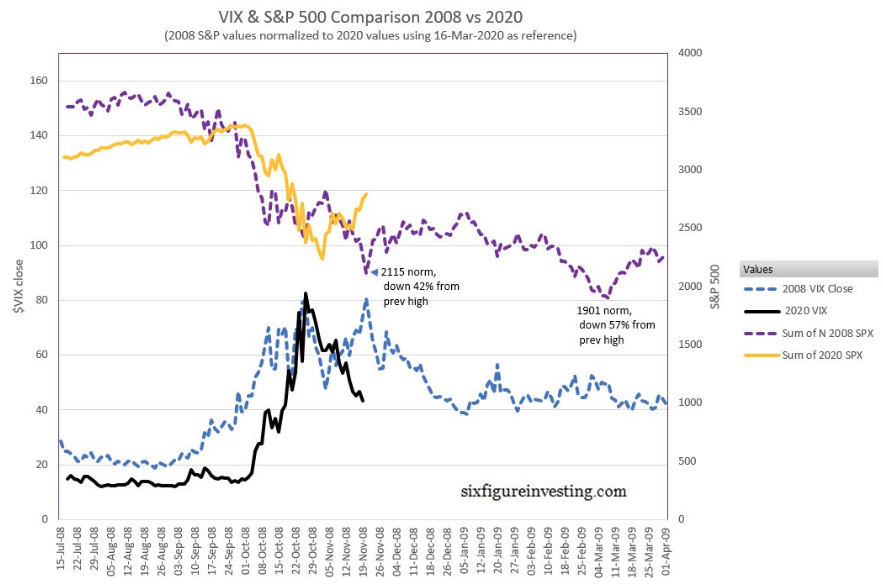
- 2008 recession/bear market had two spikes in VIX about a month apart.
- Bottom trend lines represent 2008 and 2020 VIX.
- So far, the 2020 VIX has not held to the 2008 VIX model.
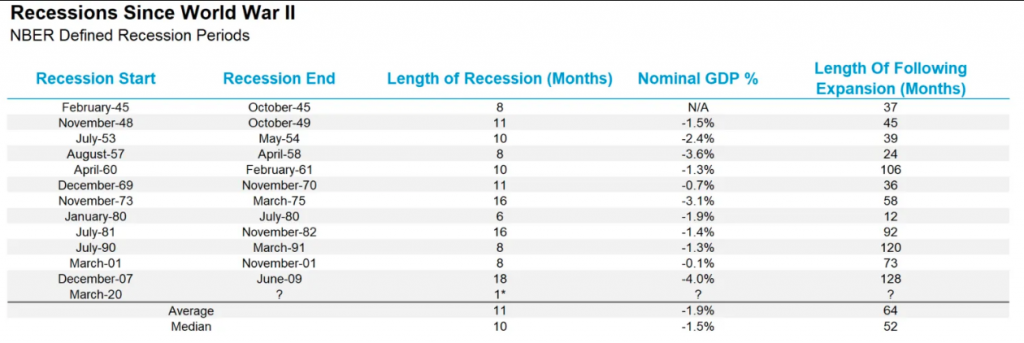
- This will be the 13th recession since World War II, with the average recession lasting 11 months on average, and the shortest ever only six months in 1980.
- The last recession during the Great Recession lasted 18 months, which was the longest since the Great Depression in the 1930s.

- What will be the first clues to when the economy is indeed turning? Historically, the stock market actually bottoms well before the economy
- As shown in the LPL chart above, the S&P 500 Index has bottomed about 5 months on average before recessions were deemed over.
- Only the recession after the tech bubble 20 years ago saw the stock market bottom after the recession was over, and that was likely due to the excessive valuations that built up during the late-1990s coupled with the blow to investor confidence from the Enron and Worldcom accounting scandals.
- Joachim Fels, global economic adviser at Pimco
- Unlike previous recessions, usually caused by the interplay of economic and financial imbalances, interest rate hikes, or oil price spikes, the trigger of the present crisis is an exogenous shock.
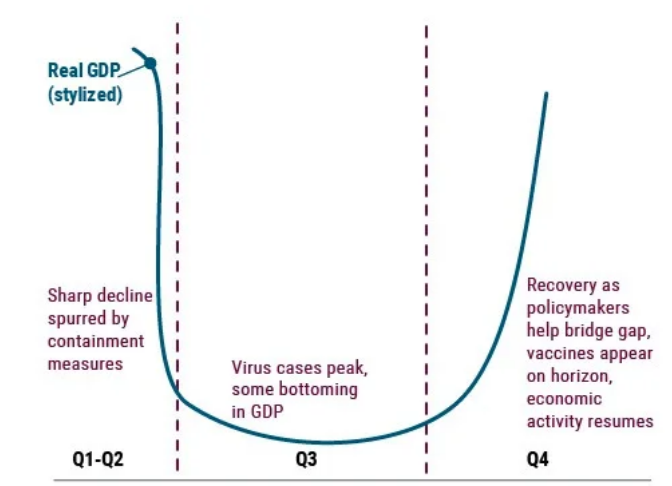
- We are seeing the first-ever recession by government decree — a necessary, temporary, partial shutdown of the economy aimed at preventing an even larger humanitarian crisis.
- Given the sheer size of support measures and the absence of major real economic imbalances, we expect the global economy to transition from intense near-term pain to gradual healing over the next six to 12 months, once the spread of the coronavirus is under control and restrictions are lifted,” Fels said, adding that restrictions will be lifted only gradually and at different speeds.
“If governments continue their fiscal expansions even after the crisis, the dominance of fiscal over monetary policy may lead to higher inflation than markets currently price in,” he wrote. “But with central banks capping the rise in nominal yields that would normally result from higher inflation, real rates would tend to fall as inflation rises.”
Lastly, there will be a shift in how people save their money, as unemployment and debt could put pressure on households to take a much more cautious approach to their financial future. That could mean less of an appetite for risk-on assets. It could also mean paying down mortgages faster.
“With the private sector saving glut likely to rise further,” Fels said, “investors should brace for a New Neutral 2.0 of even more depressed real interest rates over the secular horizon.”
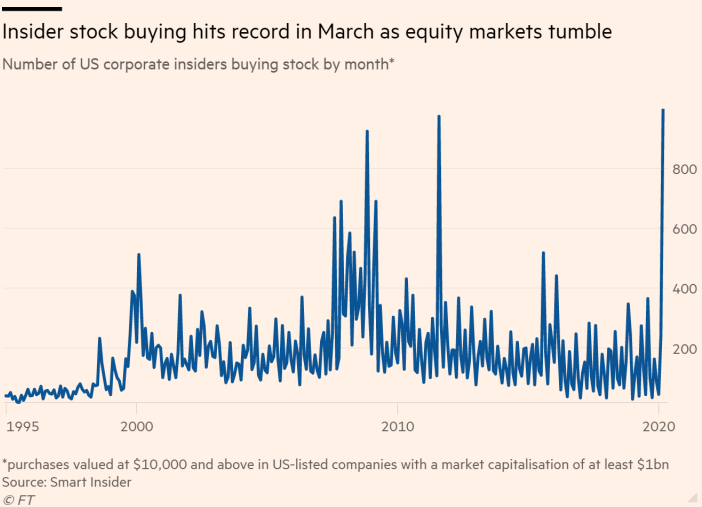
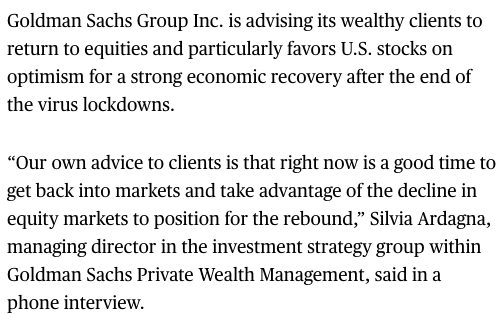
- Executives at big U.S. companies bought their own stock in record numbers last month.
- The insider buying alone does not explain the recent market rally, but “adds to the sense that market participants are feeling that the worst is behind us”, said Alicia Levine, chief market strategist for BNY Mellon Investment Management. “People think they can see the other side of the curve.”
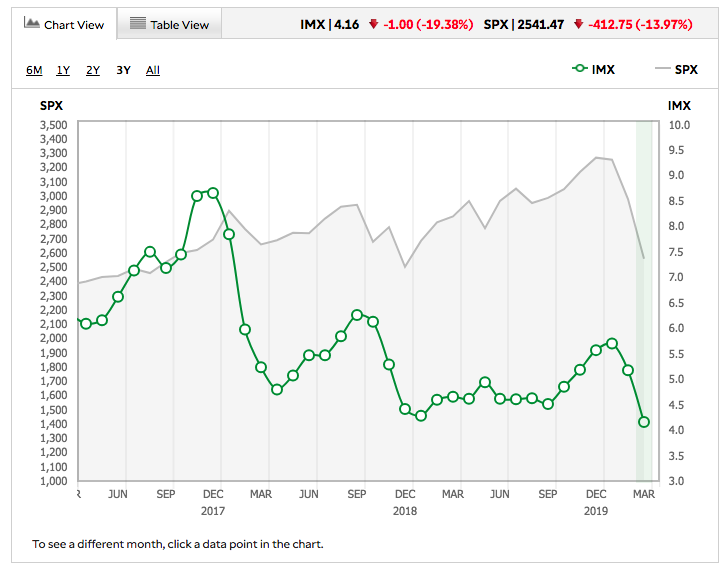
- Exposure to equity markets decreased in TD Ameritrade client accounts during the March IMX period. The IMX score decreased by 19.38%, moving to 4.16, down 1.00 from the previous period and reaching the lowest point in over seven years.
- TD Ameritrade clients were net buyers overall during the March IMX period, after net selling last month. However, heavy buying among names with lower relative volatility had downward pressure on the IMX score.
- Equities were net bought, in addition to fixed-income products as market volatility increased. The Cboe Volatility Index, or VIX, which measures volatility of the S&P 500 Index, increased above 80 for the first time since November 2008.
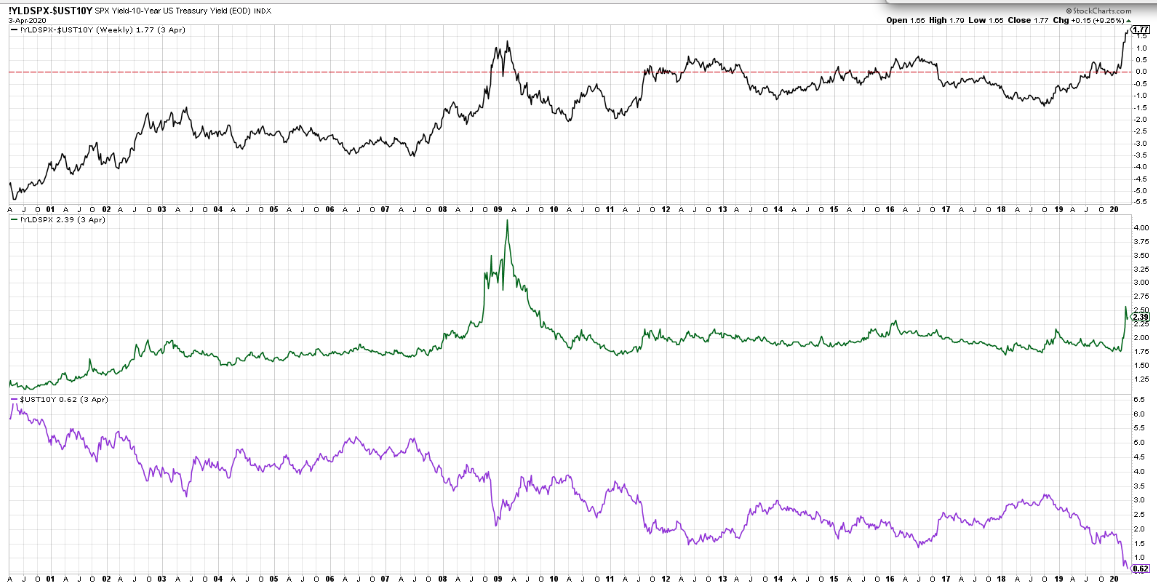
- SPX:10TYield record high
- SPX yield is 2.4%
This Time Is Different, Indeed
- There are important differences between the current crisis and the previous one. In the case of the coronavirus shock, consumer debt was not the cause of the crisis. Instead, this is a health crisis that will have spillover effects on consumer debt and spending. In other words, consumers started off on much firmer financial footing, helping to ease the impact of the shock.
- Also, this time the debt build-up has been in the non-mortgage sector, which is not as systemically important as the housing sector was in 2008. That said, a sudden surge of mortgage delinquencies following the spike in unemployment is a significant risk if the coronavirus disruption lasts longer than expected.
- Finally, the scale and speed of the policy response to this evolving economic crisis have been unprecedented. Much of what has been enacted over the past few weeks was implemented over the course of a year during the Great Financial Crisis 2008–2009.
- The massive $2 trillion in stimulus enacted through the Coronavirus Aid, Relief, and Economic Security Act (“CARES Act”) will help to offset some of the economic hardship through generously expanded unemployment benefits, rebates to low- and middle-income households, student loan relief and mortgage loan forbearance provisions, among other measures. Current policy is designed to address a relatively temporary economic shutdown (approximately 2-3 months).
- If the labor market stress lasts longer, more stimulus will likely be deployed to further assist consumer credit. In our view, given low inflation and interest rates, the U.S. federal government has the fiscal space to shoulder a larger debt burden, which would help prevent a more severe drawdown in economic activity.


