
Coming into Wednesday’s trading session on Wall Street, equity futures are pointed lower as media outlets seek out find a geopolitical story of consequence. With the U.S. and China engaged in trade talks, seeking a phase 1 trade deal, reporters gained access to President Donald Trump with the impetus to decipher progress on the trade front.
“The United States would raise tariffs on Chinese imports if no deal is reached with Beijing to end a trade war, U.S. President Donald Trump said on Tuesday, as reported by Reuters and dozens of media outlets.”

While this seems like a headline, a newsworthy story, it really isn’t anything new to the eyes and ears of the general public. The path toward a phase 1 trade deal has always been in play and the rhetoric from President Trump, also, has always been the same. Tough talk is simply the President’s modus operandi. Do you recall the President ever being asked, “What if China doesn’t acquiesce or a trade deal doesn’t come to be?”… And the President responded with, “Well if they don’t then we’ll send them rainbows and unicorns!” What do people really think he would say, come on! There’s no story beyond what we already know folks. Trade talks are ongoing and until otherwise announced, no new tariffs is the market expectation.
With this so-called trade headline circulating on Tuesday, the S&P 500 (SPX) finished lower by less than 2 points while the Nasdaq (NDX) finished in the green and the Dow Jones Industrial Average (DJIA) was weighed down by Home Depot’s disappointing Q4 guidance. If you think the market is responding to positive or negative trade headlines only, clearly the market disagrees with this notion. The market is a forward looking pricing mechanism and it is looking forward to a 2020 with trade de-escalation and a rebound in global earnings growth. Will this all come to pass, that’s the unknown and the proposed risks to the bull market rally.
At this point in the 2019 market rally, many investors are anticipating a market pullback. Miller Tabak suggest that, “.. if we DO continue to see a similar type of rally into the end of the year, that’s going to … take us into the New Year with an overbought condition that hasn’t been seen since early 2000 ..”
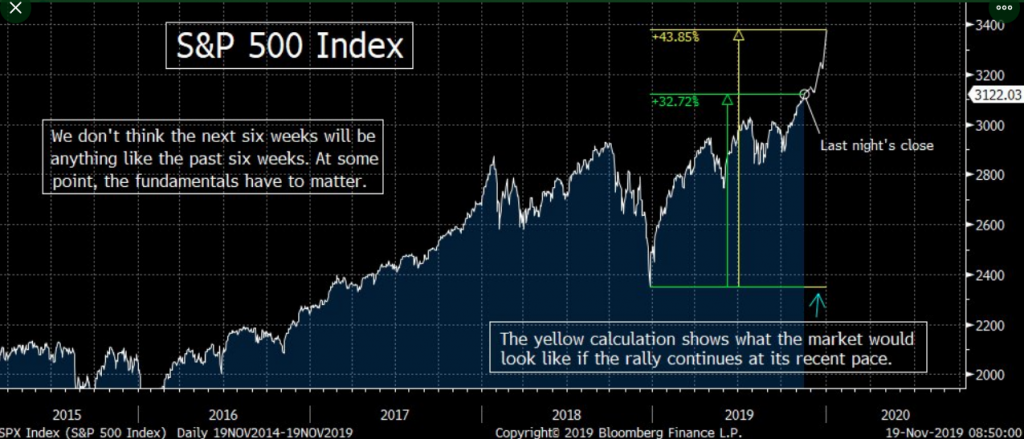
You won’t find too many market participants who believe in a complete melt up through year-end, not even Miller Tabak. Having said that, you also are unlikely to find many market participants unwilling to buy a market dip that finds more than a 3% drawdown from current levels. While it’s clear that markets are very overbought, most investors have few concerns presently.
“This market is grinding higher — yes, it’s overbought, but markets that get overbought can stay overbought for an extended period,” Craig Johnson, technical market strategist for Piper Jaffray, said. “This is the exact opposite of what we saw last year. The Fed is now easing or neutral, and they are expanding their balance sheet. Trade war concerns are subsiding. We are not breaking down. We are breaking out.”
If you think FOMO (fear of missing out) isn’t at play in the market as well, you might be proven wrong by the tape itself.
“Of the last 20 trading sessions, 15 experienced a positive closing tick, indicative of money inflows,” JC O’Hara, chief market technician at MKM Partners, wrote in a note today.
One factor that some market technicians find worrisome, however, is the lagging small cap Russell Index. To-date, it’s the only major index that has yet to set a new high, somewhat confirming what has taken place in the large cap indices. Dan Wantrobski, technical strategist at Janney Montgomery Scott, wrote in a recent note:
“The danger here is that eventually, these overbought large-cap indices (S&P 500 DJIA; etc.) will have to be reconciled against lagging small-cap benchmarks (like the Russell 2000 and Smallcap 600) — which have thus far failed to make new recovery highs. This non-confirmation out of the small/midcap area is creating a ‘negative divergence’ of sorts. In the past, such divergences have been resolved via corrections — although the timing of such is difficult to pin down at this time.”
If we lift the hood on the S&P 500, we can see a similar lag within the S&P 1500 sub-index. It also identifies weakness in small cap stocks, as depicted in the Bespoke Investment Group chart below:
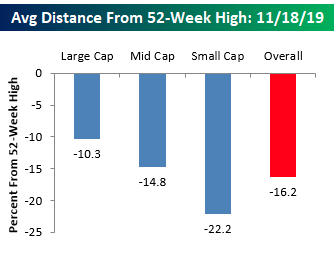
The chart illustrates the average distance that stocks in the S&P 1500 are trading with respect to their 52-week highs. For the S&P 1500 as a whole, stocks in the index are collectively trading an average of 16.2% from their respective 52-week highs.
While there doesn’t seem to be a whole lot of market and economic concerns out there in the analysts and strategist community, not everyone is complacent, despite what the VIX might be suggesting. Furthermore, not everyone is buying into the market and economic rebound into 2020.
“Joe Davis, the global chief economist and head of investment strategy at fund giant Vanguard says that, “In the year ahead, we don’t foresee a significant reversal of the [U.S.-China] trade tensions that have occurred so far. And with continued geopolitical uncertainty and unpredictable policy-making becoming the new normal, we expect that these influences will weigh negatively on demand in 2020 and on supply in the long run. U.S. growth will decelerate to about 1% next year, and China also will grow below trend.
Our near-term outlook for global equity markets remains guarded, and the chance of a large drawdown for equities and other high-beta [more volatile] assets remains elevated and significantly higher than it would be in a normal market environment.”
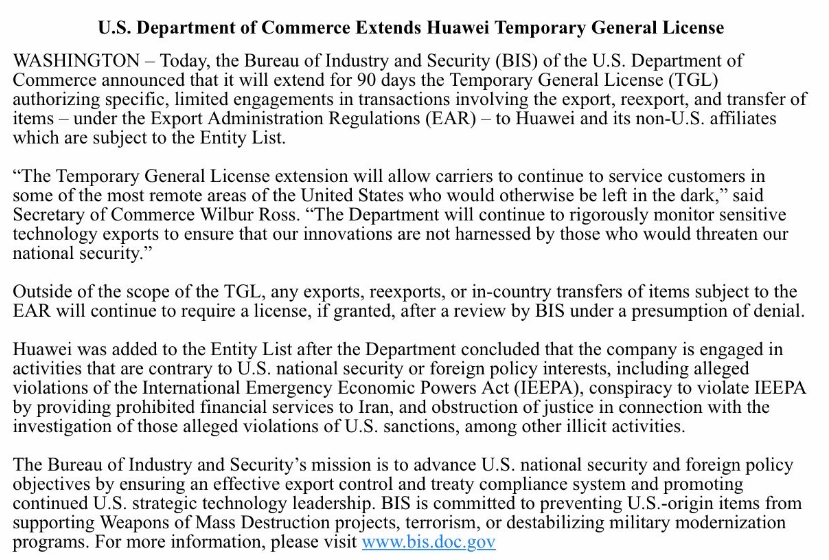
Anything is possible folks, but the current macro-climate doesn’t suggest the type of outcomes being forecasted by Joe Davis. This can certainly change with a tweet, but the calculus shows that escalating a trade war during an election year and impeachment hearing would prove a double whammy of sorts that the White House Administration likely finds undesirable. It would actually be very easy for the White House Administration to escalate the trade war using the “Huawei license” excuse, and yet it has chosen not to do so. Just 2 days ago, however, The Trump administration issued a 2-week extension of licenses allowing U.S. companies to continue doing business with China’s Huawei Technologies Co Ltd.
Can we just go one day in the market without talking about the trade war? On that note, Tuesday’s release of Housing Starts and Building Permits data came out rather strong for the month of October, with a positive revision to the September data to boot.
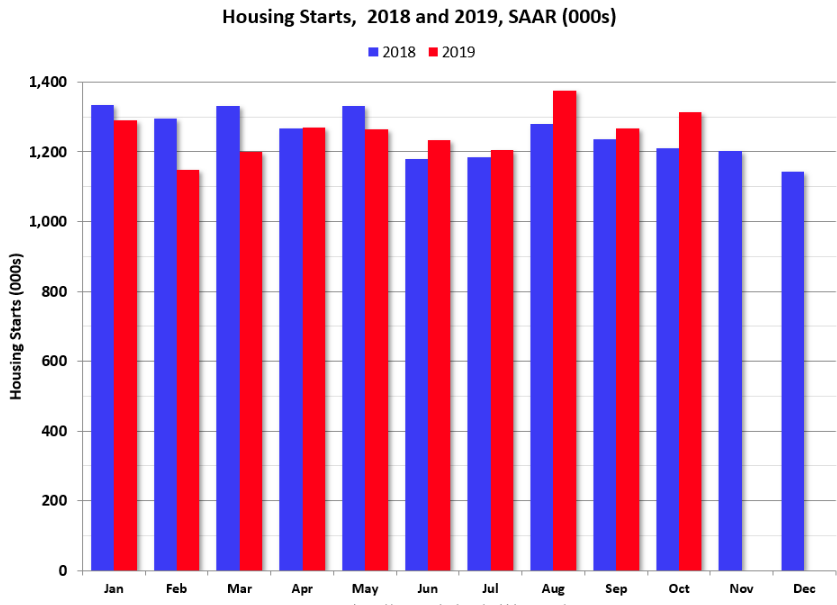
The housing starts report showed starts were up 3.8% in October compared to September, and starts were up 8.5% year-over-year compared to October 2018. Building permits for privately-owning housing units were authorized at a seasonally-adjusted rate of 1.461 million. That was 5% above the revised pace of 1.391 million set in September and 14.1% above last year’s rate. Economists had anticipated building permits to occur at a 1.390 rate.
There’s no economic data slated to be released on Wednesday. Energy sector investors/traders will be watching for the latest EIA crude oil inventory report, set to be delivered at 10:30 a.m. EST. After the closing bell on Tuesday, the American Petroleum Institute reported that U.S. crude supplies rose by roughly 6 million barrels for the week ended Nov. 15, according to sources. The API data also reportedly showed a stockpile rise of 3.4 million barrels for gasoline, along with supply decline of 2.2 million barrels for distillates.
Beyond the economic data calendar and crude inventory reports, investors will be combing through the FOMC minutes on Wednesday and once they are released at 2:00 p.m. EST. It’s unlikely that the minutes will prove market moving. There’s almost no expectation for Fed rate activity through the end of 2019, as the Fed has already signaled a pause in rate cuts. (CME Fed Fund Futures below)
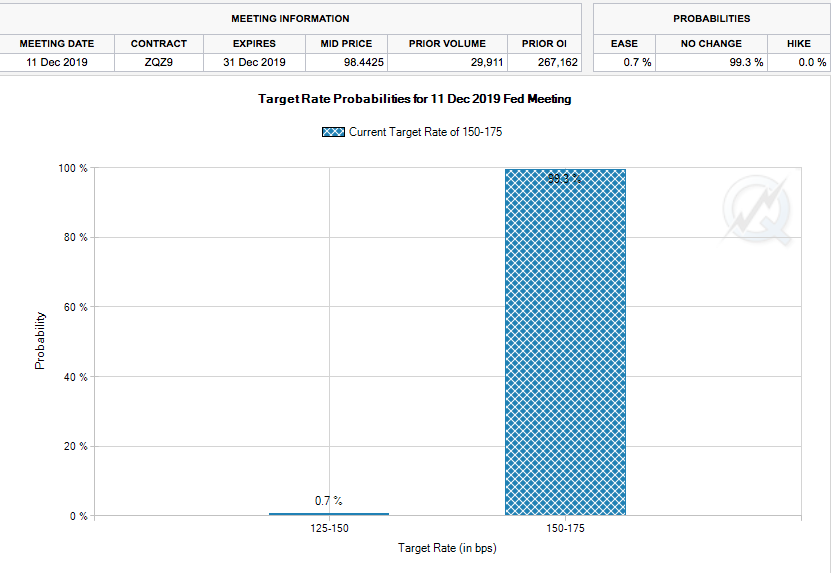
As shown in the CME’s FedWatch Tool above, investors expect the Fed to leave rates unchanged through December.
It’s not looking good for traders coming into Wednesday’s trading session and as we round out earnings season with some rough retail quarterly reports. Both Home Depot and Kohl’s (KSS) disappointed investors by missing forecasts and lowering Q4 guidance when they reported on Tuesday. Both stocks were hit pretty hard. The reality of the retail landscape is that it is increasingly competitive and found for lower gross profit margins. While sales are still growing in the case of Home Depot, department store retailers are under pressure from constant discounting and a shift to online sales.
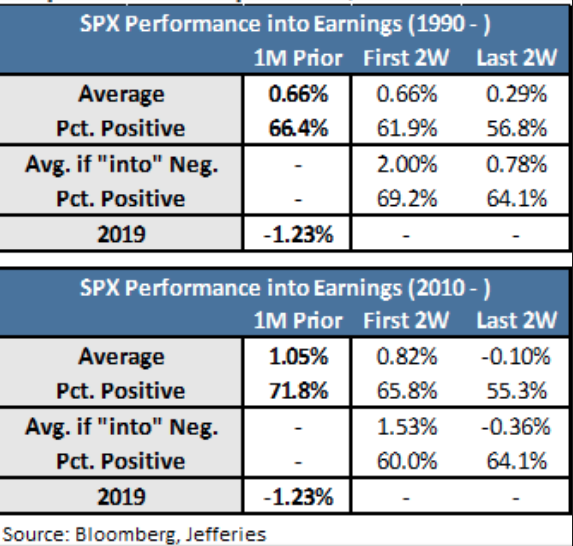
Retailers typically closeout earnings season. It’s probably why, over the last 10 years, we’ve seen earnings season provide a boost to the S&P 500 at the onset of the reporting period, and a downturn at the tail end of the reporting period.
On Wednesday, Lowe’s Corp (LOW) has already delivered Q3 2019 results to investors that surpassed analysts’ estimates on the bottom line but missed estimates for top line results. Here’s what Lowe’s reported compared with what Wall Street was expecting, based on a survey of analysts by Refinitiv:
- Earnings per share: $1.41, adjusted, vs. $1.35 expected
- Revenue: $17.39 billion vs. $17.68 billion expected
- Same-store sales growth: 2.2% vs. 3.1% expected
The next key report investors will be looking forward to will come from Target Corp. (TGT) ahead of the market open. FactSet is forecasting earnings per share of $1.19, up from $1.09 last year, on sales of $18.45 billion, up from $17.59 billion last year.
While the department store sector retailers have come under significant pressure over the last 5-7 years, Target has recently outperformed given its leverage to grocery sales. Over the last decade, Target has grown its grocery business sales, which now constitute almost 24% of total sales, up from 18% a decade ago. By comparison, Wal-Mart’s (WMT) grocery business is some 55% of total sales. This is the main reason that Wal-Mart has a significantly higher price-to-earnings ratio.
When dissecting the retail reporting season, it is always important to separate department store retailers from hypermarket retailers like Wal-Mart, Costco (COST) and Target. Unfortunately, only the department store quarterly results get the major headlines, tied together with bearish narratives that generalize the total landscape of consumer spending. Here’s one such misinformed tweet from Mike Larson:
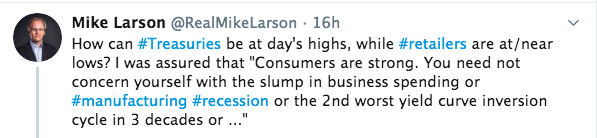
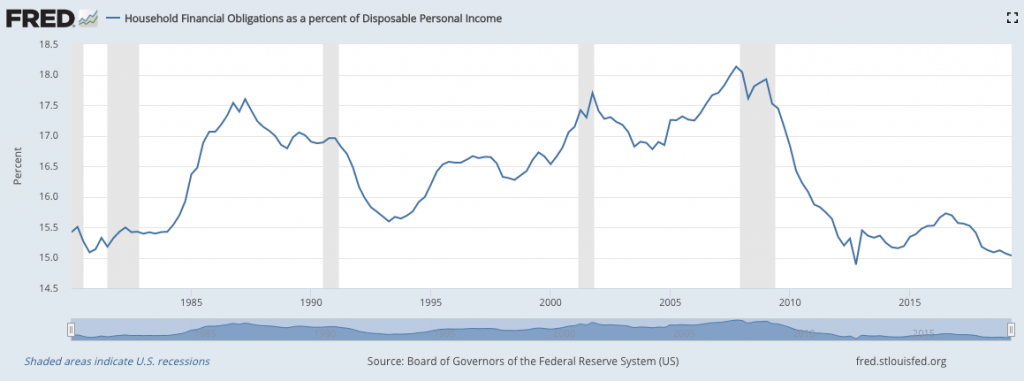
Retailers are not at/near lows, but department store retailers certainly are. And with regards to the consumer, who has ever increasing pricing power, we’re certain that total annualized retail sales of greater than 3% in 2019 represents part of the consumer strength. The other part of the consumer strength can be ascertained from their best balance sheet in nearly 50 years, as defined by Household Financial Obligations as a percent of Disposable Personal Income:
As it pertains to the consumer, they have and will have all the pricing power they desire, shredding department store profit margins for years to come. Amazon and online shopping technologies have made price transparency the key weapon used by consumers and against “full price”. There’s no way to put that horse back in the barn. The likes of Kohl’s, Macy’s (M), J.C. Penny (JCP), Dillard’s (DDS) and Nordstrom (JWM) will continue on their slow steady path of long-term decay and until inevitable dissolution or take-under. And by the way, Target just blew away analysts bottom line estimates!
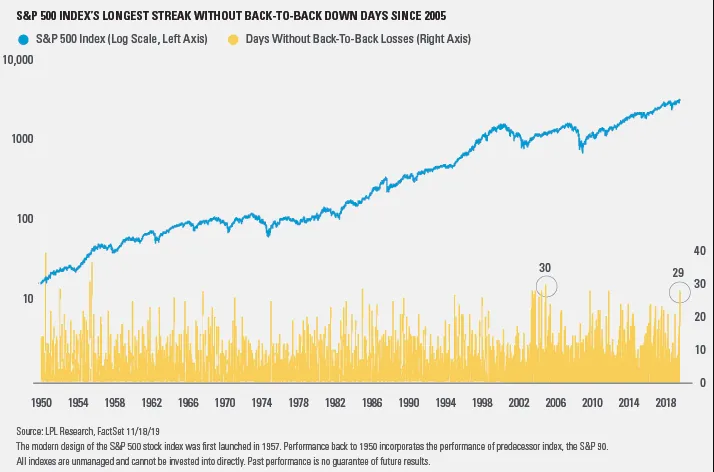
Alright, so the market is going to open in the red, with Europe largely underwater as well, following on the heels of a sell-off in Asian markets overnight. The S&P 500 falling slightly Tuesday now sets itself up for the end of a remarkable streak. The S&P 500 Index hasn’t had back to back losses for 29 consecutive days, according to the latest findings from LPL Financial. This is the longest streak without back to back down days since March 2005. It is worth noting that the S&P 500 gained another 5.8% three months after the March 2005 streak ended.
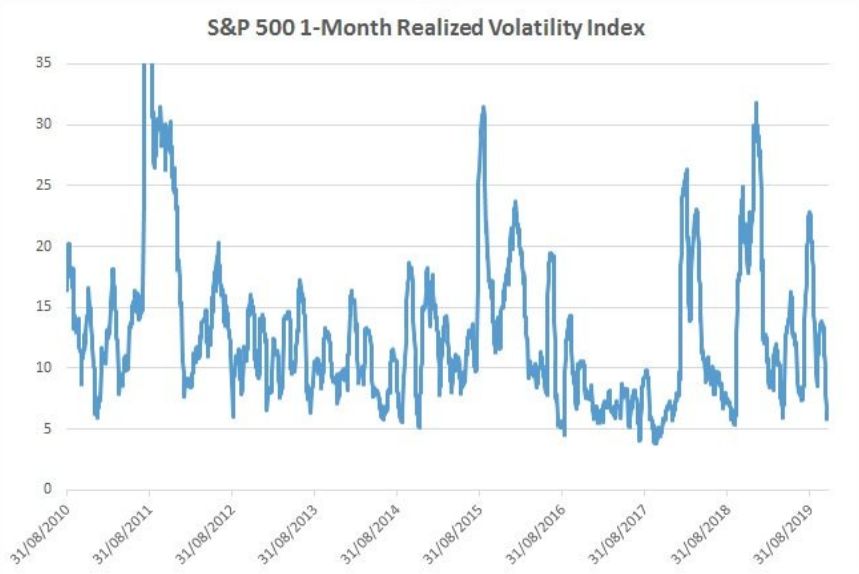
Another pretty interesting streak that speaks to market complacency and the low-level VIX reading over the last 30 days or so is that the S&P 500 hasn’t traded in more than a 1% intraday range (from low to high) for 26 days in a row. Realized market volatility has been extremely low. This is the longest streak in just over a year.
To-date, its’ been a remarkable rally in the 4th quarter and a pause/pullback is the most probable outcome near-term. A healthy check-back in the market whereby gaps are filled on the downside would be ideal, given the macro-outlook for 2020 remains positive. Unless that forward-looking sentiment shifts, we would anticipate investors are found buying a dip in the market, which may pave the way for the final leg higher through the December 2019 period. The most analogous chart of the 2019 bull market remains that from 2013, as depicted below:
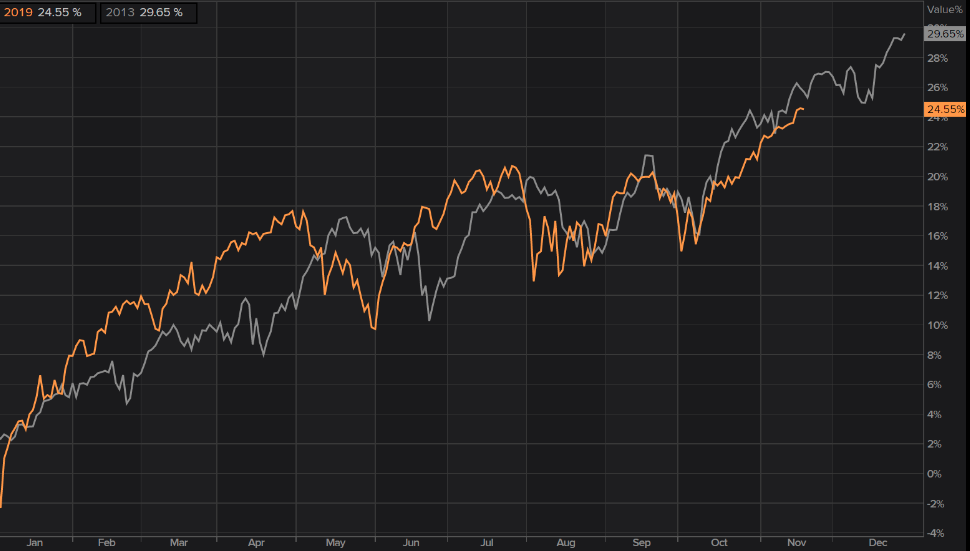
With the 2013 analogue in mind, and many still pointing to macro-issues akin to 1995/1998, if you think something strange is taking place in the market, you might be looking in all the wrong place… or you’re simply ignoring history.
As rosey an outlook as it might seem from the 2013 analogue above and the macro-picture from 1995/1998, we aim to deliver even-handed analysis and information. As such, we complete our daily market dispatch with some of the latest notes and thoughts from the team at UBS, regarding their 2020 outlook:
UBS 10 for 2020
- Growth muted. We expect growth to remain muted as the world adjusts to new political realities.
- Two-way uncertainty. In areas ranging from the US election to trade negotiations and economic policy, two-way uncertainty is higher than usual. Investments less exposed to the outcomes of political choices are preferable.
- Diversify before US election. The US technology, energy, financial, and healthcare sectors could be subject to volatility stemming from increased regulatory scrutiny. Diversification is key.
- Domestic and consumer. In a more protectionist world, companies that rely on domestic and consumer spending look more resilient than those exposed to foreign and business spending.
- Dividends and quality. In this environment, we think dividend and quality (including ESG) stocks are well positioned.
- Prefer EM debt. Yields on the safest bonds are low, while risks are rising among some high yield issuers. We recommend emerging market US dollar-denominated sovereign debt and opting for bonds supporting sustainability and related purposes over traditional bonds.
- Weaker dollar. We see the US dollar weakening and favor a combination of safer and higher yielding currencies.
- Gold to outperform. Gold should outperform more cyclical commodities, in our view.
- Low-beta alternatives. We prefer private market strategies less dependent on the macro backdrop, and relative value and market neutral strategies within hedge funds.
- Real estate risks. Risks in the owner-occupied housing market are elevated in a range of major cities. Investors should seek commercial real estate exposed to long-term trends like e-commerce and rental housing-oriented real estate.


