
After another modest gain for the major indices on Monday, equity futures are pointing higher. Trade headlines found investors grappling with mixed messages coming from media outlets, for which we wouldn’t certify as anything more than speculation. The main headlines came out from CNBC’s on the ground reporter Eunice Yoon, suggesting that President Trump ruled out rolling back tariffs, something Chinese officials believe critical for applying a phase 1 trade deal.
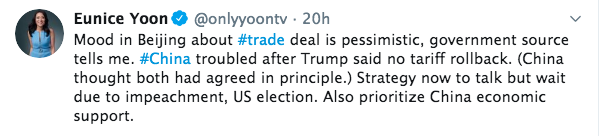
The reporting from Eunice Yoon seems to be taking a back seat on Tuesday morning, however, as new reports surface. The latest “scoop” is that China’s Vice Premier Liu He remains upbeat on trade talks and is looking forward to an agreement. Taken together, Finom Group suggests that absent White House and China rhetoric of late to disavow or confirm negotiating prospects beyond the typical President Trump, “Talks are going very well”, a vacuum in the story has been created for which media outlets are fulfilling with any little blurbs that can be sensationalized for clicks and viewership. Nothing to see here folks, nothing to see here… for now!
Most importantly, as global equities continue to rise daily, is the ever increasing euphoria and pullback rhetoric. Yes the equity put/call ratio is very, very low.
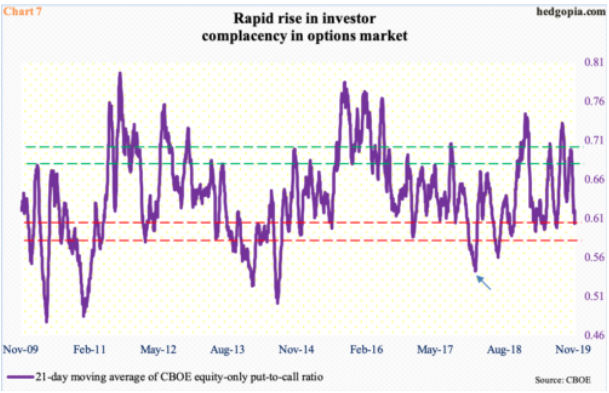
As Paban Pandy offers in the chart above, the options market has been providing very cheap protection, signal a potential top in the market is forming with a bottoming in the equity put/call ratio.
“In the options market, the CBOE equity-only put-to-call ratio printed 0.49 last Friday, preceded by Thursday’s 0.47. In the last 16 sessions, there were 12 readings of 0.50s or lower, while three were in low 0.60s and one in low 0.70s. Calls are being snapped up left and right.
Consequently, the 21-day moving average of the ratio ended last week at 0.604, down from 0.699 on October 18; unless the ratio prints unity today, it is all but certain it enters high 0.50s. Historically, it tends to bottom at high 0.50s to low 0.60s (Chart 7). But several times in the past, it went lower still. Late January last year, it went as low as 0.543 (arrow). In a matter of a couple of weeks back then, the S&P 500 corrected nearly 12 percent. This is the risk building right now. “
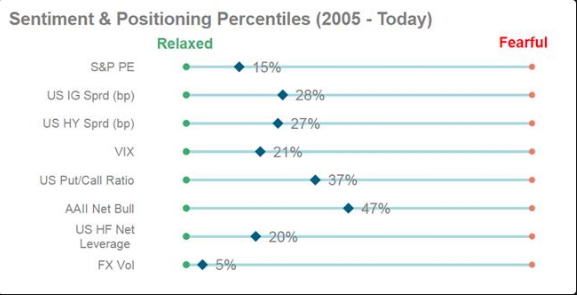
So while we can see that protection is cheap and found with lesser demand in the options market, we can also see that complacency is running rampant as well. The latest Sentiment and Positioning data from Morgan Stanley helps to define this point of fact. Morgan Stanley’s Data also takes into consideration the VIX and the U.S. put/call ratio as identified in the chart below:
Undoubtedly, this latest leg in the record-setting bull market has brought about a certain degree of animal spirits. But it’s important to reflect on when the latest rally took hold and how. The Q4 2018 period on Wall Street was one that corrected the bull market by nearly 20% through the Christmas Eve trading day. The New Year (2019) was met with severely lowered expectations, bearish sentiment brought about by an accommodative global central bank easing cycle that may prove to stave off a recession, lower rates/yields and recessionary fears that have become unrealized. This late in the year, now investors are looking forward to a resumption of earnings growth in 2020 and de-escalating trade tension that may prove a tailwind to global growth into 2020. So while it’s certainly getting frothy in the markets and sentiment is rapidly improving with investors rotating out of defensive sectors and into more growth and cyclically oriented sectors, many investors may view this as mean reversion and not frothy conditions at all. In terms of sentiment, animal spirits if you will, the boat had been leaning in the exact opposite direction for most of the year.
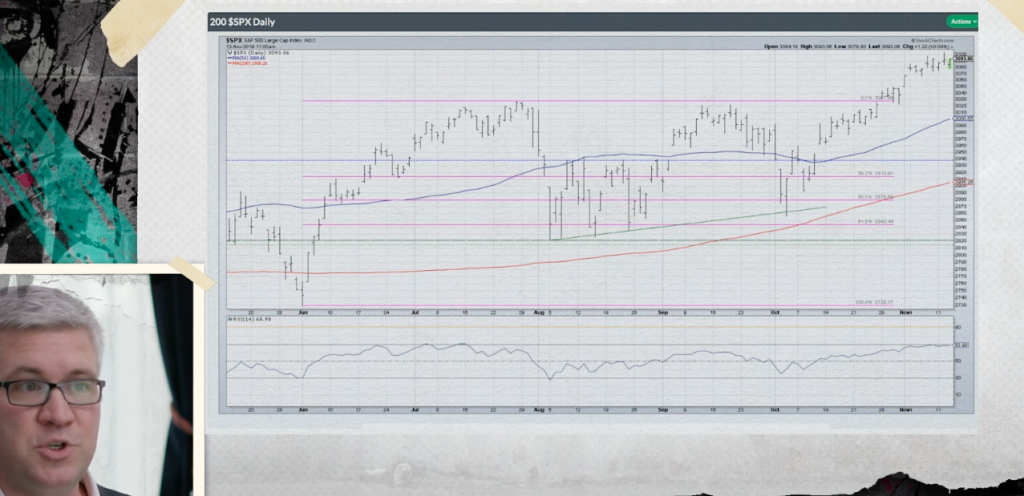
It’s only recently and since the S&P 500 broke out and beyond a nearly 2-year consolidation zone that animal spirits have been renewed. As we can see from the screen shot, within the latest Real Vision video featuring technical analyst David Keller, the pink line represents the elongated consolidation zone. It’s only in the last 5 weeks that the S&P 500 has made a clean breakout! And do check out the video.
Speaking of sentiment, some might say when the bears cave/fold and change their tune on the markets and economy, that’s when the bulls should worry the most. This is what Finom Group suggests is nothing more than a conspiracy theory, a contrarian conspiracy theory the likes of which we could see peddled by the infamous Seinfeld character George Castanza. If you’re looking for a market issue or something to worry about, why make this one of them. Nonetheless, Morgan Stanley’s team of analysts are now realizing with less than 5 trading weeks to go in the year, their bearish 2,700 price target for the S&P 500 is unlikely to become realized.
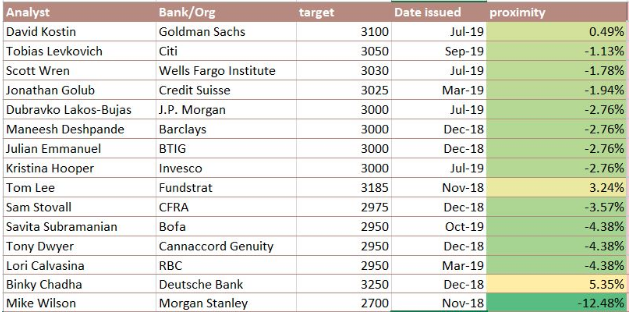
Here are some of the recent notes from Morgan Stanley’s chief U.S. equity strategist Mike Stanley:
- We raise the Dec. 2020 base forecast to 3000, from 2750. “As the Fed continues expanding its balance sheet by $60B/mo, the S&P 500 could overshoot the upper end of our year-end bull case of 3250.”
- “Our economists think the U.S. will avoid a recession next year .. it does not change our forecast for little to no earnings growth, as overall growth remains slow and margin pressures persist.”
In typical Mike Wilson fashion, who we assume will be a guest on CNBC in the not too distant future, he throws a bit of cold water on caving toward a more favorable outlook by stating the following:
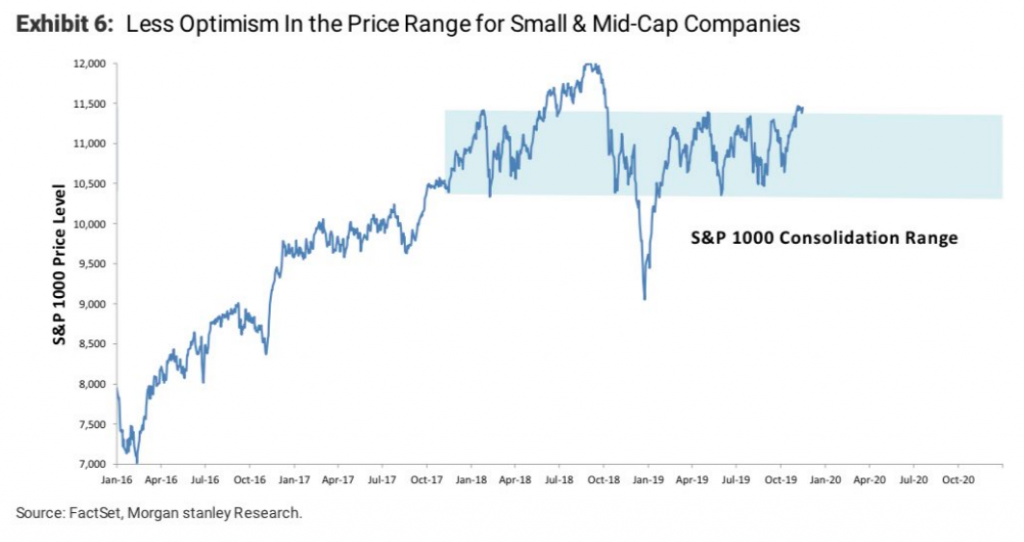
“The S&P 1000 is “more representative of the ‘average’ US stock” — and its “failure to participate to the upside suggests that the market is not yet ready to fully underwrite a growth and profits recovery.”
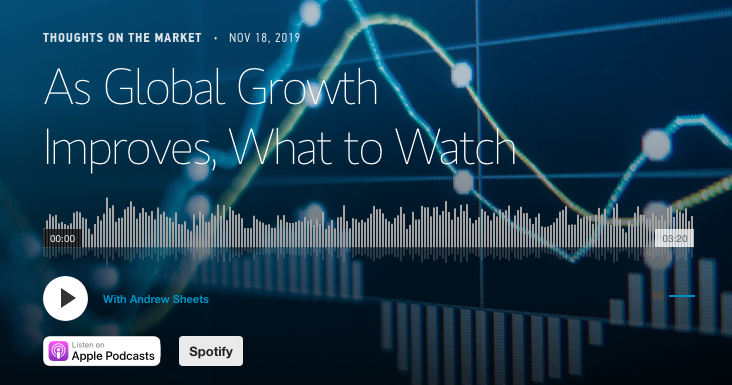
Like we said before, if you’re looking for a market issue to suit your fear and/or bias, the market is found with plentiful issues. No market cycle is found for perfect conditions, that’s just not the way risk works. But make no mistake about it folks, Morgan Stanley’s team of analysts, including their chief cross-asset strategist Andrew Sheets have fully caved to the demands of the bull market and their misappropriated bear market thesis that pervaded the investor landscape in 2019. In his latest podcast, Andrew Sheets discuss the probabilities for stronger economic growth in 2020.
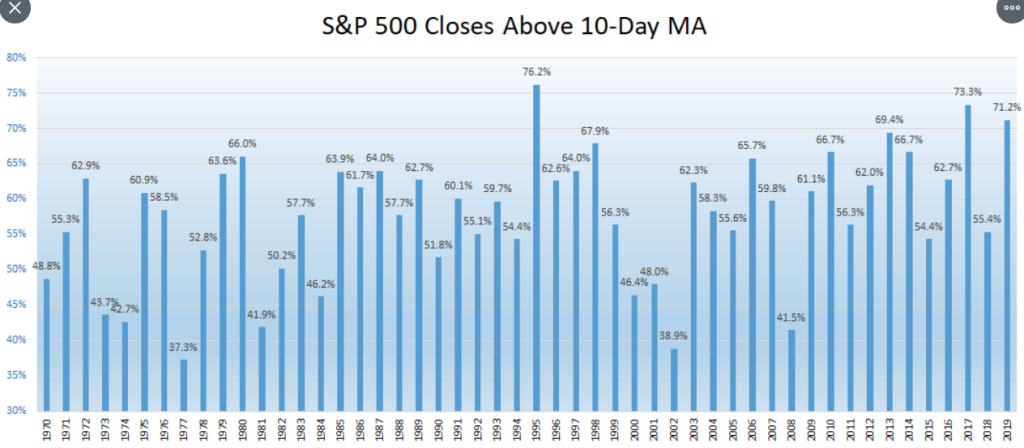
2019 has found the S&P 500 performing much as a reminder to the 2017 period, where the phrase “buy the dip” became prominent and is now a financial market staple. There’s no maybe about it folks, every dip in 2019 has been bought, it’s just a matter of when it got bought as we’ve witnessed 2 separate 5%+ pullbacks during the calendar year. How persistent has the bid been for the S&P 500 in 2019? According to LPL Financial’s Ryan Detrick, 71.2% of all the days so far this year have have come with the S&P 500 closing above the 10-DMA. Only 1995 and 2017 where higher since 1970.
Apparently, this was not so apparent to Morgan Stanley through the first 2 quarters of the year and as they beat the bear drum endlessly, with calls of a 10% correction. Least we forget Mike Wilson’s bearish call from this past July as follows:
“The third time is “not the charm” for an S&P 500 breakout, according to Morgan Stanley.
Despite the S&P 500 closing at an all-time high Friday, the index’s internals and fundamentals are too weak to maintain the rally, the firm said.”
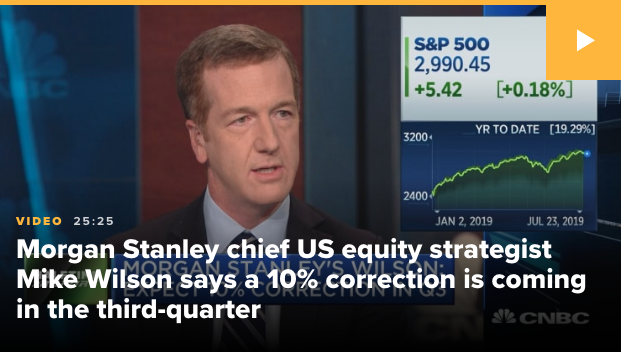
“While our 2400–3000 call from 18 months ago may look vulnerable, we think this latest surge will fail again, as we don’t expect a Fed cut to rekindle growth the way market participants may be hoping, and now pricing,” said Mike Wilson, Morgan Stanley’s chief U.S. equity strategist and chief investment officer, in a note to clients Monday.”
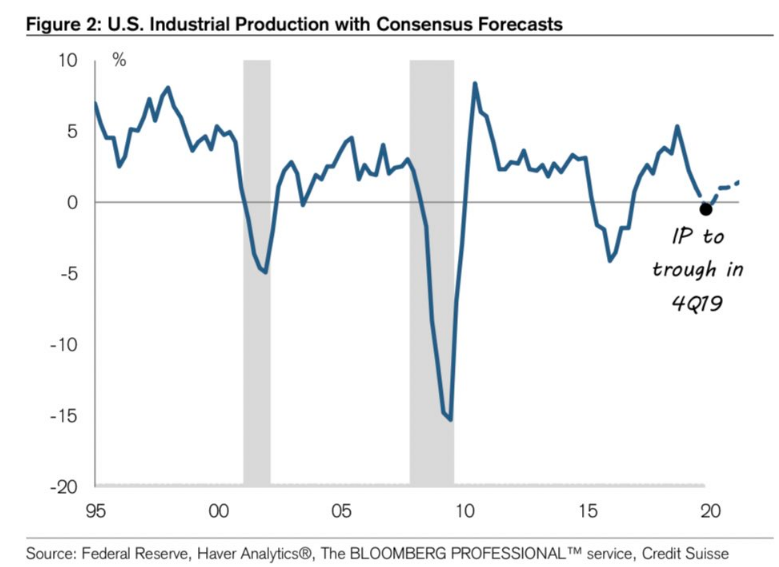
Oh Mr. Wilson… But where Wilson’s bearish narrative turns more optimistic going forward, others continue to ratchet their S&P 500 price target. Credit Suisse initiates a 2020 S&P 500 target of 3425, representing 9.8% upside from last Friday’s close. The firm cites a “reversal of decelerating economics” and multiple expansion. Upgrades financials, industrials, materials and energy. Downgrades staples, utilities, REITs and communications. They also suggest the Industrial Production cycle will rebound.
While market breadth and/or strength has been very strong, laying waste to many permabears throughout the year, the latest rally is proving more consequential. It’s actually feeding renewed bearish sentiment that is highlighted by calls for a market pullback. Don’t get us wrong, such a pullback would prove an added benefit for the market longer-term and healthy, but it’s the manner for which pullbacks are herald the slants a bearish narrative. But are such calls for a pullback warranted based on what we see in sentiment and/or market breadth? That’s highly subjective in our opinion, but here is what we do know from the black and white data/statistics. Check out what highly regarded market technician David Settle discovered from the latest breadth thrust in the markets. (Stats and Chart)
- The current 8% move off 10/8 low without a 1% pullback (on closing basis) is the 4th biggest such move in the past 5 years behind [VIX at 20.3 on 10/8):
- 12.02% gain off 11/15/17 low (VIX=13.13)
- 9.48% gain off 6/27/16 low (VIX=23.85)
- 9.1% gain off 1/3/19 low (VIX=25.45)
The sample size is rather small, but that’s kind of the point. Over the past 5 years, it’s rare to see such unabated uptrends. Another question, given the market’s apparent strength and unwillingness to pullback at least 1%, one might ask themselves if this is the proverbial “blow-off top” we hear so much about in the media? Chris Ciovacco aimed to identify past representations in the market where the same question might have been asked.
“When the stock market peaked in 1987, it was extended in a big way. The gain over the previous 661 calendar days was 76%.“
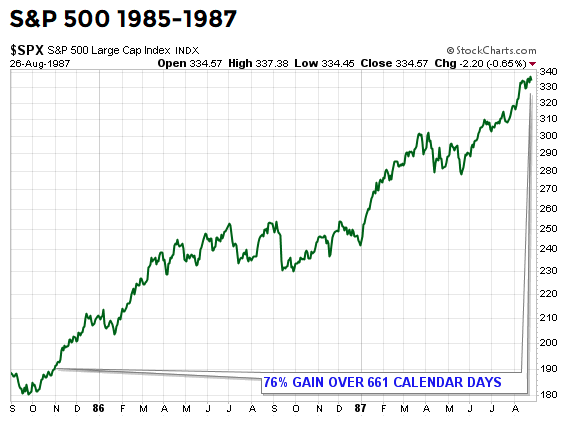
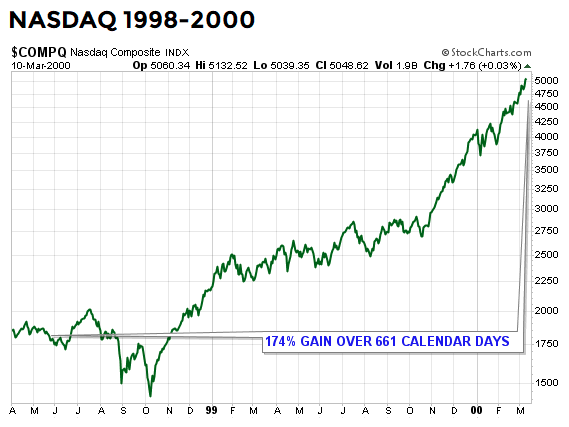
“Blow-off tops are rare, but they do occur from time to time. One of the best examples in history is the final leg up in the NASDAQ before the bubble popped in 2000. It is an understatement to say the market was extended and vulnerable on March 10, 2000. Looking back at 661 calendar days from the peak, the NASDAQ had tacked on an unbelievable 174%.”
“Instead of posting eye-popping gains, like 97%, 76%, or 174%, if we look back over the last 661 calendar days, the S&P 500 has gained a modest 8.5%. Risk speaks to being extended from a base (see three cases above). In 2019, we are just now trying to break out from a long-term base. Relative to history, the terms “melt-up” and “blow-off” do not apply to the facts we have in hand today.“
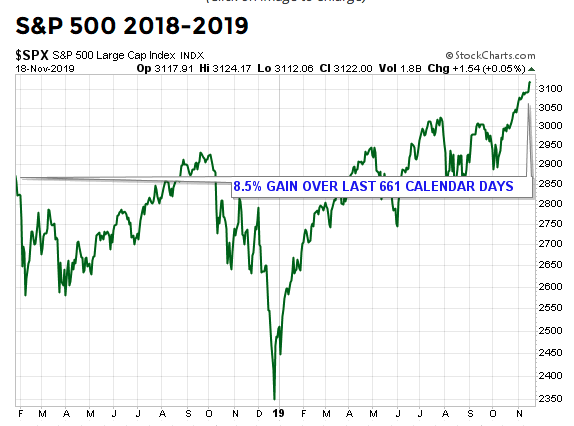
Just 8.5% over the last 661 calendar days folks. If you don’t think this time is different, you’re not paying attention. The fact is that every market cycle is different and as such we shouldn’t allow the past or the most recent market performance dictate our beliefs and understandings of the many probabilities that exist for the market going forward.
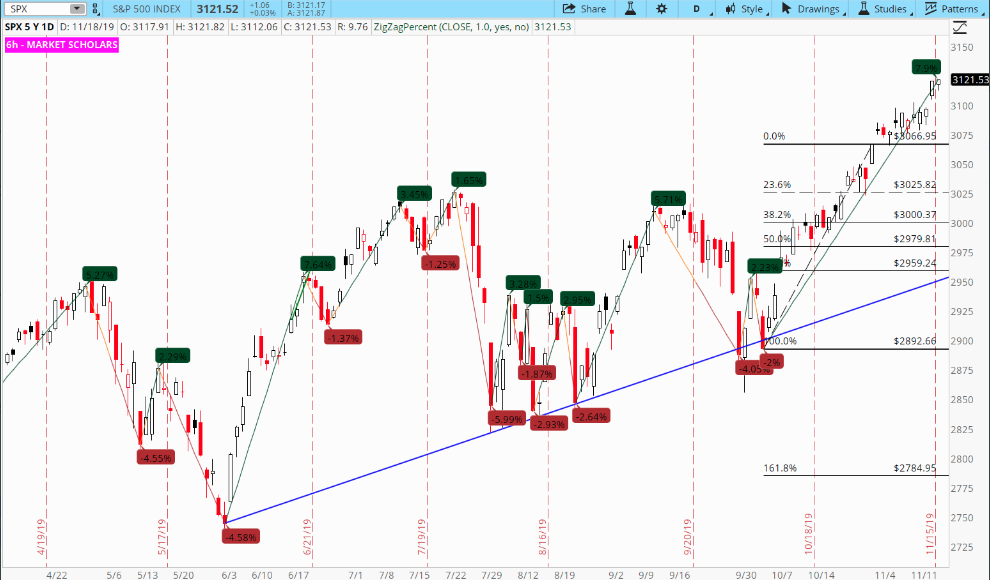
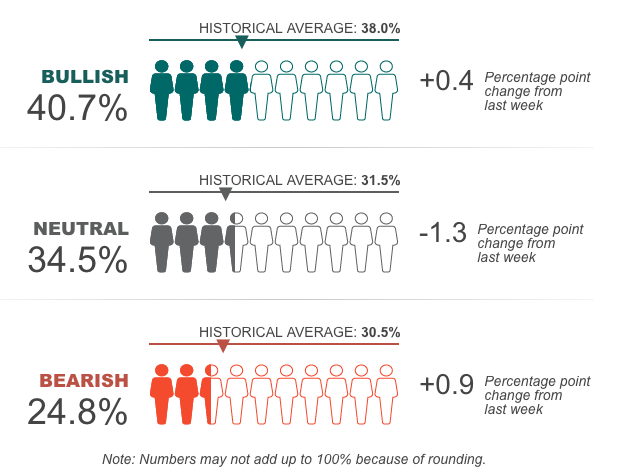
The S&P 500 has gone nowhere for quite some time. It’s only recently that the market has recouped the losses from the near 20% correction in Q4 2018 to draw even over the last 18 months. And from that point, we have finally broken out, with only modestly improved market sentiment according to the latest AAII survey of investor sentiment. Bullish sentiment as of last week’s survey is only 2.7% above the historical average.
So much data, statistics and history to understand in the markets, so little time! And that’s before we even touch on earnings season. But to that point…
Third quarter S&P 500 earnings growth is tracking to a 2.3% year-over-year decline, nearly 2 percentage points above the September 30 estimate with about 470 S&P 500 companies having reported and according to FactSet. S&P 500 earnings estimates for the next 12 months have fallen 1.7% since September 30 amid tariffs, ongoing policy uncertainty, U.S. manufacturing weakness, and slow international growth. This week, another 15 S&P 500 companies report results, including several leading retailers. Slated for earnings release today are as follows:

After seemingly strong results from Wal-Mart (WMT) last week, Home Depot (HD offered up a miss on the top line for the Q3 period when it released results this morning. Shares of Home Depot were down more than 5% in premarket trading. Here’s what the company reported compared with what Wall Street was expecting, based on a survey of analysts by Refinitiv:
- Earnings per share: $2.53, adjusted, vs. $2.52 expected
- Revenue: $27.22 billion vs. $27.53 billion expected
- Same-store sales growth, global: 3.6% vs. 4.7% expected
Home Depot said earnings fell to $2.8 billion, or $2.53 per share, from $2.9 billion, or $2.51 per share, a year ago. Sales increased 3.5% to $27.22 billion, just shy of analysts estimates of $27.53 billion.
Home Depot trimmed its full-year revenue outlook, partially due to potential tariff impacts. It estimated the Dec. 15 tariffs and the 25% tariffs already in place could raise its cost of sales by about $2 billion, or about 2% of annual sales. Home Depot CEO Craig Menear also cited continued lumber deflation for the lower sales forecast.
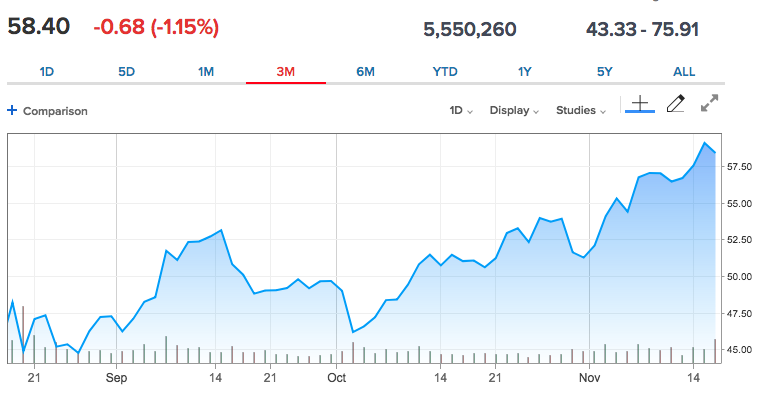
Investors are also anticipating earnings results from Department store retailer Kohl’s (KSS) and discount retailer T.J. Maxx (TJX) due out ahead of the opening bell this morning. Kohl’s faltered, again, with it’s Q2 report, missing on both top and bottom line, but the share price has rebounded strongly throughout the quarter. It was a rather terrible report from Kohl’s, and after the initial plunge in the share price, the stock has since rallied over the last 90 days ahead of the quarterly release.
Like many of Kohl’s peers, the Department store sector is under attack from a shift toward online shopping and fierce shipping competition from online retailers, who continuously make it cheaper and convenient to shop online.
Heading into the all-important holiday shopping season, retailers are aware that Thanksgiving falls late this year, making for the lowest possible number of days from Black Friday to Christmas Eve since 2013. What’s interesting about holiday shopping of late is that it has become less important to retail sales over the past 2 decades.
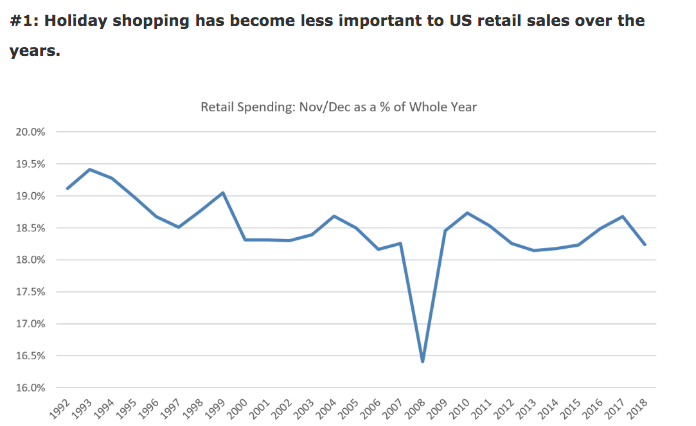
According to DataTrek, but not in the chart and worth noting: specific retail formats like department stores do have outsized Holiday exposure. Over the last few years 24% of their annual sales fall in November/December. Jewelry stores are even higher, at 27% – 28%.
Although retail sales have grown throughout the expansion cycle, of late we hear a good deal of investor rumblings concerning discretionary spending. It’s not coming from the retail sales or consumer spending data, which have proven strong through 2019, but rather sector ETF issues. Many investors are looking at the Consumer Staples ETF (XLP) ratio to the Consumer Discretionary ETF (XLY) ratio and suggesting that because XLY is lagging, it is a read on the health of the consumer. This is blatantly, almost negligently false. So hear is what we see in the charts of Consumer Staples and Consumer Discretionary ETFs that may prove invaluable and as outlined by David Keller once again.
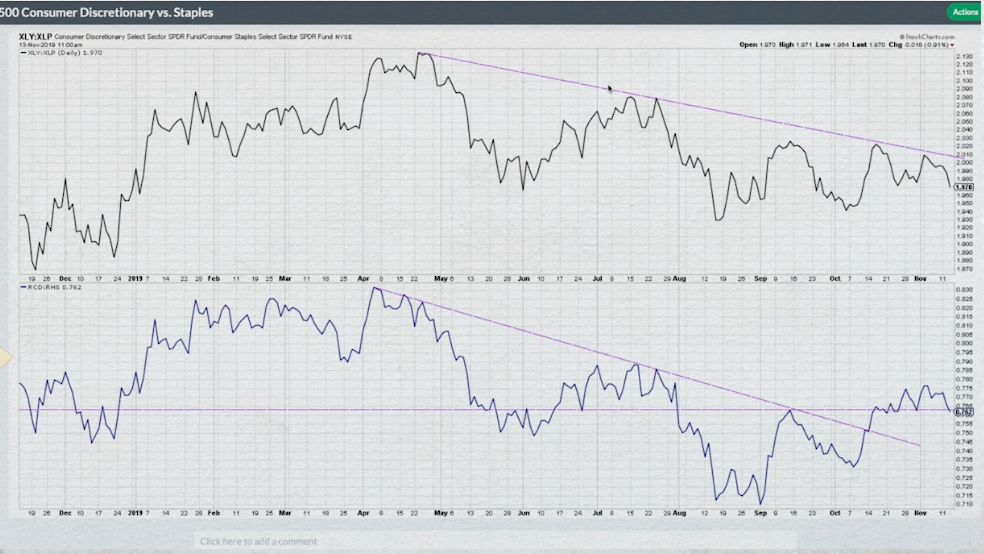
The chart on top shows a clear downtrend in the XLP:XLY ratio, indicating consumer discretionary weakness. But here’s the problem with market cap weighted ETFs. Check out the holdings within the XLY below:
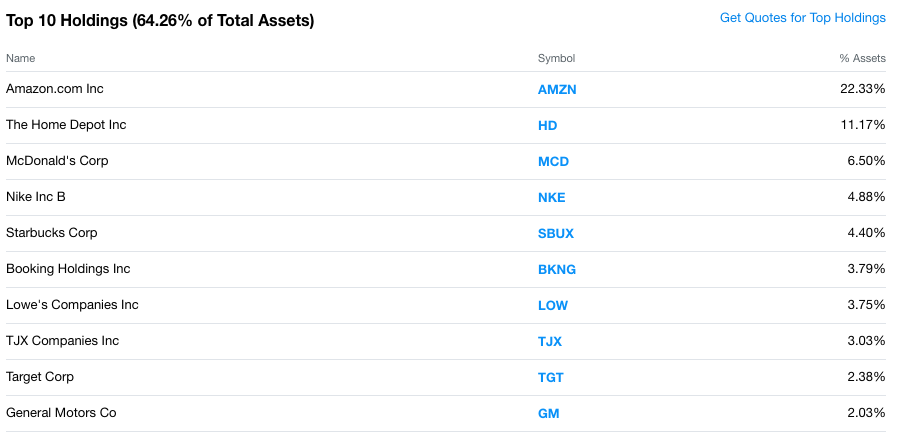
Amazon (AMZN) and Home Depot make up some 33%+ of the holdings within the Consumer Discretionary ETF. Shares of AMZN have been a staunch laggard when it comes to its typical annual performance, for which has weighed on the XLY performance in kind. And do we think the XLY’s performance will improve with Home Depot’s lowered guidance and share price pressure this Tuesday morning? It seems unlikely. But, but, but…
When we look at the bottom chart offered by David Keller, the equal weighted XLP:XLY ratio, it shows a breakout.
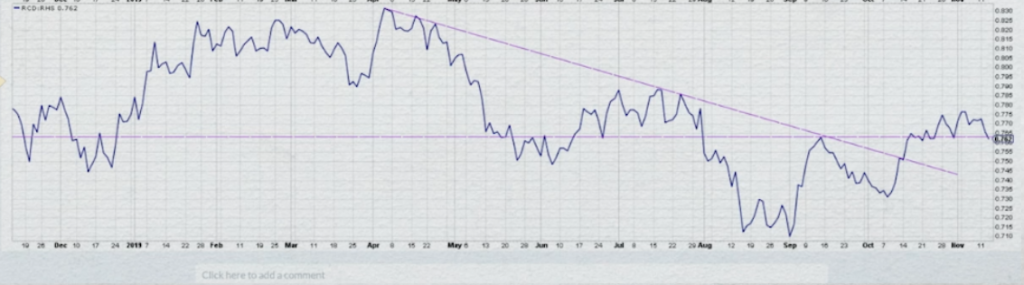
In other words, there’s not really an issue with consumer discretionary spending, there’s an issue with ETFs that are found with market cap weighting extremes.
Equity futures are losing a bit of their early pre-market luster, but stay tuned folks. In our next article, we’ll discuss a recent “chart crime” as offered below. Can you tell why this is a chart crime?
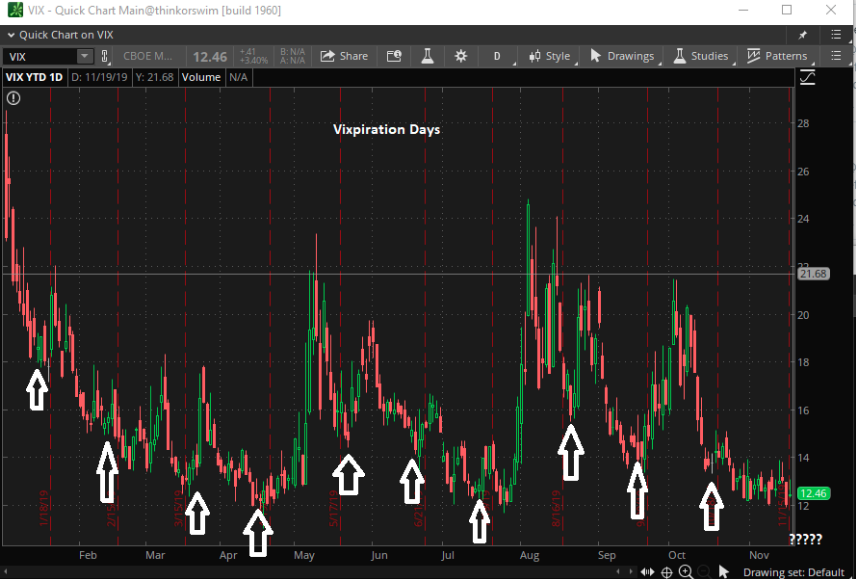
The chart seems to highlight YTD VIX futures expiration days, which also seem to be followed by an uptick in the VIX. So what’s the problem?


