
The “big news”, maybe, headline yesterday was delivered through the Personal Consumption and Expenditures (PCE) data. The inflation gauge rose to a 12-month rate of 2%, hitting the Federal Reserve’s target for the first time in nearly a year. The 12-month increase in core rate of inflation was close behind, rising to 1.9% in March from 1.6% in the prior month. That’s the biggest yearly gain in the core rate since April 2012. The PCE index was unchanged in March. The core rate rose 0.2 percent.
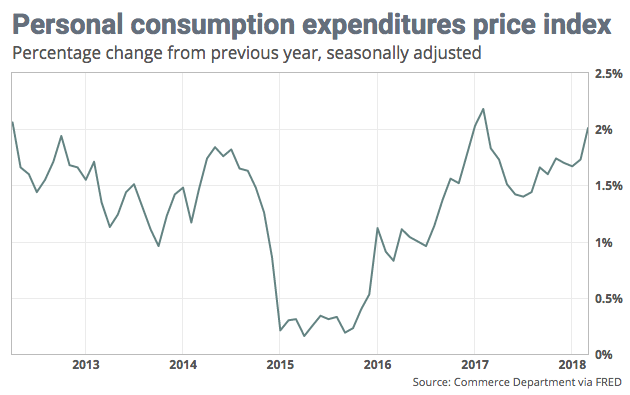
The inflation figures are included in the government’s monthly report on consumer spending. Outlays/Spending rose 0.4% last month, the first increase since the end of 2017. Incomes climbed 0.3% in March and in line with expectations. Rising incomes are helping consumer sentiment that is feeding through to purchasing power, but consumers did dip into their savings in March. The savings rate dropped to 3.1% from 3.3 percent.
The PCE data comes shortly after last weeks first look at Q1 2018 GDP, which rose at a 2.3% pace and above economists’ expectations of 2 percent. Within the reported data was a rise in labor cost. The employment cost index rose 0.8% in the first quarter, a tick above the MarketWatch estimate. The cost of worker compensation in the form of pay and benefits climbed to yearly rate of 2.7%, the biggest gain since 2008. Although the pace of wage increases is rising in a tightening labor market, it is still at relatively low levels especially when considering the stage of the economic cycle.
What the data all points to, GDP and PCE, is the likelihood of the Fed to raise rates 4 times instead of 3 times in 2018. Basically 1-quarter point rate hike each quarter. This was the widely feared projection of analysts that came into question during the month of February and as the January Nonfarm payroll report showed a spike in wages. It’s become more a reality recently as the inflation data, tame as it may be, is achieving the Fed’s target.
“Core prices “won’t sustain” that first-quarter pace, which is partly a rebound from sluggish numbers late last year. Ian Shepherdson, chief economist at Pantheon Macroeconomics.”
The Federal Open Market Committee begins its’ 2-day meeting today that will culminate with its policy statement on Wednesday. No rate hike is expected for this meeting cycle, but the forthcoming language on the economy and Fed’s outlook on inflation/rate hikes will be of key consideration to investors and analysts alike. With that, let’s take a look at Fed Fund Futures to see the advance in probability for a 4th rate hike.
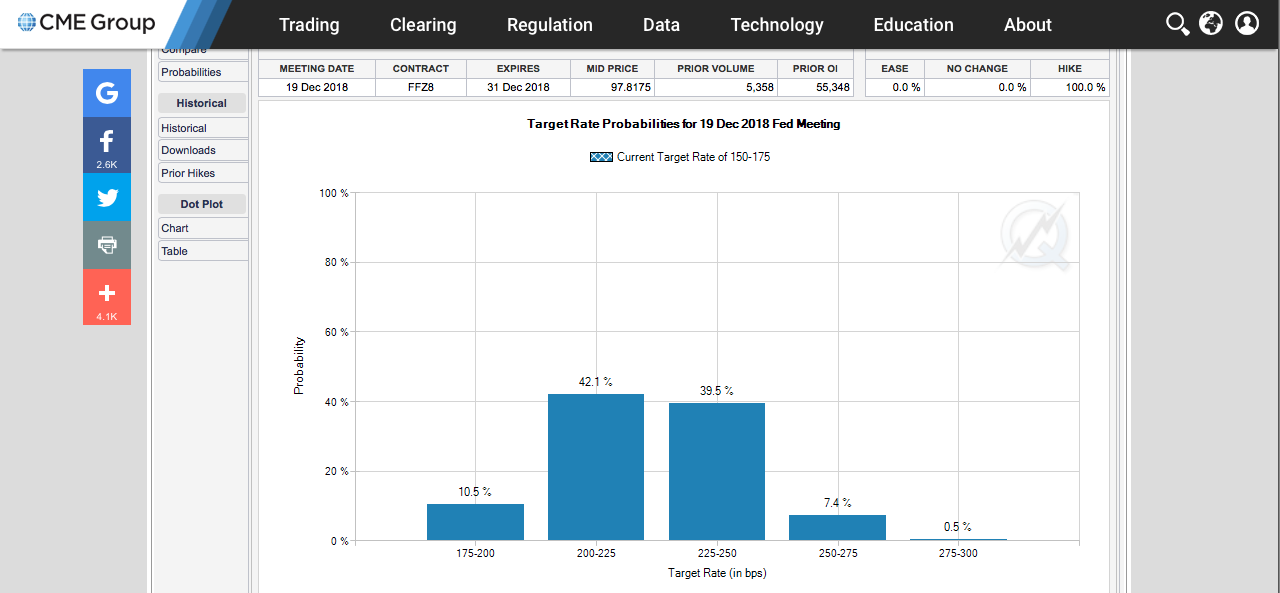
The CME computes the probability of a rate hike by taking the end-month futures contract, subtracting the level at the beginning of the month, and dividing that by 25 basis points, which is the assumed level of each rate hike. As shown in the chart from the CME, the probability for a 4th rate hike to occur in the month of December is gaining traction. Since April 27, 2018, the contract has increased the probability by .5 percent. The rising probability of a 4th rate hike falls inline with what many are coming to grips with. David Donabedian, chief investment officer at CIBC offered his take on inflation and the Fed during an aired segment on CNBC recently and as follows:
“It really depends on whether it’s perceived that the Fed is ahead of the curve a little bit,” said David Donabedian, chief investment officer at CIBC Atlantic Trust. “In other words, are they responding to a tiny acceleration in the inflation numbers or really reacting to rising confidence in the strength of the expansion.
“If the fourth rate hike is viewed in that context, it’s not much of a problem for the market,” Donabedian added. “If the inflation number starts to accelerate further it becomes more of a problem. Then the psychology becomes, uh-oh, maybe four isn’t enough.”
As we mentioned earlier in the week, the data and earnings schedule would pack the week full of insights and serve to move markets. With the major averages giving up every bit of their early gains yesterday and finishing at the lows of the day, markets are behaving unkindly to any signs of inflation in the economy. This even as earnings and net profit margins are surging. Fears of a trade war continue to weigh on investor sentiment even as a late evening headline broke, serving to extend tariff exemptions to the European Union. Nonetheless, the macro-factors continue to muddy the waters surrounding strong earnings. And all of the aforementioned come ahead of Friday’s Nonfarm payroll report, which will also lend itself to inflation fears on the wage front.
Their doesn’t seem to be much of an appetite for risk/equities since late January and as the “buy the dip” mentality of 2017 has given way to the “sell the rip” mentality of 2018. As far as investor sentiment is concerned, sentiment is at an 11-year low according to Morgan Stanley’s “market expectations model for equities”.
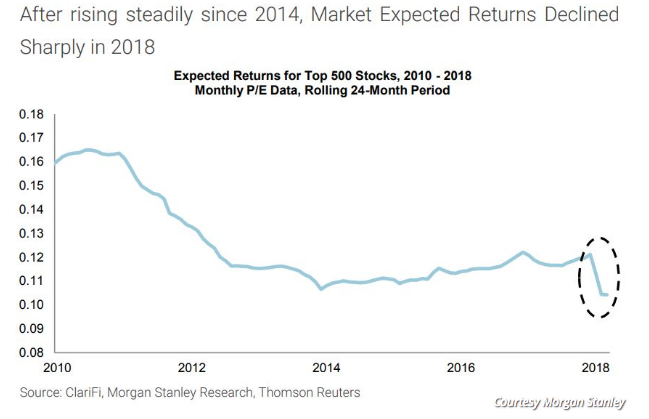
As of the end of March, the expected return for the S&P 500 is 10.4% over the coming 12 months. While such a gain would undoubtedly be welcomed by investors — such a rally would take the S&P 500 both out of correction territory and back to record levels — Morgan Stanley wrote that this rate of return was the lowest expected rate since January 2007, as well as “below the median since 1986.” (In 2007, stocks hit all-time highs in October before turning sharply lower as the financial crisis began to gain steam.) At the end of last year, a return of 12% was expected, compared with the current view of 10.4%.
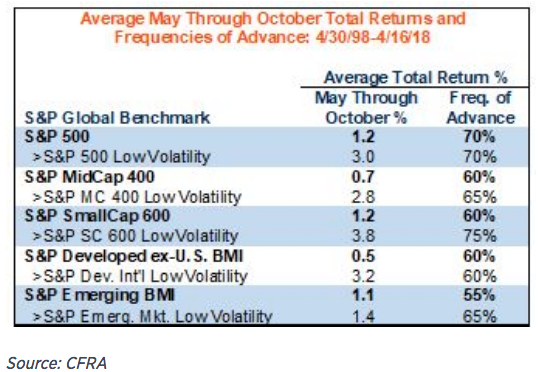
It’s May 1st and with that, of course, the “sell in May and go away” drumbeats sound. But the fact is that in the previous 5 years, the month of May has shown gains for equity markets. In fact, more often than not the May through October period has shown gains historically.
“While the S&P 500’s total return in the May-through-October period has averaged just 1.2 percent in the past 20 years, it was higher 70 percent of the time. During the November-to-April period, the S&P was up 85 percent of the time, averaging a 6.2 percent total return.
In looking at the monthly data and with respect to monthly market gains, May is typically of the lowest monthly gains for the year historically. It’s for this reason, and rhyming, that the colloquialism “sell in May and go away” has been popularized. Much can happen with respect to macro-factors this particular May, which serves as a prelude to the mid-term election cycle. Trade policies are on the list of macro-factors that could be finalized and alleviate some investor angst. Some sort of deal on NAFTA is expected this month and alongside headlines concerning the ongoing trade rhetoric between the U.S. and China. Removing the trade fears from the risk equation may prove to bolster investor sentiment and stabilize equity markets. A decision on Iran’s nuclear “deal” with the U.S. is also expected in May.
But as it is with each trading day and while we consider the factors affecting the markets, Finom Group continues to trade and invest with our focus on year-end results. Our trade of the day yesterday came from the volatility complex and iPath S&P 500 VIX Short-Term Futures ETN (VXX). The trade was delivered through Finom Group’s private twitter feed to subscribers.
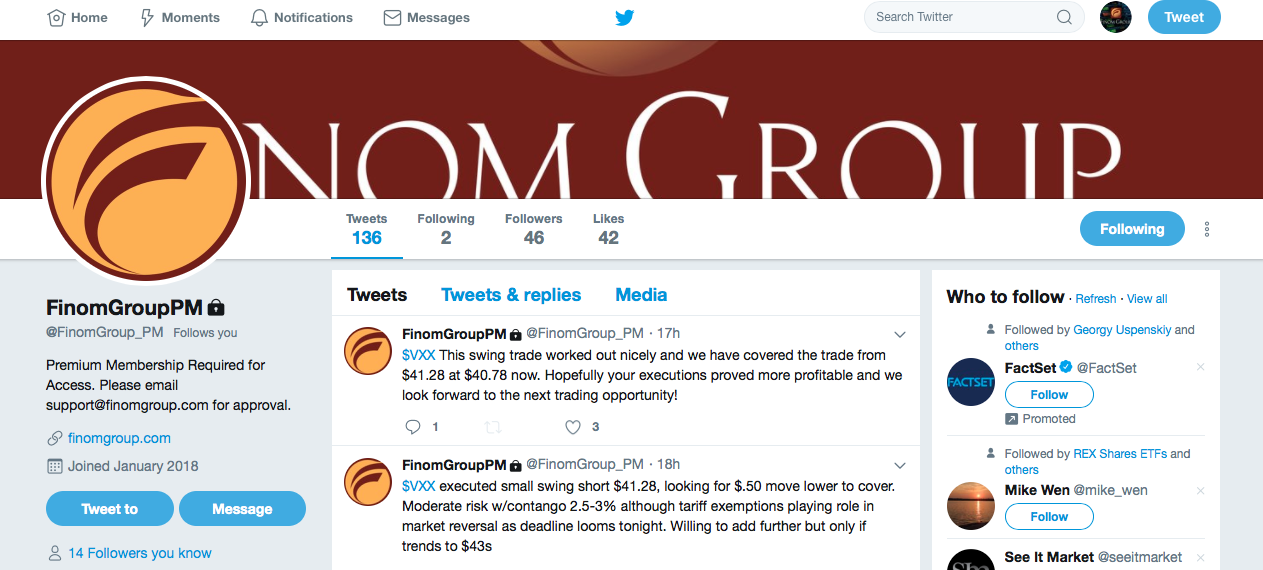
We weigh the risk and follow the VIX-ETP closely. The momentary spike in VXX’s share price gave way to a short entry. In quick fashion, the decay, intrinsic to the VIX-complex, set in rapidly and we covered this short, scalp position intraday for a profit. We look for these types of volatility plays intraday to pad our total returns on the year while maintaining core portfolio holdings in the VIX, retail and consumer goods sectors. There remains a trading opportunity most every day to be found and in most every market environment.


