-

Seth Golden posted an update 3 years ago
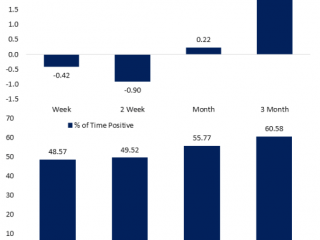
gain for the SOX adds to a 9.5% gain for the index last week. As shown in the chart below, that 9.5% rally is historically large, especially relative to the past several years. In fact, the five-day gain through Thursday’s close stands in the top 5% of all five-day runs for the index. While there was another occurrence as recently as the five days ending March 15th, moves of this size have been fairly uncommon in the past decade. Prior to the most recent and March occurrences, the only other recent instances were in November and the spring of last year. Prior to 2020, the past decade only saw a small handful of other instances of rallies in the 95th percentile or better. Conversely, the volatility of the Financial Crisis and the late 1990s and early 2000s led to more frequent clusters of top 5% moves. Here is what happened next
Online Members
Recently Active Members
Recent Topics
-
Allocation to Short Vol – What is Reasonable %?
by 3 years, 10 months ago
-
TVIX May 2020 Uptrend or Downtrend
by 3 years, 11 months ago
-
WhatsApp India Payments
by
 4 years, 2 months ago
 -
Latest from JPM
by
4 years, 2 months ago
-
UBS 2020 PT
by
4 years, 3 months ago
-
Aegis ups to Street High Price target
by
4 years, 3 months ago
-
Taxes
by 4 years, 4 months ago
-
Credit Suisse on Q4 shipments
by
4 years, 4 months ago
-
Michael Hartnett BofAML
by
4 years, 4 months ago
-
Goldman on growth Rebound
by
4 years, 5 months ago
 MarketWatch.com – Top Stories
- Here’s how much money the top 2024 NFL draft picks will earn on their rookie contracts April 26, 2024Dropping a few spots can cost players millions. In 2023, Kentucky quarterback prospect Will Levis was selected much later than expected, and lost out on tens of millions of dollars.
- Gilead’s quarterly loss is narrower than expected April 26, 2024Gilead Sciences Inc.’s stock dipped 0.2% in after-hours trading Thursday, after the drug company’s adjusted first-quarter profit was narrower than expected.
- Boston Beer reports a surprise profit as Twisted Tea shipments keep growing April 26, 2024Boston Beer’s stock surged in after-hours trading Thursday, after the beer brewer reported a surprise first-quarter profit and revenue that rose well above forecasts, fueled by volume increases, pricing and lower returns.