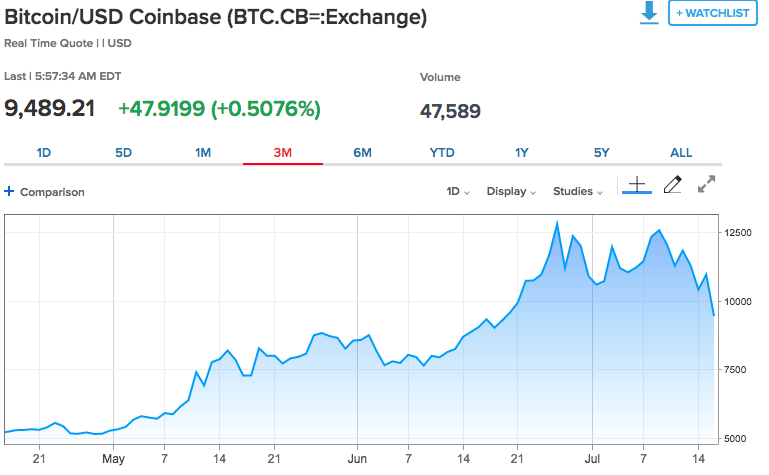
Equities finished lower on Tuesday with the Nasdaq (NDX) leading the way lower as Federal probes and Congressional hearings spur headlines surrounding Facebook’s latest product development in the crypto currency realm. Those hearings will continue to evolve on Wednesday and as Bitcoin has found itself trading below $10k once again. Did the highly speculative leading crypto currency just make a double-top that leads to more declines remains to be seen.
It’s clear that with Facebook’s Libra coming to the forefront the whole space is under even greater scrutiny.
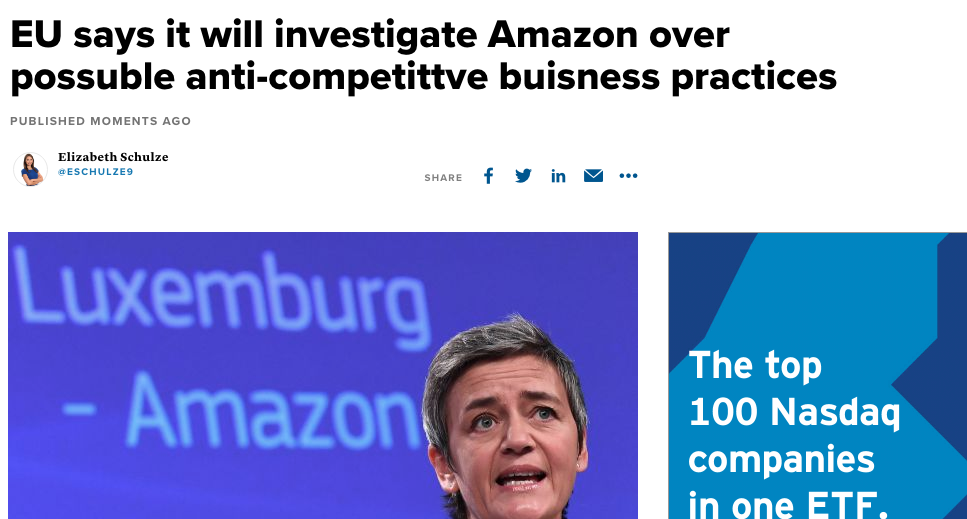
Facebook isn’t the only big tech company coming under fire recently. EU antitrust regulators will investigate Amazon, the world’s largest online retailer, to see if its use of other merchants’ data breaches EU antitrust rules, the European Commission said on Wednesday.
Big tech companies aren’t the only focus of the day as investors navigate an uncertain economic and market climate presently. Earnings season is in full swing this week as big money center banks continue to roll out Q2 2019 earnings reports. Most of the bank earnings, thus far, have been beaten analysts’ estimates, but have found commentary on the outlook of future earnings and/or revenues a bit murky as the Federal Reserve has signaled an easing cycle to commence near term. Lower rights generally find big money lending institutional profits come under pressure. Regional banks are also not immune to the headwinds of lower interest rates.
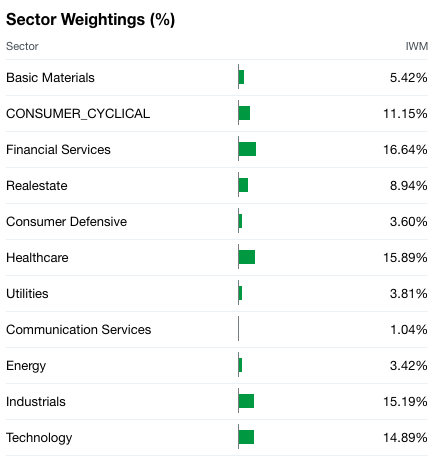
In speaking of lower rates and banking institutions, one of the reasons the Russell 2000 (RUT) has lagged its peer indices since June is largely do to the sector weighting of the small cap index.
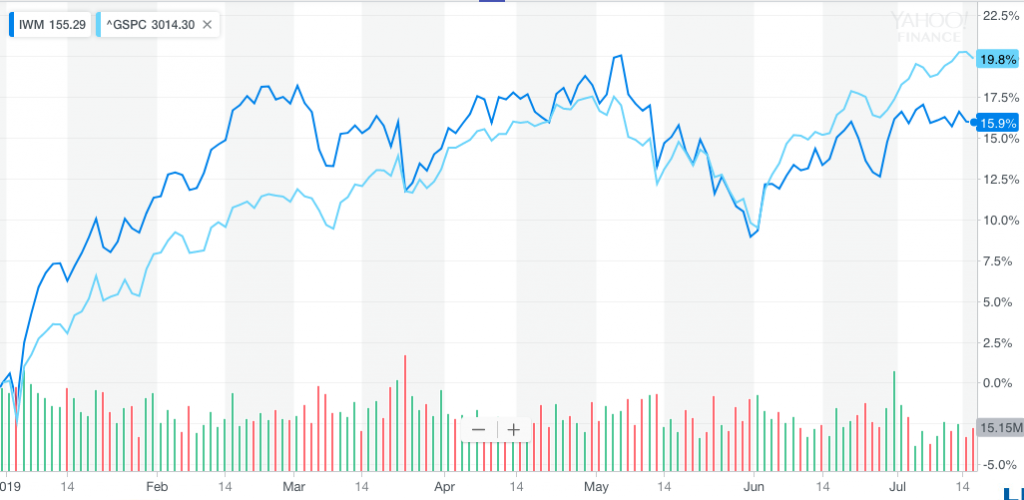
Regional banks or the Financial Services sector is still the heaviest weighted sector within the Russell 2000 index. With financial institutions profits in question due to the forecast for lower rates, it’s no wonder the Russell 2000 has diverged from the S&P 500 (SPX).
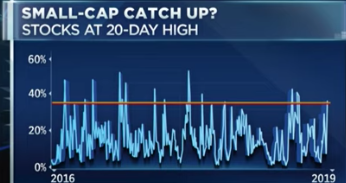
While the Russell 2000 has lagged its peers, some analysts and market strategists believe there is an opportunity in the rather anomalistic divergence between the small caps and large caps. In fact, this divergence has only occurred 3 times in the last 40 years. PNC’s Jeff Mills says something may be bubbling under the surface in favor of small caps performance going forward. New 1-month highs for the Russell have reached 35% recently, which could expand further in the coming months, bridging the gap between the small caps and large caps.
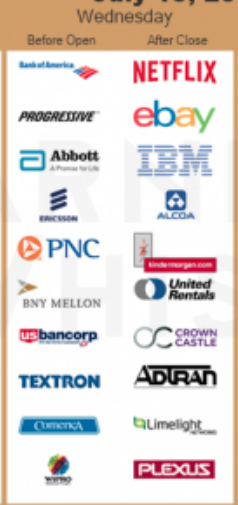
With a focus on earnings season, Finom Group anticipates more bank earnings on Wednesday with Bank of America (BAC), PNC Financial (PNC) and U.S. Bancorp set to report Q2 results. After the closing bell, investors will receive some big tech results from the likes of eBay (EBAY), IBM Corp. (IBM) and probably the most heavily anticipated results from Netflix (NFLX).
Regarding Netflix’s results, here is what analysts’ are expecting the streaming network to report:
Earnings: Of the 37 analysts surveyed by FactSet, Netflix on average is expected to post adjusted earnings of 56 cents a share, up from the 55 cents a share expected at the beginning of the quarter.
Revenue: Wall Street expects revenue of $4.9 billion from Netflix, according to 34 analysts polled by FactSet. Analysts are looking for global paid streaming subscriber additions of 5.1 million, according to FactSet, on domestic additions of 350,000 and international additions of 4.8 million. Netflix reported revenue of $3.9 billion during last year’s second quarter, leading to diluted earnings of 85 cents per share, and 5.45 million new paid streaming subscribers.
Of the 40 analysts who cover Netflix, 29 have buy or overweight ratings, 9 have hold ratings, and 2 have a sell rating, with an average price target of $412.42, according to FactSet data.
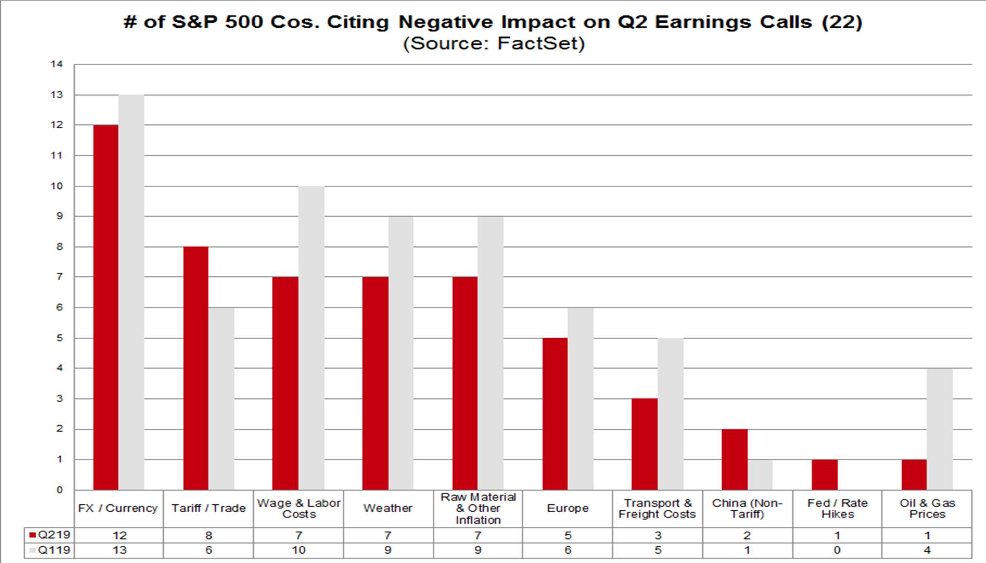
Finom Group anticipates negative earnings revisions by the major tracking firms to trough near-term and begin an upswing under the premise that earnings increasingly outperform analysts’ expectations. With the rate of change and stronger U.S. Dollar being the dominant drivers of earnings pressure from 2018 through 2019, investors have been looking beyond these headwinds. The strong U.S. Dollar seems to have peaked and will lap an even stronger comp in the Q3-Q4 period, especially with the Fed easing cycle commencing. This will likely create a tailwind for corporate earnings into 2020. At present, the U.S. Dollar strength is the #1 highlighted concern of corporations that have reported earnings this season, according to FactSet data.
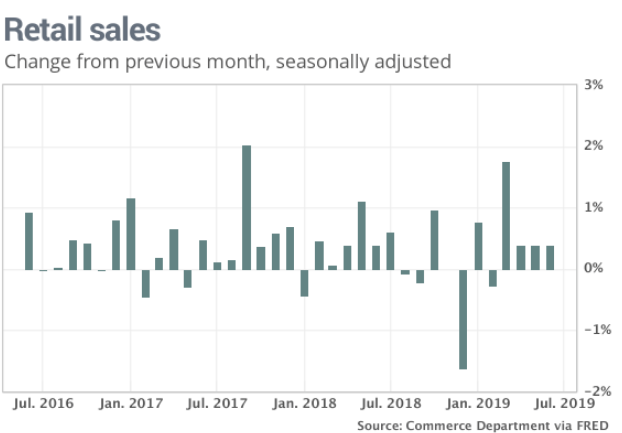
Tuesday’s better than expected retail sales data for June and Empire State Manufacturing index reading has given support to the sentiment that while business spending and productivity has recently rebounded, the consumer has continued to remain the driver of economic growth in 2019.
Retail sales increased 0.4% last month, the government said Tuesday. Economists polled by MarketWatch expected a 0.1% gain. On a 12-month basis, retail sales grew 3.4% through June, an acceleration from the May period of 3.2% year-over-year.
Wednesday’s economic calendar is light, but still found with important housing data set to be released. At 8:30 a.m. EST, Housing Starts and Building Permits data will come to the forefront while investors will comb through the Fed’s Beige Book later in the trading day.
With our daily market set-up complete, we now offer investors the latest notes from J.P. Morgan’s top quant analyst and the “man who moves markets”, Marko Kolanovic! Subscribe to Finom Group today to receive our highly touted weekly Research Report and trade alerts. Join us in our Live Trading Room Monday-Friday and trade/invest with us!
Market and Volatility Commentary:
Largest divergence ever presents opportunity for Value and High Volatility stocks.
Earlier this year we forecasted that the S&P 500 could reach 3,000 by late spring. Our forecast was based on record low positioning in equities and other risky assets (e.g. near-zero HF equity beta at the time). The market turmoil in May was a direct result of increasing trade tensions (see here) which halted the market rally. Many of our clients speculated that tensions were engineered to prompt Fed cuts and push out a strong market recovery closer to the elections. After the Fed indicated that it will cut rates and after the June G20 détente, the S&P 500 resumed its rise and reached our 3,000 target in early July. What do we expect next?
We first look at investor positioning and how may it evolve over the summer. Over the past month, equity exposure increased. In particular, the equity beta of all hedge funds increased to ~60th historical percentile. However, equity long-short investors still have relatively low exposure, in their ~30th percentile, despite running high gross exposure. Given the decline in volatility and positive momentum, systematic funds have above average exposure, with volatility targeting funds ~55th percentile, and trend followers (CTA) ~70th percentile.
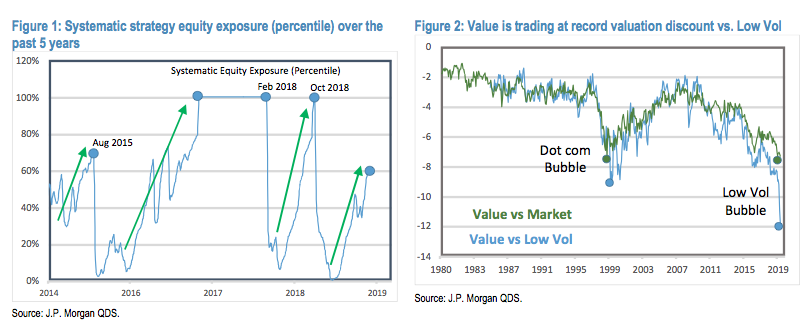
While positioning recovered meaningfully, this is not a negative for markets. Once exposure starts to increase, it tends to continue until there is an external volatility shock. In 2018, positioning increased from ~0 in April to ~100th percentile in September, and was only interrupted by the October selloff on the back of Powell’s rate hike comments. On the other hand, in 2016, positioning increased from ~0 in February to ~100th percentile at the end of the year, and stayed near max long for the next 14 months. Positioning was reset more than a year later by the February 2018 volatility shock (see Figure 1). So, unless there is an external volatility shock, equity positioning will likely continue to increase during summer months. How stable is the current low volatility regime? Current dealer positioning in option makes them heavily long gamma (e.g. call – put gamma exposure is over $40bn per 1%). Long gamma exposure keeps volatility suppressed and would only change below ~2940 in SPX. Summer also tends to have seasonally lower volatility. While the positioning argument is not as strong as it was earlier this spring, suppression of volatility during the summer is more likely to support equities moving higher.
Market and Volatility Commentary: Largest divergence ever presents opportunity for Value and High Volatility stocks. Tue Jul 16 2019
This week, we upgraded our 12 month price target to 3,200 (see here). The extended time horizon is expected to include further progress towards resolving the trade war and getting closer to US presidential elections. Given that the S&P 500 returned over 20% in 6 months, 3,200 in 12 months implies quite a bit lower rate of returns. However, we think that the unprecedented divergence between various market segments offers a once in a decade opportunity to position for convergence. Currently, there is a record divergence between value/cyclical stocks on one side, and low volatility/defensive stocks on the other side. The level of divergence is much more significant even when compared to the dot com bubble valuations of late ’90s. Figure 2 shows the valuation difference (in forward P/E turns) between value and the broad market, as well as between value stocks and low volatility stocks. While there is a secular trend of value becoming cheaper and low volatility stocks becoming more expensive due to secular decline in yields, the nearly vertical move the last few months is not sustainable. The bubble of low volatility stocks vs value stocks is now more significant than any relative valuation bubble the equity market experienced in modern history.
What could be the catalyst for a convergence of low volatility/defensives and value/cyclical stocks? Stabilization of economic numbers (e.g. recent US retail sales, China IP, etc.), progress in the trade war, and the Fed cutting short term rates and related yield curve steepening would help. However, given the extreme divergence, we think that as little as hedge funds increasing net and decreasing gross exposure during the summer rally could trigger this rotation. Hedge Funds’ net is low due to the high level of shorts, most of which come from cyclical and high volatility stocks. This could, in turn, trigger a chain reaction of short covering, fundamental flows, and equity long-short quant rebalances in a low liquidity environment. This rotation would push significantly higher all the laggards such as small caps, oil and gas, materials, and more broadly stocks with low P/E and P/B ratios.