
Until the market finally pulls back lower, the permabear camp will look for anything and everything to dupe investors into believing the end is near. Kevin Smith of Crescat Capital, an infamous short fund, tries anything and everything to sway investors’ confidence in the market. His efforts rely mainly on others’ inexperience and unwillingness to perform due diligence. Unfortunately that’s a good portion of the investor public.
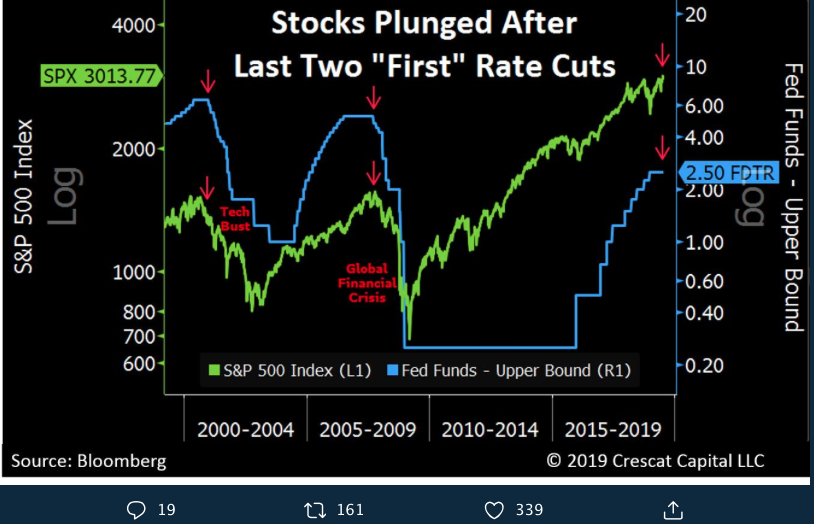
In Smith’s latest missive, he takes his narrative to the rate cut topic that is likely to occur with the FOMC July 31st rate announcement.
“Conventional wisdom is that the first rate cut is bullish. Not true with the last two first Fed cuts. Will likely not be true this time either because we are record late in the business cycle at historic high valuations.”
In the past, Finom Group has discussed that there are two different kinds of easing/rate cut cycles, insurance and recessionary. Most economists, strategists and investors are of the mindset that the contemplated and forecasted rate cut to come in July is an insurance rate cut. There are many reasons we can point toward to validate the notion for the coming rate cut cycle being an insurance cut cycle, but the main reason is likely due to a lack of inflation, which is one of the Fed’s mandates (price stability). Other reasons for a rate cut that are widely contemplated and discussed relate to global economic slowing due partly to the ongoing trade feuds.
Some investors are of the opinion that if the Fed is cutting rates, this means the economy is going into a recession and the Fed must know of this circumstance. The reality is quite the opposite. In 1995 when the Fed cut rates, the economy did not go into a recession and in 1998 when the Fed cut rates it wasn’t until 2001 until the economy went into a recession. What also confuses investors is that the market is at all time highs. They don’t believe the Fed is likely to cut rates because if the market is at record level highs, then the economy must be strong. The problem with that notion is that the economy is not always the market and the market is not always representative of the economy in the near-term. Over time the two tend to express the same strength or weakness through corporate earnings, but the corporate earnings puzzle can take a longer to mirror economic output, for various reasons and especially forward looking earnings that can be impacted by corporate share repurchase programs.
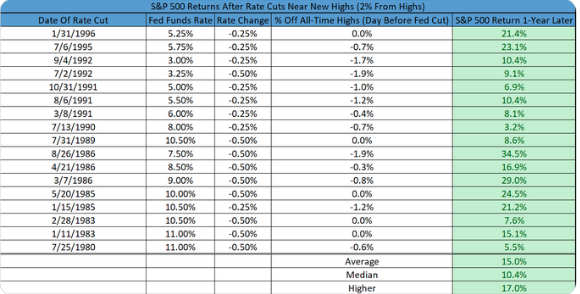
Since the Fed started targeting the fed-funds rate in 1982, it has delivered rate cuts with the S&P 500 (SPX) at an all-time high seven times, the last such cut occurring in January 1996. The table below, from Charlie Biello of Pension Partners, identifies the last time that rate cuts took place when the market was at all-time highs.
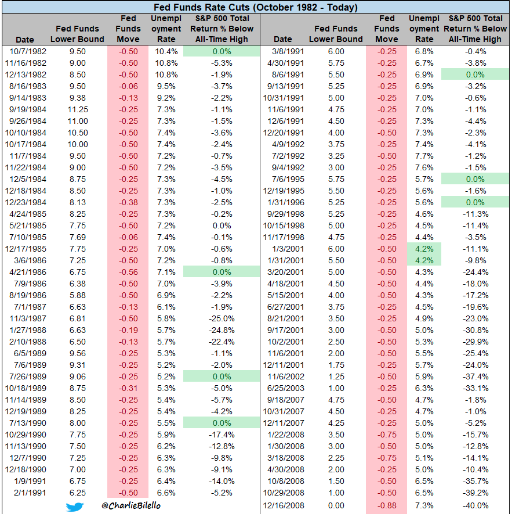
The market isn’t THE factor in why the Fed does or doesn’t cut rates, but it can play a role. What’s most important to the Fed is it’s dual mandate and economic outlook. Nonetheless, what we can also identify in the table above is that it doesn’t identify the rate cuts that took place in 2001 or 2007. The table below identifies the first rate cut of the easing cycle in 2001 and 2007.
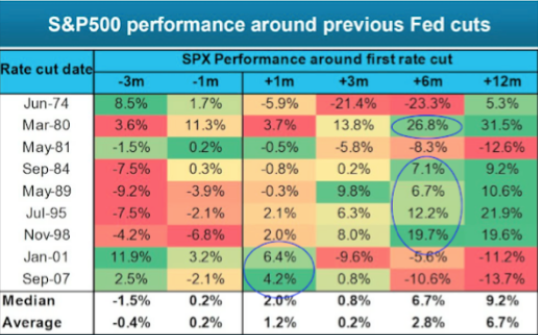
Unfortunately, these are the 2 most recent easing cycles/rate cuts, but the Fed cut rates too late; the economy was already heading into or already in a recession. These were recession cuts whereby the Fed was trying to play “catch up” to what the economy was expressing. As such, we can see from the table that the Fed did too little and too late and that is why it’s actions weren’t enough to stem further economic and market declines. So how do we know that this time, as the Fed embarks on a rate cut, is different?
You never know for sure whether or not the economy and equity market will perform in kind with like historic characteristics. What we do know is that recency bias can cause a good deal of fear and panic amongst investors if they do review history. That’s what Kevin Smith is counting on with his latest tweets that aim at driving fear of what may come from rate cuts and based on the most recent easing cycles.
Smith purposefully focuses on the last two recession rate cut cycles and avoids the former rate cut cycles because the former actually produced strong market returns 3,6,9 and 12 months later. This is the key differentiator between insurance cuts like 1995 or 1998 and recessionary cuts like 2001 and 2007. Nonetheless, the circumstances today are such that the market is at all time highs with a potential earnings recession forecast. Ryan Detrick, senior market strategist at LPL Financial, which has around $684 billion in advisory and brokerage assets, found that the Fed cut rates 17 times since 1980 when the S&P 500 was within 2% of its all-time high. He also observed that the Fed was higher a year later all 17 times, with a median gain of 10.4 percent.
The 2001 and 2007 recession cuts, obviously the Fed was responding to the economic and market downturn. That is not the case today. The Fed is attempting to forestall further economic weakening and support the economic expansion that is the longest in history. Another way for which we can separate or distinguish the difference between today and the 2001/2007 rate cutting cycle is through the unemployment rate.
The unemployment rate can lend itself as a gauge of longevity in any economic cycle. With the unemployment rate below 4% presently, we understand it is at 50-year lows and otherwise recognized to be in the latter innings of the economic cycle. Since 1973, when the Fed has cut rates with the unemployment level below 5%, market returns have not been strong, in fact, they’ve been down right crummy on average.
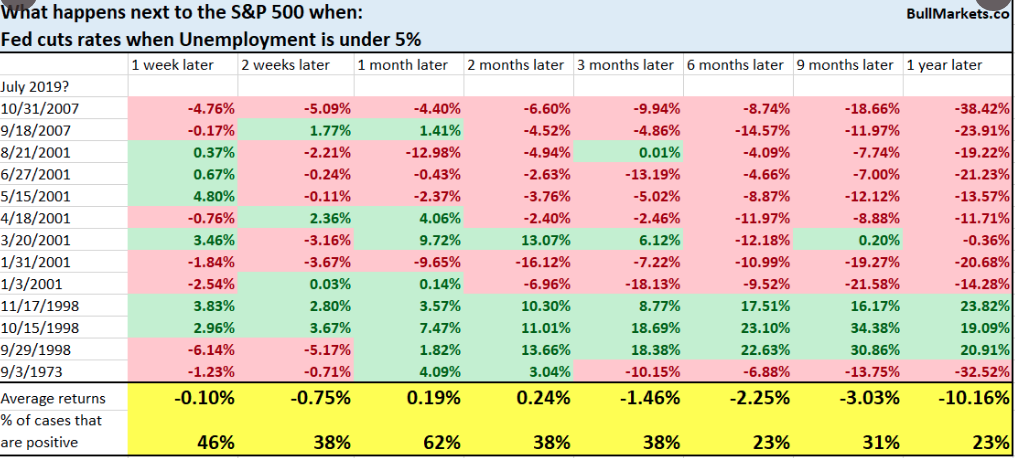
As shown in the table above, from Bullmarkets.co, when the Fed cuts rates and the unemployment rate is under 5%, market returns are negative across most time frames. Now of course, the sample size is quite small given the majority of these conditions were only present in 4 different years, 1973, 1998, 2001 and 2007. Stripping out the anomalies of 2001 (terrorist attack of 9-11) and the excessive leverage and unregulated mortgage markets of 2007, the returns would be quite positive. It’s important that investors look more deeply at such tables, charts and studies in order to more accurately forecast the probabilities for the market over the next 12-months. If we just look at the bottom-line averages and/or median returns, we can miss a lot of contextual inputs. Can another 9-11 attack occur? It’s possible, but the probability is quite low. Is there excess build up of leverage or deregulation in the economy; not really!
With inflation running below the Fed’s target rate for nearly a year now and the unemployment rate under 4%, these issues alone can define the Fed’s upcoming rate cut as insurance cuts that did not exist in 2001 or 2007. But we can look at both 1995 and 1998’s ISM manufacturing data and suggest the Fed’s next cut is an insurance cut too. In those cases, the Fed moved AFTER a drop in the Institute for Supply Management’s manufacturing gauge to a reading of less than 50, which signals a contraction in economic activity.
“If the Fed actually does the cut in July this year, I think this will be the first insurance cut, if you will,” Jeffrey Schulze investment strategist at ClearBridge Investments said, in an interview.
The ISM manufacturing index has been under pressure, falling to 51.7% in Juneand signaling the slowest pace of expansion for the sector in more than two years. Powell cited the fall in the indicator as he highlighted worries about the economic outlook in his congressional testimony last week.
Moreover, the S&P 500 is already up more than 20% in 2019, at record level highs with the U.S. economy likely to grow around 2% in 2019. Least we not forget the so-called 2001 recession actually produced GDP of 1% in the calendar year. But we digress…as market concerns were very negative and as investors that’s what we concern ourselves with.
With the S&P 500 up 20% through the first 6+ months of the year, the market’s performance ahead of a rate cut looks an awful lot like 1998, the last time insurance rate cuts occurred. Take a look at the following analogue chart from Bespoke Investment Group below:
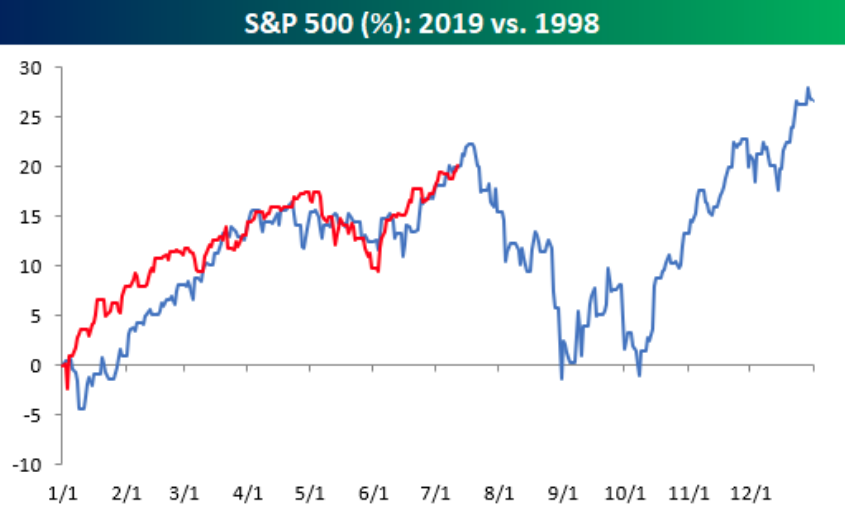
WOW! That chart doesn’t leave much hope for investors in the coming months. Keep in mind that the Fed didn’t cut rates until November of 1998, not the projected rate cut month for this time around. The market was double-dipping in October of 1998 and before the Fed rate cut in November of 1998. What investors should rather consider is the longer-term outlook and regardless of what the analogue suggests, no, the markets don’t generally go higher and in a straight line. Expect turbulence in the market for one reason or another and you’ll likely be able to stomach such market turbulence that much better when it does eventually arrive.
In 1998, we can also see that there was a significant contraction in financial conditions during the month of October that forced the Fed to cut rates and with the market declines.
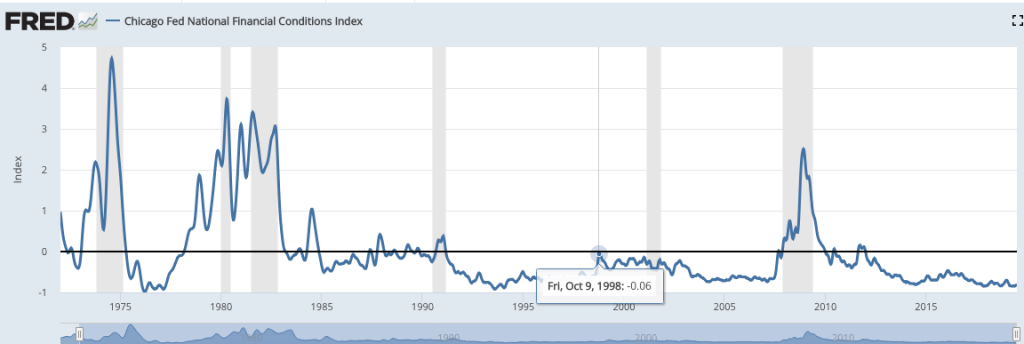
Financial conditions tightened enough, as indicated in the Chicago Fed National Conditions Index. At present, financial conditions remain loose, akin to the 1995 rate cut period.
While we can talk about the market all day, what we really aim to understand and validate is why the Fed does what it does at all. We know the inflation mandate has been found wanting for many, many years. But when it coincides with market highs and a President undermining the Fed’s efficacy for monetary policy, it can be portrayed as the Fed cutting for the sake of appeasing the President, who desires lower rates.
So is the Fed easing for the sake of appeasing the President? The answer is no, in the opinion of Finom Group. In fact, the Fed is being prudent in its measured objective and looking forward with regards to its inflation mandate. Looking ahead? While most market participants focus on the hear and now, maybe 3 months out, the Fed is thinking further out and with regards to its inflation mandate. If you think inflation is too low now, well…
Nancy Lazar of Conerstone Macro says that the Fed is very much concerned about future pressures on inflation. She notes that core inflation will likely slow starting in 4Q19, for 4 main reasons: 1) declining ULCs, 2) the tariff hike effect dissipating, 3) the lagged impact of 2018’s dollar strength, and 4) downward pressure on health care prices.
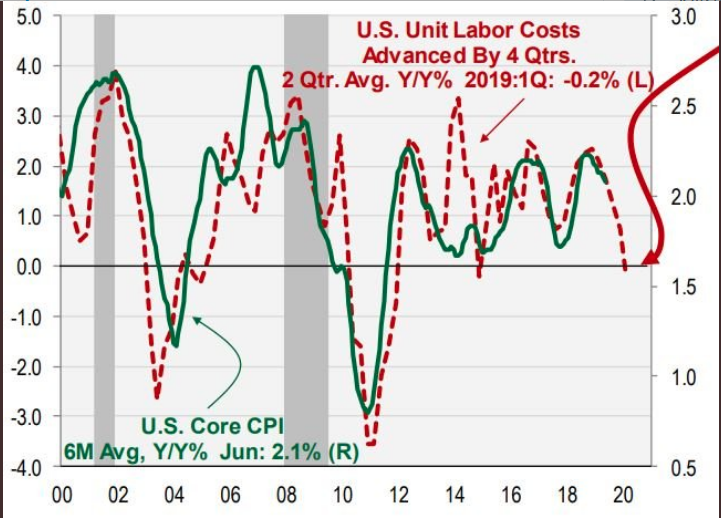
Have you seen the media focus or even mention inflation pressures for the latter part of the year? Remember, the tariffs implemented in Q3 of last year, were inflationary, but other parts of the economy proved disinflationary enough to still find CPI, PPI and PCE data falling since. If no additional tariffs are placed on China’s exports to the United States, we have an automatic headwind for future inflation. Unit labor costs are also going up against a tough comparison last year and for which the data point has already been rolling lower in 2019. The Fed is astutely and appropriately cutting rates in an effort to, at least, solidify its price stability mandate.
While there are threats to the economic outlook from all rounded corners of the globe, none are appear more threatening for the Federal Reserve than the ongoing trade feud and implementation of tariffs. A recent BofAML survey suggests that same sentiment is shared amongst fund managers.
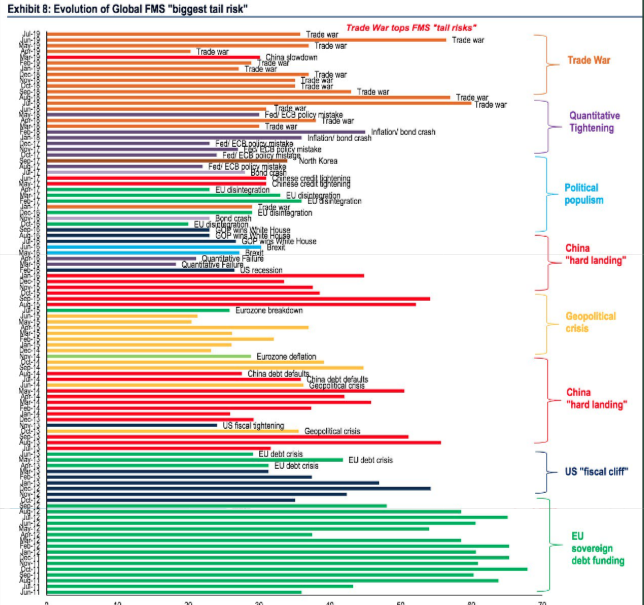
Trade war concerns fell 20 points to 36% of FMS investors in latest BofAML survey, but remain the No #1 tail risk. This issue has topped the charts for 15 of the past 17 surveys; note concerns about #2 tail risk “monetary policy impotence” jumped 11 points this month.
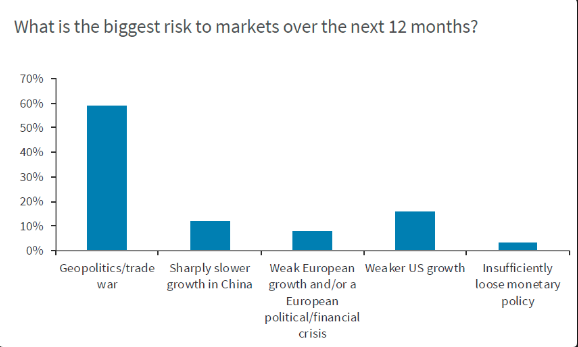
Will the ongoing trade feuds result in a recession and when do investors believe a recession will present itself? That question was asked by Barclays in a recent survey.
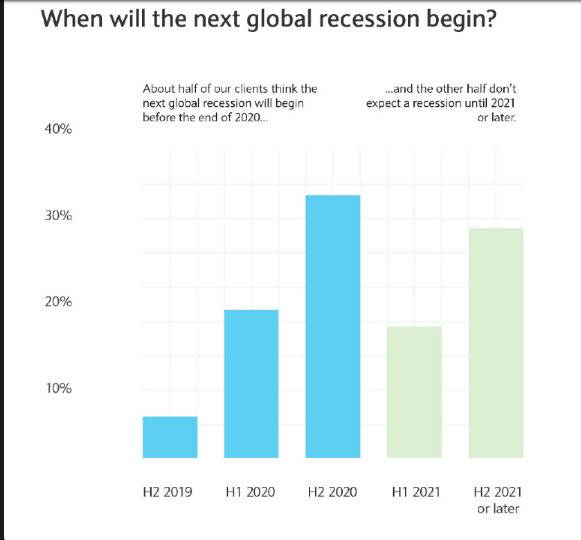
50% of investors in Barclay’s survey believe we will be in a recession before the end 2020. And what might cause that recession? Trade was still the key perceived risk, according to the survey of 400 institutional investors.
For Tuesday, reverting back to the here and now, investors are focused on earnings reports and economic data. The New York Fed’s Empire State manufacturing survey’s main index rebounded 12.9 points to 4.3 in July, the New York Fed said Monday. Economists had expected a reading of 0.5, according to Econoday. The gain partially reverses a steep fall in June, when the index plunged by a record 26.4 points to minus 8.6, the lowest level of the index since October 2016.
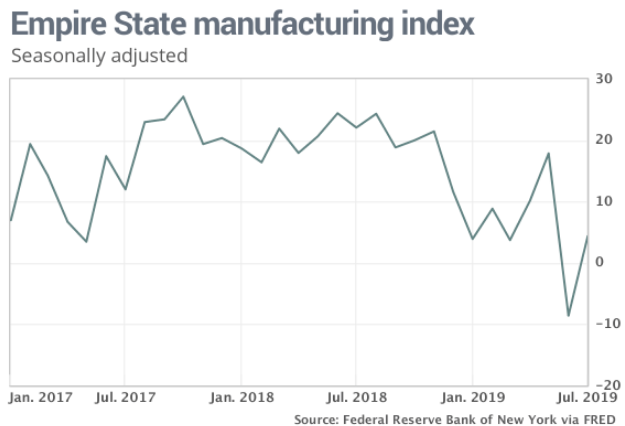
The rebound in the manufacturing index was of little surprise to Finom Group and we expect a similar rebound in the Philly Fed manufacturing index when it is reported later this week. Simply put, what pressured manufacturing activity in May and June was the increased tariffs on China and threatened tariffs on Mexico. With the Mexico tariff threat removed and a trade truce implemented between the U.S. and China, these issues are now less uncertain amongst the business community and activity should return.
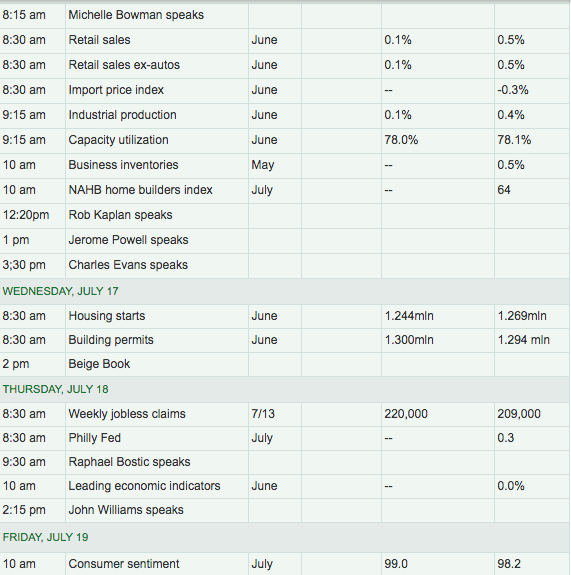
As noted in the economic calendar table above, investors will be focused on monthly retail sales data. The latest reading on monthly retail sales is only expected to tick modestly higher on a MoM basis. Shortly after the data is released, we’ll likely get some revisions to the Q2 2019 GDP forecasts from many firms and regional Fed GDP forecasts.
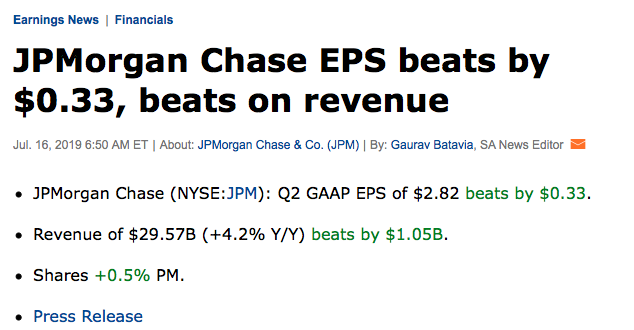
With big money center bank earnings rolling out this week, the focus will also find itself bifurcated between economic data and earnings. Citigroup (C) beat on both top and bottom line Monday. On Tuesday morning already, J.P. Morgan Chase (JPM) has already released results that were in kind with Citigroup’s.
With that being reported, some analysts remain with concerns over future earnings.
“U.S. stock-market investors should prepare themselves for a more than 5% pullback between now and the rest of the year, as company management will begin to reduce expectations for second-half performance, said Tobias Levkovich, chief U.S. equity strategist at Citigroup.”
Levkovich argued that stocks will stage a “tactical retreat” during the final months of 2019.
“We may see stocks trade a little bit higher this earnings season, because expectations have come down meaningfully.”
Levkovich’s main concern centers on earnings and the lack of clarity for future earnings which may find the market under pressure in the latter months of the year.
“The third quarter is a weird quarter,” he said, because many key personnel take vacation in the U.S. and especially Europe, making it more difficult for management to have a complete understanding company performance.
“There’s no desire to raise expectations because then you put in the possibility of disappointment down the road, but there’s no reason to cut them because management doesn’t have a great feel” for future results. We’re going to get a lot cringeworthy, cautiously optimistic commentary.”
“We’re going to see weaker guidance come September,” he predicted, a “soft patch” which could be the catalyst for a sustained downturn in stocks that leaves the S&P 500 closer to his year-end target of 2,850, or 5.4% below Friday’s record close.
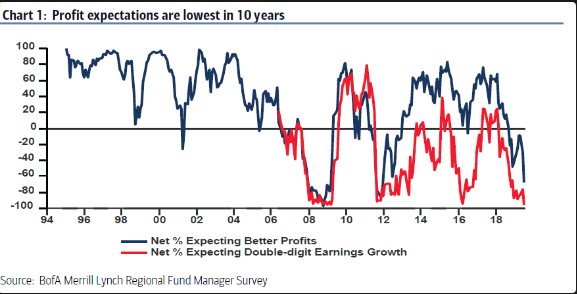
When reviewing the outlook for earnings, the reality is that at this stage of the year, most fund managers have low expectations for earnings. They are more relying on the forward 12-month outlook of earnings and investing capital according to such expectations. This is also offered in the latest BofAML survey. Profit expectations are the lowest they have been in 10 years.
Taken everything mentioned within our Daily Market Dispatch, and with markets at all-time highs, it’s likely the market will undergo some turbulence near-term and prudent to anticipate.


