
Equity markets took a deeper dive on Wednesday as earnings season rolled forward. Bank of America Merrill Lynch (BAC) shares finished with a gain Wednesday, as the bank lowered its full-year outlook for net interest income, but still expected growth in the face of anticipated interest rate cuts and slowing economic growth.
The consumer and investment bank also reported before the open a second-quarter profit that beat expectations, but net interest income that came up a bit shy. Meanwhile, sales and trading revenue fell 10%, as fixed income, currencies and commodities revenue declined 8%, a fourth straight quarterly decline, and equities revenue tumbled 13% after plunging 22% in the first quarter.
“On the surface, B. of A.’s results look a bit boring and in line with expectations,” said Octavio Marenzi, chief executive officer of capital markets management consultancy Opimas. “However, digging deeper, a few things stand out. The consumer banking group did far better than expected, with net income up 13%.”
What the bank did say about the next 12 months, however, is its intention to return $37 billion worth of capital to its shareholders. That will come in the form of a 20% increase in the quarterly dividend and more than $30 billion in gross share repurchases.
Although BAC shares fared better than many within the financial sector on Wednesday, the financial sector ETF (XLF) fell nearly 1% on the day to finish below $28 a share. Before the opening bell on Thursday and with equity futures under moderate selling pressure, more big money center banks will be reporting Q2 2019 results, including Morgan Stanley (MS)
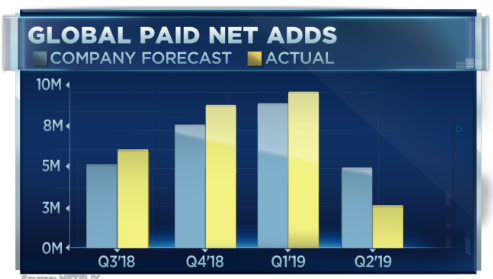
The company specific results that will capture the most attention on Wall Street Thursday will be Netflix (NFLX), which beat bottom line estimates when it reported Q2 2019 results after the closing bell Wednesday. Shares of NFLX tumbled more than 11% on the headline that subscriber growth materially missed the firms guidance and subscriber growth declined in North America. Here are the key metrics reported by Netflix:

- Earnings per share: 60 cents, vs. 56 cents expected, per Refinitiv consensus estimate
- Revenue: $4.92 billion vs.$4.93 billion expected, per Refinitiv (Up 26% year over year.)
- Domestic paid subscriber additions: A loss of 126,000 vs. a gain of 352,000, forecast by FactSet
- International paid subscriber additions: 2.83 million vs. 4.81 million, forecast by FactSet
- Global streaming paid memberships: 151.56 million, up 21.9% year over year.
Netflix is projecting a stronger 3rd quarter on the heels of heavy viewership of the third season of “Stranger Things.” Netflix forecast 7 million global paid net adds for the next quarter and provided revenue guidance of $5.25 billion. The company expects subscriber numbers will be boosted by its strong content slate in the third quarter, including the final season of “Orange is the New Black” and a new season of “The Crown.”
Netflix acknowledged it will soon lose two of its most-watched shows, “The Office” and “Friends.” NBCUniversal announced in June that it plans to remove “The Office” from Netflix in 2021 and move it to its own streaming service. Earlier this month, AT&T’s WarnerMedia announced its new streaming service, HBO Max, will include exclusive rights to stream “Friends” when it launches publicly in the spring of 2020. Netflix previously spent $80 million to keep “Friends” just through the end of this year, according to Vulture. Netflix said the loss of these shows is “freeing up budget for more original content.”
While shares of NFLX remain under heavy pressure in premarket trading Thursday, Morgan Stanley issued notes defending the company’s performance and go-forward strategy.
“Did the world change in the last three months? We do not believe it did. Moreover, layering in the 2H19 guide leaves our full year estimates largely unchanged. If it delivers, ’19 will be another year of record net adds and nearly double digit ARPU growth.
“We are not making material changes to our operating forecast . We do not believe that this customer miss should lead us to assume Netflix’s historical forecasting track record is now in question. So we layer in the 3Q net additions guidance of +7mm, which was above our prior estimate and we bump up 4Q modestly from 9mm to 9.5mm. Ultimately, we think it is more likely than not that this year proves to be another year of record net additions AND nearly double digit ARPU growth. In terms of risk/reward, in the last two years shares have traded between 6-11x EV/sales. At hypothetical trough revenue multiples, this would imply downside to roughly $300/share on our base case 2020E revenues, with significant upside to our $450 price target.“
SunTrust also came out defending Netflix with the following: “We are maintaining our Buy rating, with the stock likely to be under significant pressure today, believing:
- the 3Q content slate is easily the mostrobust to date
- the pricing headwind abates sequentially in 3Q and with anew lower price point in India (rolling out in-step with key Indian content) alsolikely to be at least a modest incremental tailwind
- prior precedent (2H16,2H18) has shown that subs adds and the stock can bounce back in 2H after a ugly 2Q.
Goldman Sachs, did not come to the aid of Netflix after its disappointing subscriber growth numbers.
- As Netflix’s content investments, distribution partnerships and marketing spend drive subscriber growth significantly above consensus expectations and the company approaches an inflection point in cash profitability, we continue to believe shares of NFLX will significantly outperform. We remain Buy rated (on CL), though we lower our 12-month price target to $420 from $460 to reflect our revised estimates.
- We lower our 2019-2021 revenue / adj. EBITDA estimates by -2.2% / -1.7%, on average, largely to reflect lower subscriber growth estimates and visibility into the timing of marketing investments.
- NFLX trades at roughly 29x 2020E EV/EBITDA (after-hours) on a 57% 3-year (2018-2021E) adj. EBITDA CAGR compared to the sector average at 18x on 20% growth.
As investors look forward to another trading day, concerns over a market correction will likely rise to the surface should selling pressure persist through the week-end. The weekly expected move for the S&P 500 coming into the trade week was roughly $32/points. Through Wednesday’s trading and combined with the E-mini futures, it looks very much like that weekly expected move will be achieved at the lower bound on Thursday.
While the market may resume further selling pressure near-term, investors might find the following chart providing solace over the long-term.
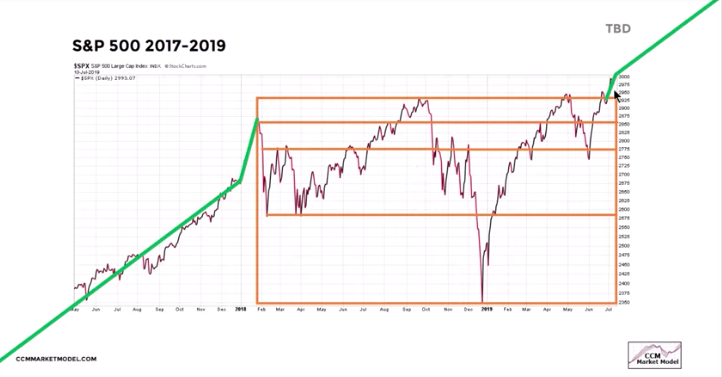
Finom Group highlighted the S&P 500 chart above, identifying the last 18-month consolidation period that produced a recent breakout on strong breadth support. Here is what we offered to subscribers in our most recent weekly Research Report:
“While earnings season may not prove to show YoY earnings growth, modest earnings declines will likely produce modest pullbacks in the market. Ultimately, the market setup over the last 18 months suggests the recent breakout of the consolidation channel should produce gains over the next 12 months.
For the market to produce a more substantial and elongated pullback, earnings & earnings forecast are likely necessary to deteriorate further and central bank accommodations will need to prove impotent. Of course, even with these considerations, we can’t discount the possibility of an exogenous shock to the economy from both external and internal forces.”
While we denoted the breakout pattern in the chart above this past weekend, it was only yesterday that CNBC broad it to the limelight yesterday and through Matt Maley, Miller Tabak’s chief market strategist.
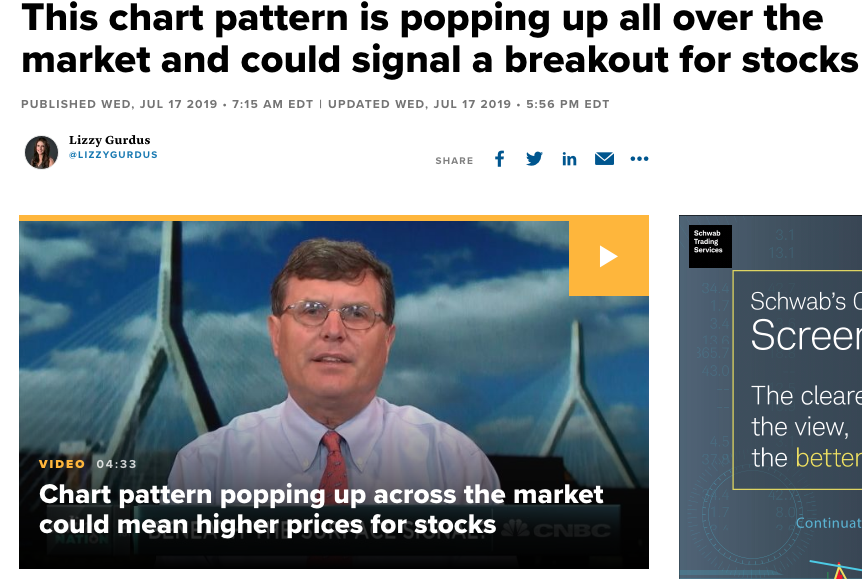
“This is something you frequently see either in a stock or in an index or both that shows that investors are cautiously optimistic. In other words, they’re willing to buy on any kind of weakness, but they’re not really willing to chase a stock when it moves higher.
When that stock or index finally breaks above that key level in any kind of meaningful fashion, it shows that the sellers have basically sold what they’re going to sell and it gives you kind of a little bit of an air pocket, and the stock or index can take off.
That’s the case with the S&P. We would like to see the index run to the 3,030 level for confirmation of the rally’s staying power. That would let “investors to go from cautiously optimistic to confidently bullish.“
It may take some time and hindsight for investors to appreciate the S&P 500 chart pattern breakout, especially given the near 1% pullback week-to-date. Moreover, if the pullback turns into a more protracted downturn, what investors do with that downturn will prove critical to their portfolio performance. Finom Group’s chief market strategist appeared on David Moadel’s “Looking At The Markets” Wednesday to discuss his outlook for the markets near-term.

In the half hour interview, Golden discusses the probability of a near-term market pullback being elevated, given the looming business sentiment agains the backdrop of an already 20% S&P 500 rally year-to-date. He goes on to say that at such levels and with geopolitical concerns weighing heavily on business sentiment and manufacturing output globally, a pullback from record highs shouldn’t be feared, but expected or anticipated. He also characterizes such a pullback as likely being “garden variety” in nature.
Regarding the geopolitical climate, the recent trade truce between the U.S./China has found some level of resurgence in regional manufacturing, but from recent lows. It remains to be seen if the Empire State manufacturing snapback will be mirrored in the Philly Fed manufacturing index, when it is released on Thursday morning.
Recent headlines regarding restarting trade talks between the U.S. and China are none too positive and seem to have stalled, according to the Wall Street Journal. Progress on resolving the trade war is stuck in limbo until the White House determines how to address China’s demand to back off restrictions on Huawei.

Earlier this week, the Journal reported that Huawei plans to lay off hundreds of employees as it remains on the blacklist. The layoffs are expected to hit Huawei’s U.S. development subsidiary Futurewei, according to the Journal.
The trade battle also appears to be a drag on the Chinese economy. Data on Monday showed the country’s economic growth slowed to 6.2% in the second quarter, the weakest rate in at least 27 years.
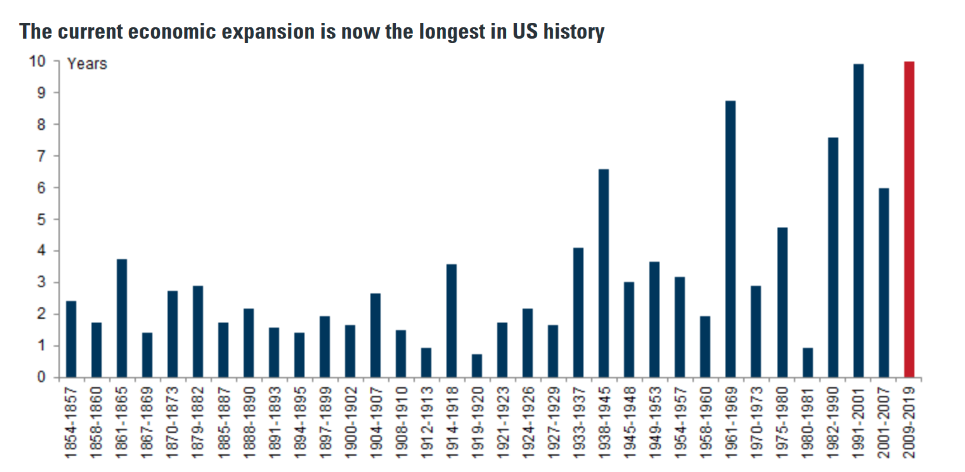
You didn’t think the trade truce was going to go any more smoothly than the trade escalation did you? Heading into an election year (2020) and with the global economy weakening, some sort of resolution is more likely than no trade resolution in our opinion. While this may not be any sort of grand deal/bargain, at this point, getting back to square one with curtailment of tariffs and some protections on intellectual property rights is likely enough to stimulate business sentiment once again. That may be all that is needed to give the global economy a shot in the arm and maintain what is now the longest U.S. expansion cycle in history.
What is also popping up on our market-watch radar, as we prefer to discuss the markets more so than the geopolitical skirmishes, is the divergence in the S&P 500 and the Dow Jones Transports (DJT). These two usually move together and the recent divergence, not unlike the small caps (IWM, RUT) vs. the large caps (SPX, NDX, SPY), adds to some near-term market risks to be aware of… even if it proves meaningless.
The latest reports from companies that reside within the DJT have shown weakness and resulted in the sector downturn, after what had been several weeks of trending higher. Another way to view the DJT is against the recent divergence against the Dow Jones Industrials (DJI).
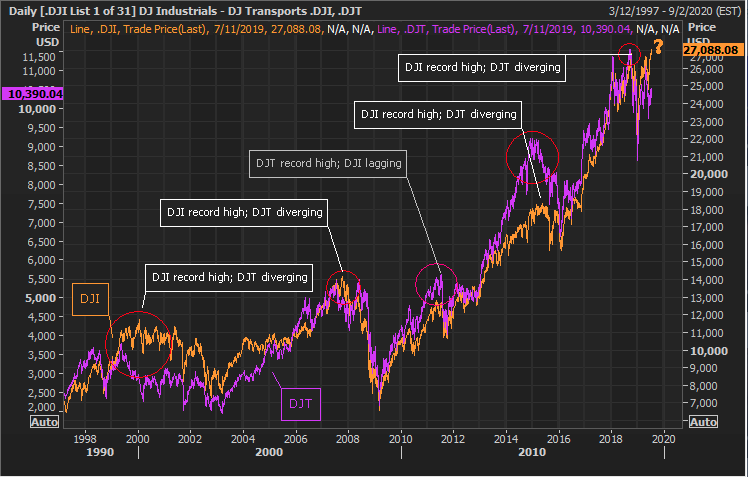
Up until recently, the last time we saw this divergence was in 2015 and when economic uncertainty was also elevated. The reason to pay attention to the Dow Jones Transports is mainly because many believe in the market signal known as the Dow Theory. Dow Theorists focus on the behavior of both the Dow Transports and its better-known sister average, the Dow Jones Industrial Average. Bull markets are considered alive and well when both of these averages are jointly hitting new highs.
When we look at the DJIA vs. DJT over the last year, the widening divergence becomes more concerning.
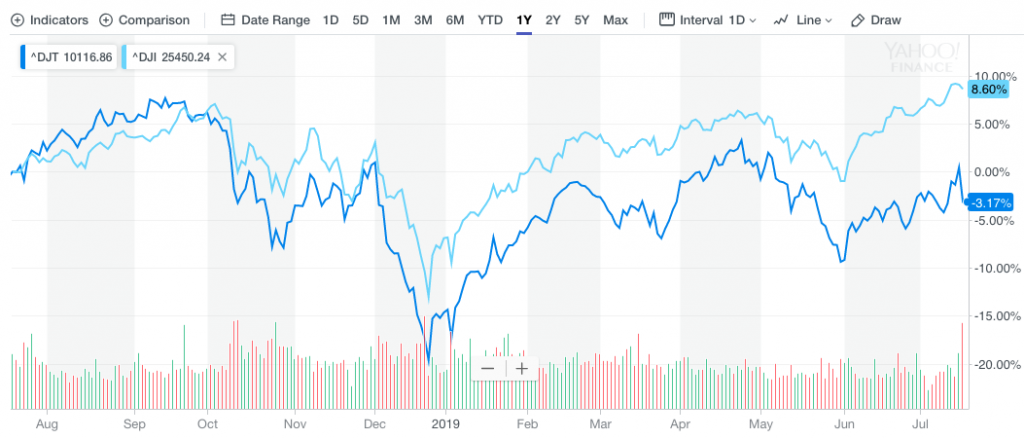
Not all divergences between the Industrials and the Transports over the past century led to bear markets. But, according to statistics, the greater the magnitude by which the Dow Transports lagged the Dow Industrials, the worse the market’s subsequent performance, on average. What the charts suggest is caution for investors, despite the S&P 500 breakout chart noted earlier. What the charts don’t tell investors is the whys. The whys for the transports to be lagging is likely known to be the protracted trade feuds that are affecting global trade, which directly hits the transportation sector. To our earlier point, remove or resolve this issue going into an election year and that artificial stimulus for a second leg higher in economic output and markets can be rationalized.
Another way we can review the Dow Jones Industrial Average is through the Dow McClellan Summation Index, which is a long term breadth indicator. Breadth has been positive (above zero) for 123 consecutive days.
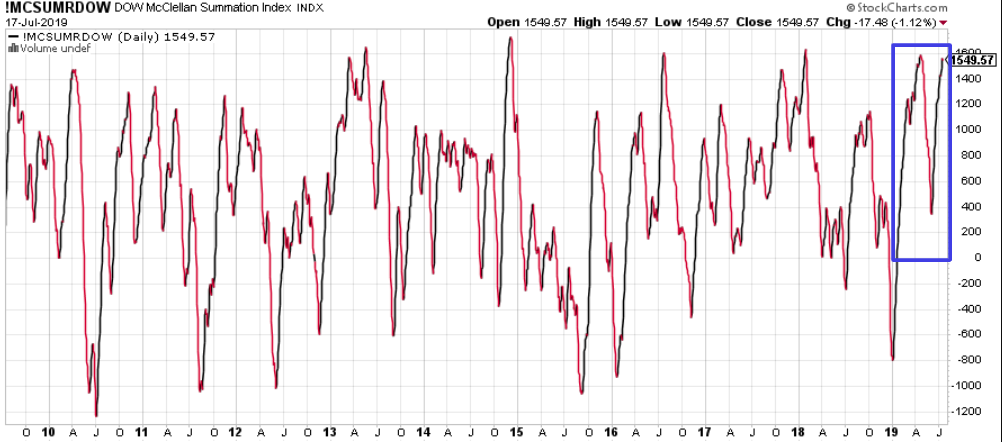
Given this statistic, we’d like to see what history may point to for forward returns from the blue chip index. (Table from Troy Bombardia)
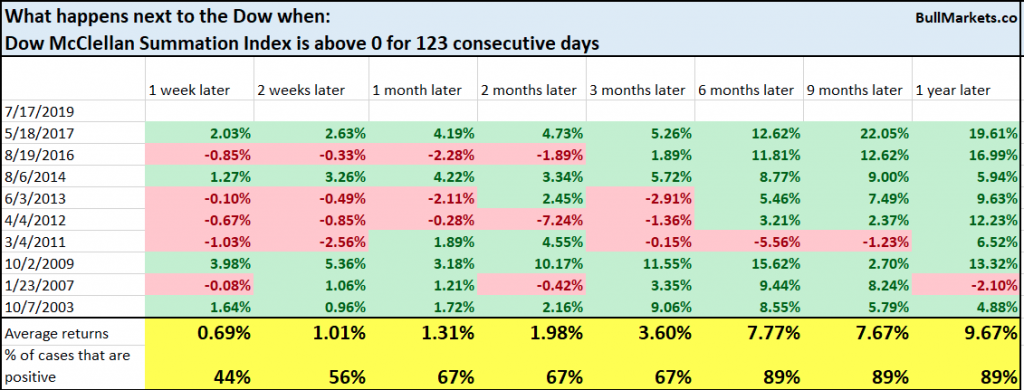
In comparing the table above with recent Dow Transports divergence notes above from 2012 and 2015-2016, we see that in these particular years, market returns were indeed negative over the next 3 months on average. But 6, 9 and 12 month returns were all significantly positive.
The other divergence in the market that we don’t find altogether favorable near-term, but won’t dwell on yet again, is the crude oil price-S&P 500.
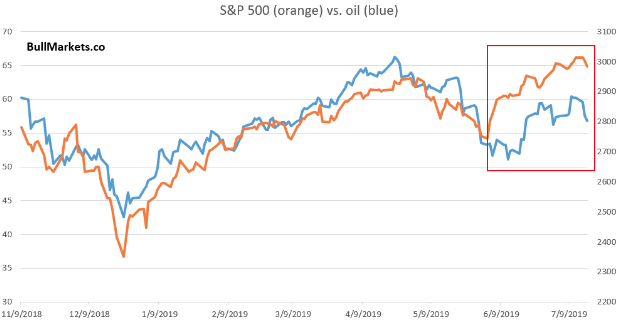
Like the transportation sector, we also know that part of the crude oil gyrations since late 2018 have been due to geopolitical issues and to a lesser degree demand issues. While some or none of these market divergences may result in a more protracted pullback in the major averages, if they do, we can refer to them as valid market signals and use them going forward and with greater confidence.
In highlighting these market concerns, divergences and/or signals, Finom Group reiterates its 12-month price target for the S&P 500 of 3,120. (Issued 2 weeks ago after achieving our former 2,950 price target) As such, should a market downturn present itself over the coming 30-60 days, we believe this presents longer-term opportunity to deploy capital on lesser valuations. With respect to the quality of a market pullback, Citi Research also suggests a pullback that might commence doesn’t show itself as having signs of producing a bear market.
The firm has compiled its own checklist of 18 items to identify if global equities are about to enter a “bear” period. Although the S&P 500 is near a record high, Citi says only four of the cautionary metrics that indicate this is the top are currently fulfilled.
“Our Bear Market Checklist helps us compare current global variables to those before previous major bear markets.”
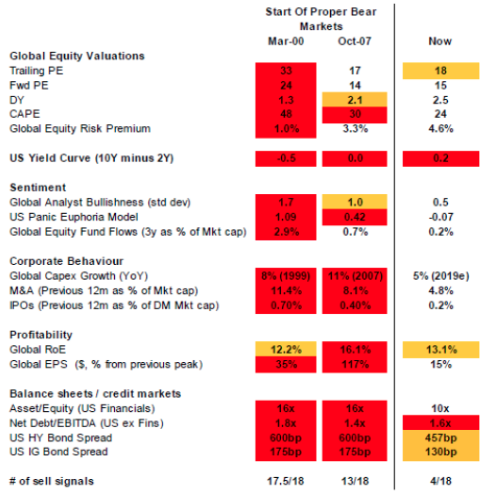
Only four of the 18 factors on its checklist “are flashing sell,” Citi noted – much less than the 17½ in 2000 and the 13 in 2007, when stocks entered a prolonged decline. Citi’s list counts the red as “worrying” and a full point toward the 18, while amber means “perhaps” and is worth half a point.
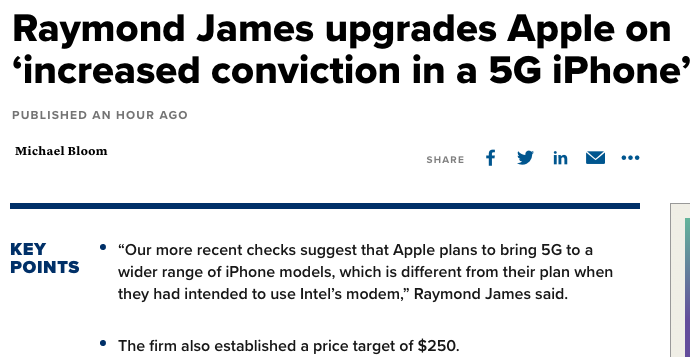
In the 6:00 a.m. EST hour, equity futures are staging a rally, although still setting up for a lower open on Wall Street. With an Apple Inc. (AAPL) upgrade from Raymond James Thursday morning and what is turning into another upside surprise earnings season, investors have found themselves in a continued “buy the dip” mood throughout 2019.
While investors are likely to be found less convicted in the early morning hours of trade, they will be watching how the tech sector parses NFLX and AAPL shares’ performance ahead of Microsoft’s quarterly results, to be released after the closing bell.


