It was a banner day for the S&P 500 (SPX) on Wednesday with Fed chairman Jerome Powell serving up the FOMC’s monetary policy testimony before a Congressional Committee. At 8:30 a.m. EST. The S&P 500 E-mini futures achieved and broke through the 3,000 level. When the Semiannual Monetary Policy Report to the Congress was publicly released the equity market futures rose sharply, as the transcript indicated a greater degree of uncertainty amongst Fed members with regards to the economic outlook and a high probability for the Fed to cut rates near-term.
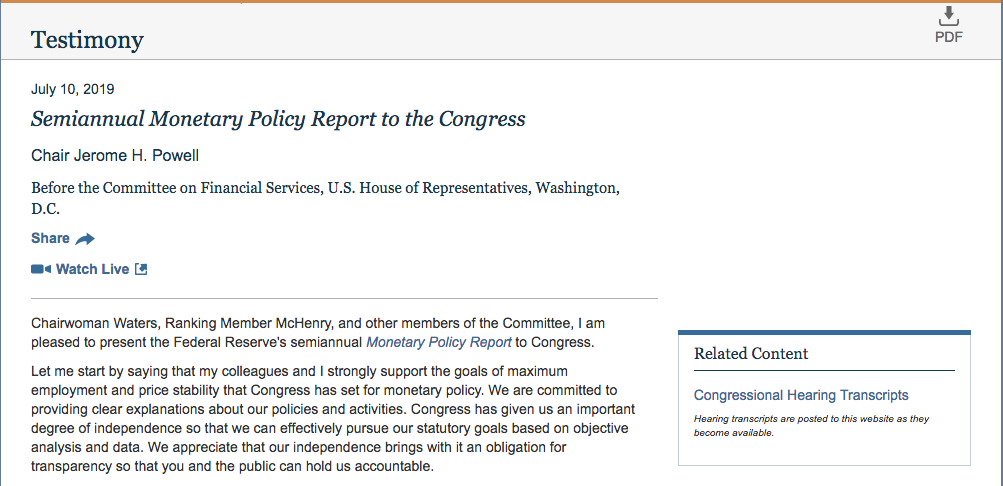
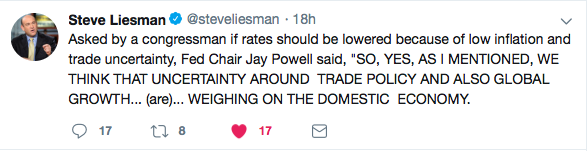
During Powell’s testimony before congress, the chairman emphasized weakness in the global economy due, in part, to trade concerns. The Fed, for its part, is prepared to “act as appropriate to sustain the expansion,” Powell reiterated, using a phrase that economists say points strongly to a rate cut at the bank’s next meeting at the end of July.
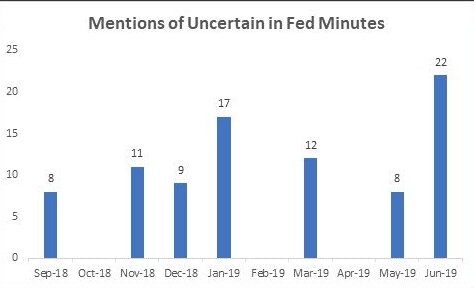
In addition to Powell’s rate cut indications in his testimony on Wednesday, the Fed’s June meeting minutes were released in the late afternoon. The minutes supported Powell’s testimony, highlighting the usage of the term “uncertainty” used to describe the economic outlook.
Participants’ Views on Current Conditions and the
Economic Outlook:
Participants judged that uncertainties and downside risks
surrounding the economic outlook had increased significantly
over recent weeks. While they continued to view
a sustained expansion of economic activity, strong labor
market conditions, and inflation near the Committee’s
symmetric 2 percent objective as the most likely outcomes,
many participants attached significant odds to
scenarios with less favorable outcomes.
Although the S&P 500 only held the 3,000 level briefly once the opening bell was sounded on Wall Street, equity futures are carrying forward the momentum on Thursday. Asian markets finished the overnight session higher across the board and European markets have begun the morning trading session higher as well. It remains to be seen if the latest bout of dovish Fed rhetoric and testimony can sustain the equity market rallies going into the heart of earnings season, and with fewer buyers abound, as we refer to some notable market buyers and positioning below:
- >90% of SPX corporates have entered the buyback blackout window. The blackout window opens back up on August 2nd.
- Hedge Fund net leverage went from 56% start of June to 66% today. That is the most buying in 5 weeks in the past 5 years (GS PB data).
- CTAs are near max length. >$100bn bought since June1.
- Household equity allocation was 62% in January and is now 87%.
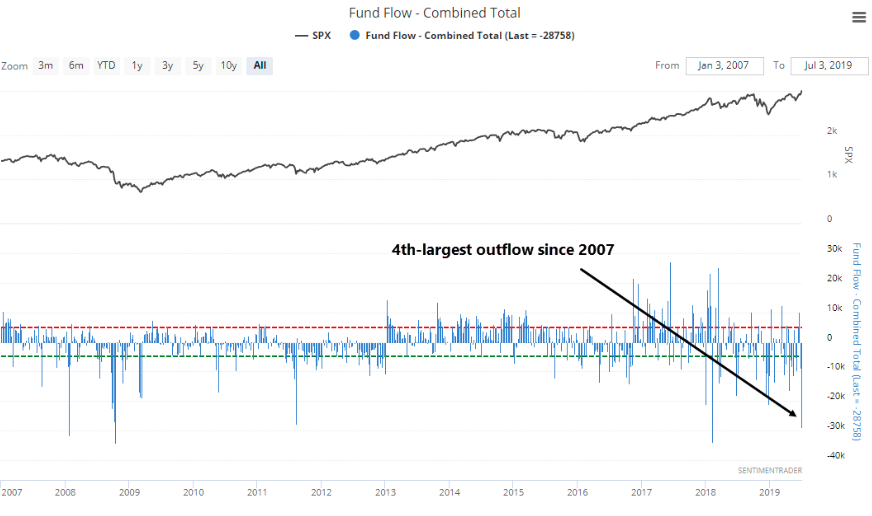
And when it comes to investor fund flows, they were none too positive recently. According to the Investment Company Institute, investors pulled more than $28 billion from equity funds (mutual and exchange-traded) in the week before Independence Day. This represents the 4th-largest outflow in over a decade.
As we recognize the strength of the Fed’s rhetoric and dovish tilt to support economic growth long-term, we also recognize that the Fed can only do so much. To the extent the Fed finds itself in a potential position to ease financial conditions by cutting rates once again, the reasons point to both inflation and global trade conflicts that have weighed on prices and general economic activity. J.P. Morgan Chase’s chief equity strategist Dubravko Lakos-Bujas discusses the trade conflict issue and impact in his latest notes to clients.
“Markets are on thin ice,” when it comes to the impact of potential trade outcomes. If you have a trade deal, and if the trade deal coincides with one or two rate cuts from the Fed, we see an upside scenario of 3,200-3,300” for the S&P 500 index.
If for whatever reason we go down the wrong path, and we get escalation of the trade dispute, then we have a downside of 2,500, or a 16.6% decline from it’s record closing high set July 3.“
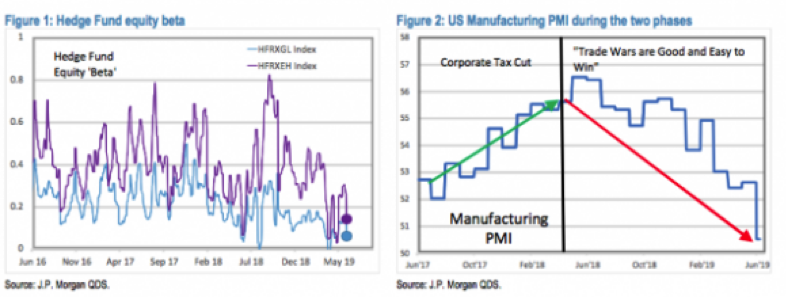
According to analyses done by Lakos-Bujas and his colleagues, the cumulative impact of new tariffs has been enough to lower S&P 500 earnings-per-share by $5, and a third round of tariffs, which were put on hold following President Trump and President Xi’s meeting in Osaka in June, would lower those by another $4 per share. He also estimates that the cost to individual households would rise from $600 per year to $1550 per year, more than the $1200 estimated benefit to the average American household provided by recent tax cuts. J.P. Morgan also recognizes the impact on corporations from the trade war and the former tax cuts in the following charts:
Despite his prediction of two Fed interest rate cuts this year, Lakos-Bujas is not sold on the idea that low bond yields, or the recent inversion of the 3-month Treasury bill and the 10-year Treasury note yield curve, is telling investors anything significant about the economy.
While Fed policy remains the second most important factor for markets in the coming months, Lakos-Bujas said, the magnitude of the range of outcomes is likely much smaller. “Our view is that we’ll get cuts in July and again in September,” he said, but “the second cut are what people are debating.”
“I have a hard time in taking a stance on whether bond markets lead the stock market or vice versa. History says once the yield curve inverts, at some point you get a recession,” but it gives very little certainty on when that recession will occur. Meanwhile, “We’re getting conflicting messages [from the bond market],” he added. “On the short curve you see inversion, but looking at the 30 year minus the 5-year or 10-year, you’re seeing a steepening of the curve. In the current backdrop, I wouldn’t put a lot of weight on the yield curve.”
With rate cuts all but certain in the July FOMC meeting ahead, what can investors look forward to over the next several quarters. When it comes to what investors might expect from market returns after the first rate cut, it’s highly dependent on whether or not the rate cut is an insurance cut or a recession cut. At present, most investors, economists and strategists believe a rate cut would be an insurance cut. And more often than not, such cuts prove to benefit the market going forward, according to the Barclay’s table noted below:
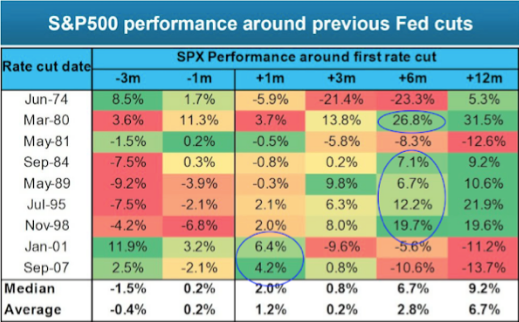
The last time the first rate cut led to consistently lower stock prices (and SPX wasn’t already well on its way to a bear market) was nearly 40 years ago: the May 1981 rate cut came a half year after S&P 500 had peaked and was barely out of a recession that had begun 17 months earlier. The 1974 rate cut came 7 months into a recession and a year and half after the peak in S&P 500. The 2001 rate cut came 9 months after the peak in S&P 500 when it was already down 15% and well on its way to a bear market. It’s different this time, in a good way (from Isabelnet). And speaking of the S&P 500 peak, some might think the Fed can’t possibly cut rates with the S&P 500 currently at its peak. Think again…
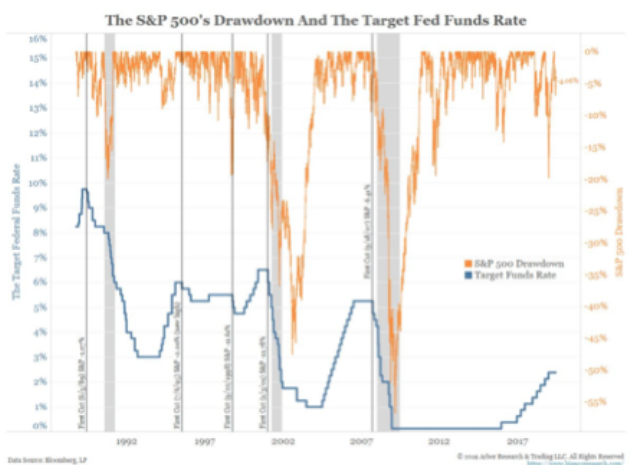
As shown in the chart below, the Fed cut rates in 1995 with the S&P 500 right at its all-time high.
So with the markets at all-time highs and the Fed likely to begin an easing cycle, what should investors become increasingly focused on? Of course it will be earnings, earnings and guidance. Economic data will always be flowing, but the immediate future of the markets may rely heavily on earnings and guidance.
One of the issues with looking at historic data as it pertains to earnings is that the data tracking from various firms differs. Lipper/Refinitiv says earnings grew by roughly 1.5% in Q1 2019 while FactSet says earnings fell by roughly -.5% during the same period. But if we do indeed take that worse case scenario and utilize FactSet’s forecast for the Q2 earnings period, what does an earnings recession foreshadow with regards to market returns? The chart below from FundStrat describes the most recent, 2015-2016 EPS declines.
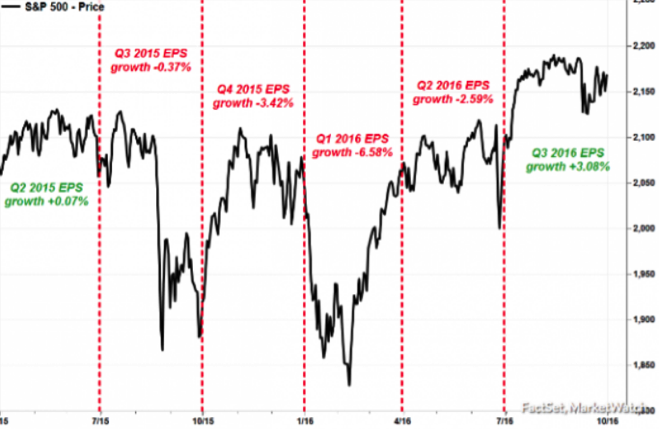
It’s clear that markets had a great deal of volatility during this earnings recession. What is also clear is that the market’s gyrations resulted in positive returns 12 months out, although the 3-9 month returns were negative. The following table from Bullmarkets.co identifies consecutive quarters of declining EPS since the 1990s.
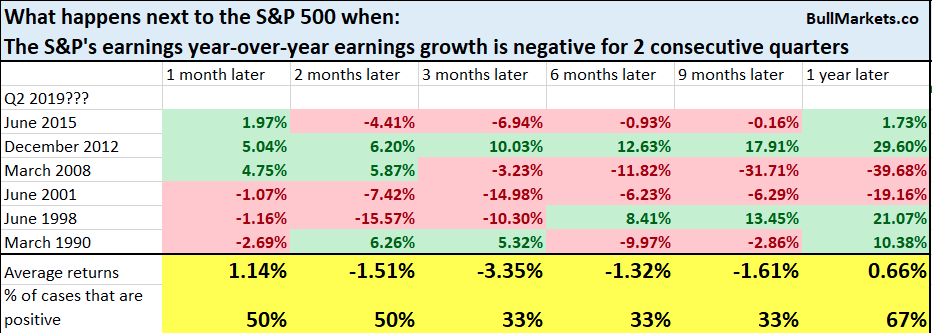
Again, the results over the next 3-9 months are mostly negative after the first month. So here is the analysis we have to perform with respect to both a rate cut and a potential earnings recession colliding in the same period/time frame. As noted before in the Barclay’s chart, the market tends to perform with positive returns after the first “insurance” rate cut. The last insurance rate cut that also coincided with an earnings recession was in 1998. As such, that is likely our reference point for potential modeling of future S&P 500 returns. Below is that extrapolation of potential modeled returns.

As shown in the table above, 3-months after the first rate cut and with an earnings decline, the S&P 500 rose 8%ish. Six months later the market is up nearly 20% and nearly 20% 12-months later. But here’s the problem with that model/forecast potential. What we can also see in the Nov-98 performance is that the market was delivering negative returns leading up to the earnings recession and rate cut. That obviously isn’t the case presently and with the S&P 500 up nearly 20% in 2019. “You have to really do the analysis when parsing through these statistical studies and points of interest for modeling purposes.”
No matter what the near-term market outlook might be, it’s probably more prudent for investors to consider the long-term outlook. Finom Group isn’t of the belief a recession will take place over the next 9-12 months, assuming no incremental increase in trade conflict or exogenous shock to the economy. As such, any near-term market gyrations should be used for rebalancing and advancing equity market positioning with long-term objectives front of mind.
Sure, investors will see charts and hear dialogue that market returns may be muted to negative near-term and after a strong first 6 months of the year, but not all charts are factually represented and combed over for greater analysis. Take for example the fact that the S&P 500 hit news but at the sector level…?
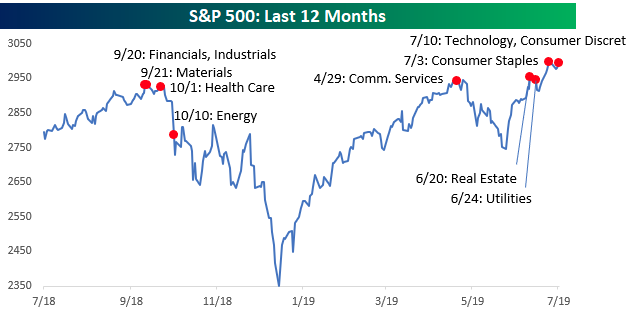
While the S&P 500 traded up to a new all-time high, it may prove interesting to understand that not a single sector made a new high in terms of their relative strength versus the S&P 500. In fact the only 2 sectors where relative strength is even close to a 52-week high versus the S&P 500 are Consumer Discretionary (XLY) and Technology (XLK). Just 2 sectors hitting new highs on a relative basis may not sound terribly impressive, but when those 2 sectors account for nearly 1/3rd of the entire index, it’s not that bad at all. Perspective, analysis!
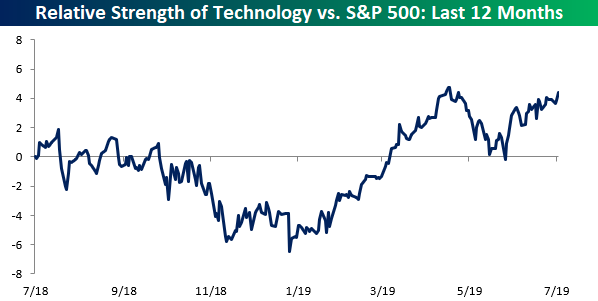
The good news with respect to the nonsensical, “But the defensives are leading”, rhetoric. Now, we are beginning to see some non-defensive sectors get in on the market action, as both Consumer Discretionary and Technology made new “absolute” highs. Trailing the pack of these sectors are Financials, Industrials (XLF), Materials, and Health Care (XLV), which haven’t made new highs in over 8 months.
Rounding out today’s daily market dispatch we look forward to limited, but FOMC relatable economic data and Fed speeches that continue with Powell’s testimony on Capital Hill.
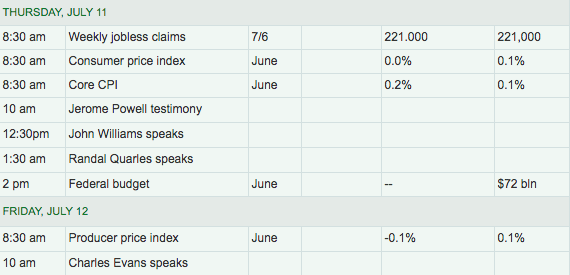
The Consumer Price Index and weekly jobless claims will be eyed today as the Fed has come to the conclusion that inflation may remain under pressure. Chairman Powell was asked about inflation headwinds and the outlook for inflation before the Congressional Committee on Wednesday.
Finom Group’s chief market strategist Seth Golden for many years has warned against the Fed’s notion of inflation and how it has not adapted to the information technology era. But in a most recent Cleveland Fed research report, the regional central banking officials offered another means for measuring inflation through the Personal Income and Expenditures data (PCE. Cleveland Fed researchers introduced two new measures of trend inflation, a median PCE inflation rate and a median PCE excluding OER inflation rate, and investigated their performance.
Subscribe today and trade with Finom Group with our real-time trade alerts and live Trading Room application Monday-Friday. Also receive our weekly, in-depth Research Report that has proven to guide our subscribers through the turbulent and uncertain financial markets.