
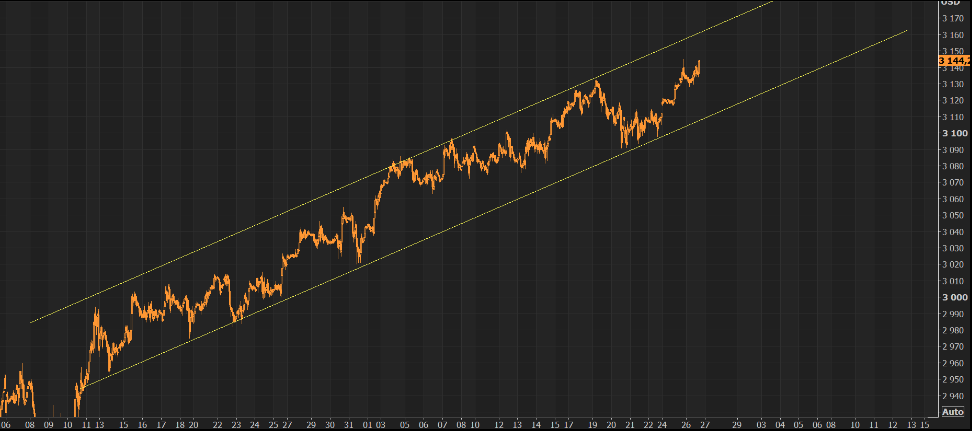
The record rally on Wall Street moves closer to Thanksgiving day as a fear of missing out (“FOMO”) may be creeping into the market. All major indices finished higher and with the S&P 500 (SPX) leading the way on Tuesday, closing up nearly 7 points to 3,140.52. The S&P 500 had its 10th record closing print for the month of November on Tuesday and continues to trade well above its 50, 100 and 200-DMA, within a rather perfect uptrend channel.
While Wall Street analysts and strategists continue to beckon an inevitable pullback, it would appear the chase for the Santa Claus rally has been in full swing over the last couple of weeks.
The fevered rush into equities of late is largely pulling forward the anticipated global economic and earnings recovery of 2020. This is a recovery that many top, big money center banks feel is the most likely outcome, as U.S./China trade relations normalize and/or de-escalate from the more than 18-month long trade feud. Here’s what J.P. Morgan’s analysts and economists see producing the global rebound in 2020:
- Macro imbalances that tend to accompany recessions are largely absent.
- Moreover, the US and China have led a broad-based easing that has successfully supported financial conditions.
- Combined with abating political risk, there are now signs of a stabilization in sentiment.
- Next year’s rebound will come as the lagged benefits of policy sup-port and rising sentiment spark corporates to normalize the pace of capex growth and stock-building.
- EM Asia should be an early mover in the rebound, as China policy stimulus gains traction and other economies in the region are levered to improvements in the global goods sector.
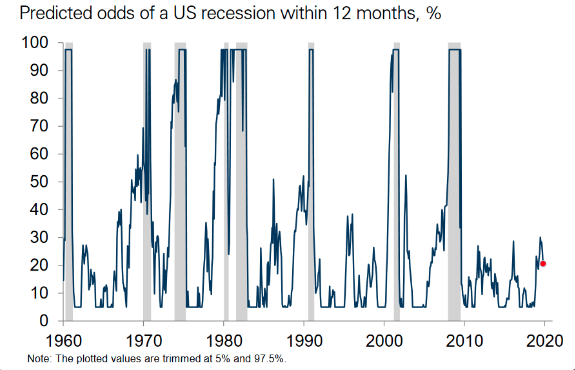
Moreover, where 2019 was found with recessionary fears through much of the year, those fears have abated in the back half of the year. Goldman Sachs (GS) Recession Risk Indicator has indicated a decrease in the risk of a recession occurring over the next 12-month period.
While all seems well with the economic outlook and the health of the market rally is producing improved sentiment amongst investors, strategist due suggest investors exercise a degree of caution.
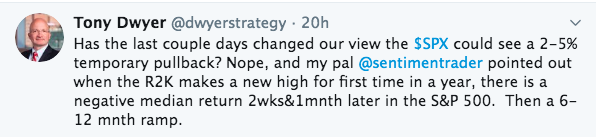
“While anything can happen, our indicators simply favor not chasing the market higher on fear of missing out (FOMO),” wrote Tony Dwyer, analyst at Cannacord Genuity, in a Tuesday note.
Tony Dwyer has successfully called the 2019 market rally and is found with a 2019 S&P 500 price target of 2,950. This price target was also met with a May price target introduction of 3,350 for the S&P 500, suggesting the benchmark index could achieve that level by May of 2020. Nonetheless, the usually bullish Dwyer does urge investors to be aware of the heavily overbought conditions presently residing within the market. Finom Group largely agrees with Dwyer’s sentiment and has identified overbought market conditions for the past 2-3 weeks.
Dwyer’s first call for a market pullback came about 3 weeks ago and was reiterated just yesterday.
Investors and traders should never cast aside their discipline and feed into the FOMO spirits of the market. Remember that the S&P 500 came into the trading week at 3,110, with a weekly expected move of just around $27/points. In just the first two trading days of the week, the S&P 500 has already crammed in the weekly expected move, finishing at 3,140 on Tuesday. Could the market rally continue through the week and post the Black ThursFriday holiday season, certainly. Moreover, with stocks up just over 2% from Dwyer’s call for a “limited and temporary correction,”, should we shrug off the warning? Here’s what Dwyer asks investors/traders to consider:
“The short answer is no. It was just six weeks ago when stocks were breaking down, the Cboe Volatility Index VIX was spiking above 20 and more than 90% of [S&P 500] components were trading above their respective 10-day moving averages.
The opposite appears true today. The markets are printing records, the bears are waffling, the bulls are competing over who has the higher target, and the VIX has dropped to under 12.”
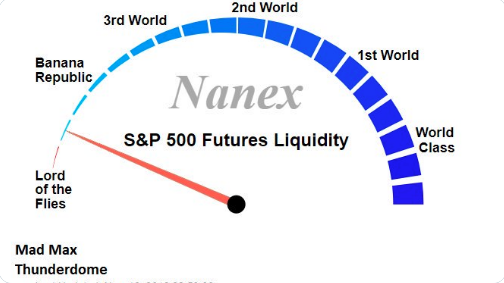
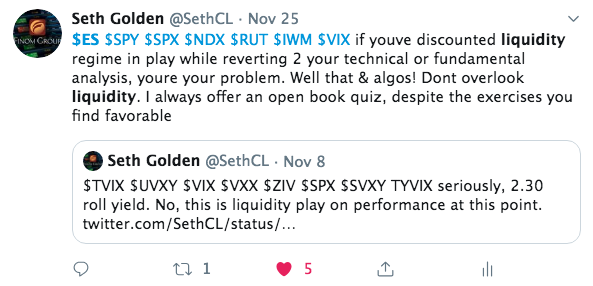
But here’s a key point that I had mentioned several weeks ago with Finom Group Premium members, within the Finom Group Trading Room: “Liquidity matters.” The market’s liquidity regime hasn’t improved all that much from Q4 2018, whereby volume was light in E-mini futures markets. While this helped to facilitate the markets trend downward in 2018, that reversed trend and market liquidity regime is having the opposite impact in 2019. Liquidity works in both directions folks. The lack of market liquidity is aiding in the continuation of the uptrend.
It’s with this understanding that we discussed the lack of market liquidity with our Premium members and within our weekly Research Reports. While the technicals, breadth indicators and general overbought market conditions were all heralding and hinting for a market pullback, Finom Group continued to sell market Volatility, while initiating new long positions. We felt the liquidity regime was simply a tailwind for prices. See my tweet and retweet from just this month below:
The Fed’s and regional central bank easing policies through 2019 have aided in improving overall market liquidity, but it has only provided modest improvement to equity market liquidity to-date. With that being said, Mizuho is of the opinion that central bank liquidity injections will have a fleeting impact on the markets and the economy, potentially waning impact post Q1 2020.
- This liquidity is necessary to avert a near-term U.S. recession, but creates long term damage to corporate and sovereign balance sheets, creating a dependence on low interest rates.
- 2020 will combine a Q1 growth rebound with sluggishness thereafter. Strong USD performance and tighter financial conditions will ultimately bring the Fed back into rate cutting mode from Q2-onwards.
- U.S. rates are likely to be reactive to the bounce during Q1, but longer term demand for rates products will be supported by growth remaining below potential, sustained weak inflation dynamics, and the inability to put global trade and Brexit uncertainties to bed.
I don’t necessarily agree with Mizuho’s conclusions, but there’s ample time to see how things play out through year-end. Speaking of rates, since peaking 3 weeks ago, U.S. bond yields have begun a 2-week long decline. The 10-year U.S. Treasury yield declined for a 2nd straight week last week, as a global pause/pullback in equities increased appetite for bonds. We still think trade and geopolitical progress could keep a floor under U.S. yields, but inevitably all rates fall to zero; it is just a matter of “when”.
As yields have fallen, the yield curve has also been flattening once again. The U.S. Treasury yield curve has gradually flattened over the past 2 weeks as long-term yields have declined. The spread between the 2-year and 10-year yield fell to 14 basis points (0.15%) through Monday, while the spread between the 3-month and 10-year yield slid to 13 basis points as of Tuesday this week.
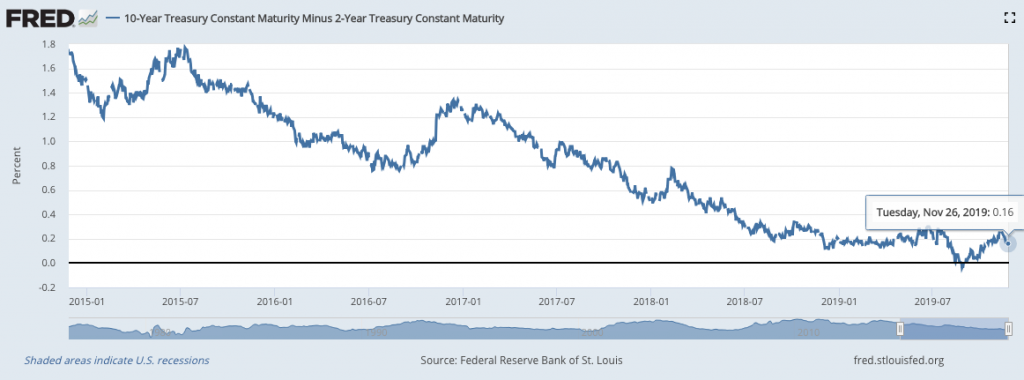
The yield curve may have trouble steepening in the near term as markets price in a Federal Reserve pause in rate cuts, which could keep short-term yields stuck at current levels. If there is something, an aspect of the market that could produce a return of investor anxiety that may prove to produce a market pullback, outside of the geopolitical conflicts, it could be the yield curve flattening further. I would be of the opinion that should long rates continue to decline quicker than short-term rates and the yield curve flattens to below 10 bps spread for 2s/10s Treasury yields, the market will take note of this and recession fears may resurface. This scenario, however, may not come to pass until 2020. Just something to monitor for now!
Here comes the shopping bonanza that is Black ThursFriday folks! Finom Group hopes everyone travels safely through the holiday season and enjoys time with friends and family. But as we look forward to all the shopping season data and headlines, we recall our conversation surrounding the underperforming Consumer Discretionary ETF (XLF) from Tuesday:
“One way to view this underperformance is in the rolling 20-day performance of the S&P 500 versus the Consumer Discretionary sector (XLY). As of last week, for example, the S&P 500 was up 4.1% over the trailing 20-trading days whereas the XLY was down over 1 percent. That wide of a performance gap over such a short duration has not existed in this bull market cycle until now.“
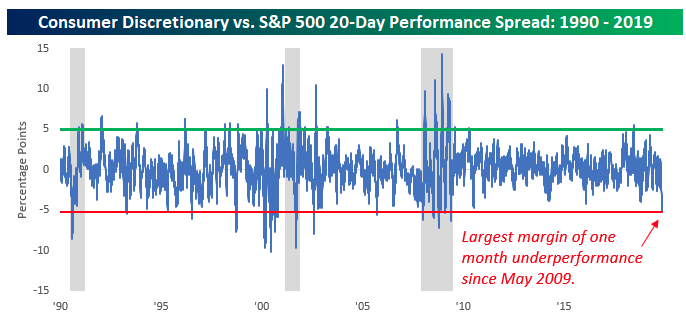
“The chart above (from Bespoke Investment Group) shows the rolling 20-day performance spread between the XLY and the S&P 500. Last week’s plunge in this reading took it below -5% for the first time since coming out of the recession in May 2009! What the chart also identifies is a possible trough in the SPX:XLY performance ratio near-term.“
And wouldn’t you know it, the XLY put in a nice green candle on Tuesday, up nearly .70% on the day. Shares of Amazon (AMZN), Home Depot (HD), Starbucks (SBUX), Target (TGT) and McDonald’s (MCD) all produced nice gains on the day, moving the XLY higher on the day. Even so, the XLY is flagging, with a number of lower highs and higher lows over the last few months.
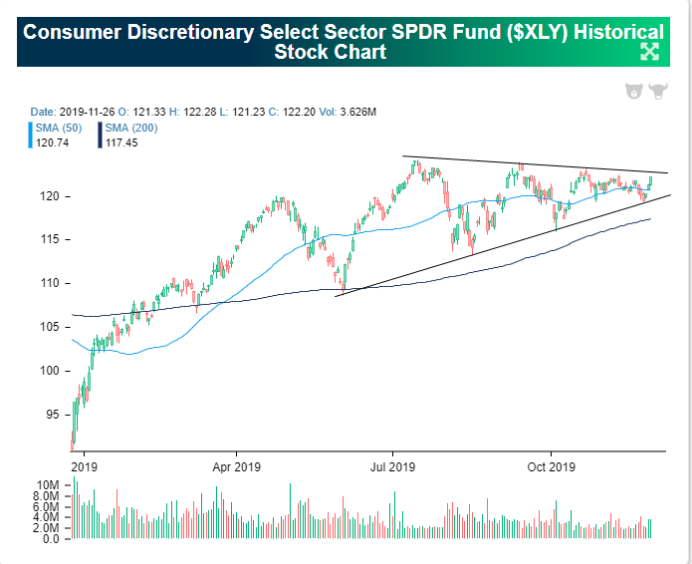
Suggests a significant move whichever way it eventually breaks. Right now it’s testing on the upside as it is nicely above its 50-DMA and with AMZN shares testing 1,800 and recently moving back above it’s 50-DMA as well. AMZN shares account for a 22% weighting within the Consumer Discretionary ETF. Finom Group has suggested that the XLY may be bottoming and ready to breakout in early 2020. We’d likely be looking at this ETF as an acquisition during a broad market pullback.
It’s been a great November folks, and this is what we’ve largely expected based on the Strong January Playbook discussed in previous reports. However, history didn’t suggest it should be quite this strong, hence the liquidity factor identified earlier.
- November: With just a few trading sessions left, the S&P is up 3.2% this month. That’s higher than the historical average of 1.3%, but comes as no surprise given that the index was higher 75% of the time during “Strong January” years.
So what might we anticipate for the month of December? Again, to understand the historic data we have to use the Strong January Playbook, at least and keeping in mind that this is a pre-election year as well.
- December: Looking ahead, the average historical return for the last month of the year based on years with especially large January returns is +2.8%. The S&P was also higher 88% of the time during this month. The worst return was -1.2% in 1975 and the strongest was +7.3% in 1987.
And if you think the market can’t possibly continue higher, the Strong January Playbook suggests higher highs are not only possible, they are probable.
- Every “strong January” year except 1987 saw positive double digit annual total returns for the S&P: 1961 (+26.6%), 1967 (+23.8%), 1975 (+37.0%), 1976 (+23.8%), 1985 (+31.2%), 1987 (+5.8%), 1989 (+31.5%), 1997 (+33.1%). The S&P was even up in 1987, albeit by single digits.
- The average total return for these years is 26.6%. This year, the S&P is up 25% YTD.
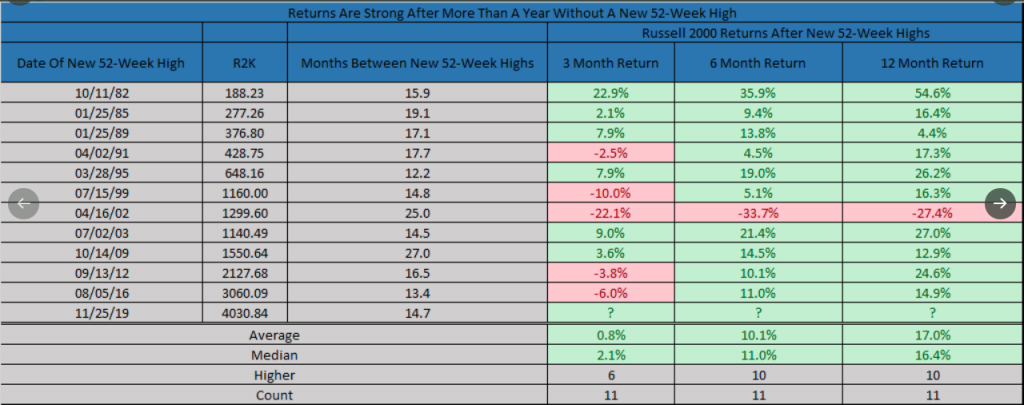
Looking beyond the S&P 500, we can’t help but to remind investors that the Russell 2000 (RUT) just hit a new 52-week high, for the 2nd trading day in a row. Small-cap stocks outnumber large-cap stocks, so this identifies improving market breadth as more and more stocks are rising. So what can we potentially expect from the Russell and the index ETF (IWM) now that it has just expressed a 52-week high, you might be asking. LPL Financial’s Ryan Detrick says that when the Russell 2000 has gone more than a year without a new 52-week high, it has been higher a year later 10 of 11 times and up 17.0% on average. Not too shabby!
As far as the final 2 trading days of the week are concerned, the appetite for both turkey and large-cap stocks is at a fevered pitch. The day before and day after Thanksgiving have historically been positive for the Dow Jones Industrial Average (DJIA), large -cap stocks. The Dow has only had 16 losses in the past 66 years for the Wednesday before Thanksgiving and the Friday after combined, according to the Stock Trader’s Almanac.
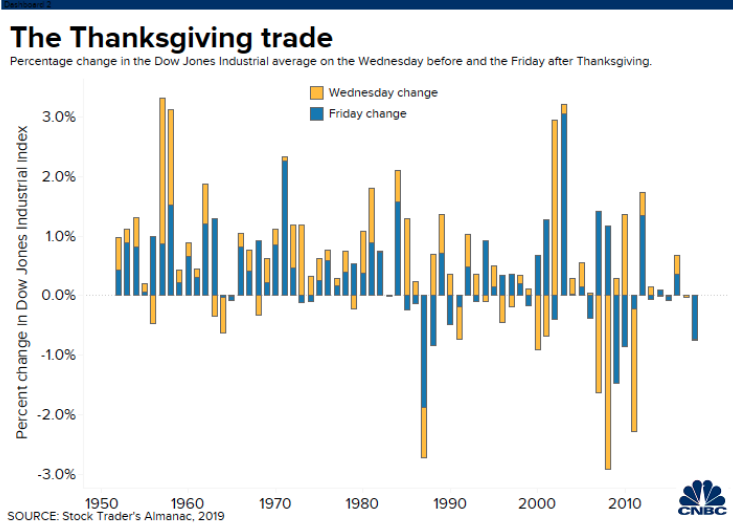
Unfortunately, the Dow has suffered losses for the past 2 straight years in the trading days surrounding Thanksgiving. For the Wednesday before Thanksgiving and Black Friday combined, the Dow was down about 32 points and 180 points in 2017 and 2018, respectively.
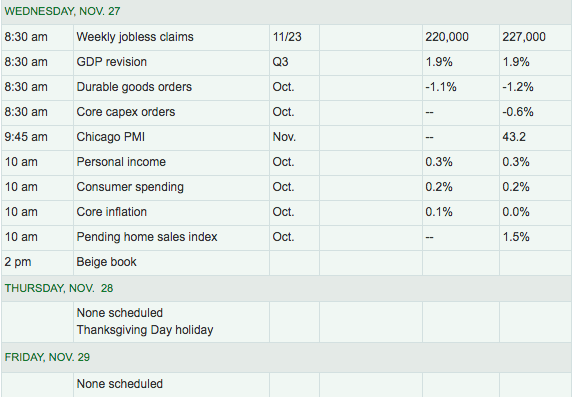
Least we not forget about all the economic data about to hit the market on Wednesday, a full trading day. Friday will be a half day of trading as equity markets will close at 1:00 p.m. EST.
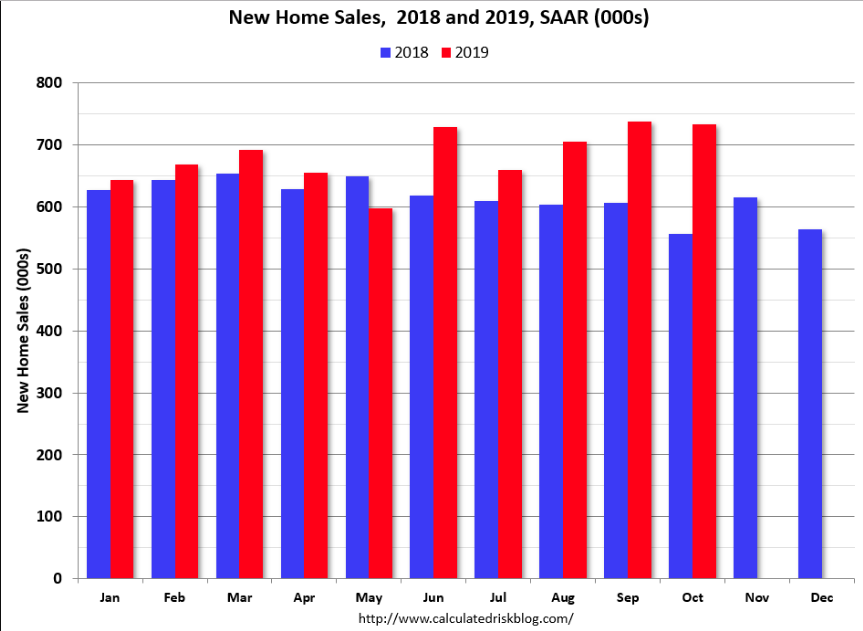
New home sales data was released on Tuesday, with a rather subdued headline. Sales of newly-constructed homes in the U.S. decreased 0.7% on a monthly basis in October to a seasonally-adjusted annual rate of 733,000, the government reported Tuesday. But the headline decrease was only because of the outsized and positive revision to the September New home sales data.
The figure for September was revised up to 738,000 from 701,000. As a result, September’s new-home sales surpassed June’s figure, which had broken a 12-year record at the time. Sales in October were up 31.6% year-over-year compared to October 2018. After a year-long decline in 2018, New home sales have bounced back to cyclical highs.
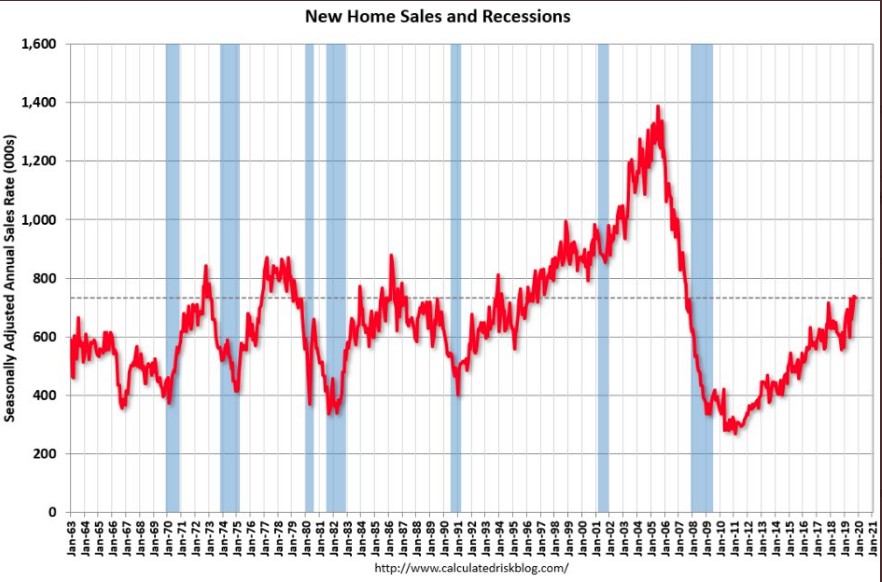
Sales were above 700 thousand SAAR in four of the last five months – the best five month stretch since 2007. Annual sales in 2019 should be the best year for new home sales since 2007. The comparisons for the last two months are easy, so sales should be double-digits in 2019 compared to 2018.
This is a very solid year for housing, says Bill McBride, with price appreciation moderating higher YoY as well. Inventory has been stable within the New home market, but waning for the Existing home market. Given the inventory levels, we may see a continuation of price appreciation going into 2020. Aside from the New home sales data, investors will see what the Pending home sales data has to offer Wednesday. Keep in mind, all of this data being released on Wednesday will come with Q4 GDP forecast revisions. Happy trading all, and Happy Thanksgiving from all of us at Finom Group!


