
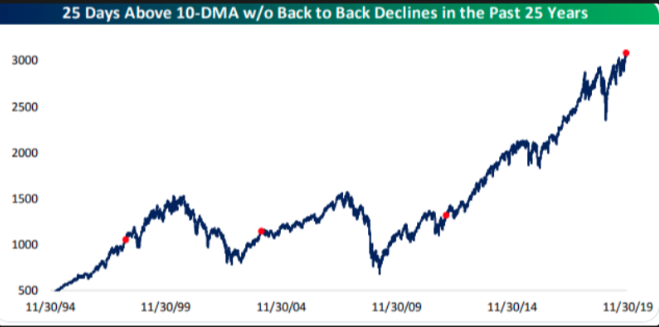
After 3 complete trading days for the week, the S&P 500 has accomplished… basically nothing in terms of points. After breaking above the record achieving 3,100-level, the index has basically retreated to the flatline for the week. The weekly expected move for the benchmark index is roughly $28/points with just 2 trading days left in the week. With the VIX rising on the week by nearly a point or 7%, it’s clear that risk is rising around a near-term pullback, as investors seek protective measures. The S&P 500 has now spent 26 days above it’s 10-DMA without back to back declines, “nose bleed” territory folks. (Chart from Bespoke Investment Group)
In the present day and with a seemingly endless rally afoot, we hear a great many investors and traders suggest this is the greatest bull market in history. It’s certainly the longest bull market in history, but the greatest… not so much! This bull market isn’t the strongest in history in terms of gains, even though it has lasted longer than any other bull market, as shown in the LPL Financial chart below.
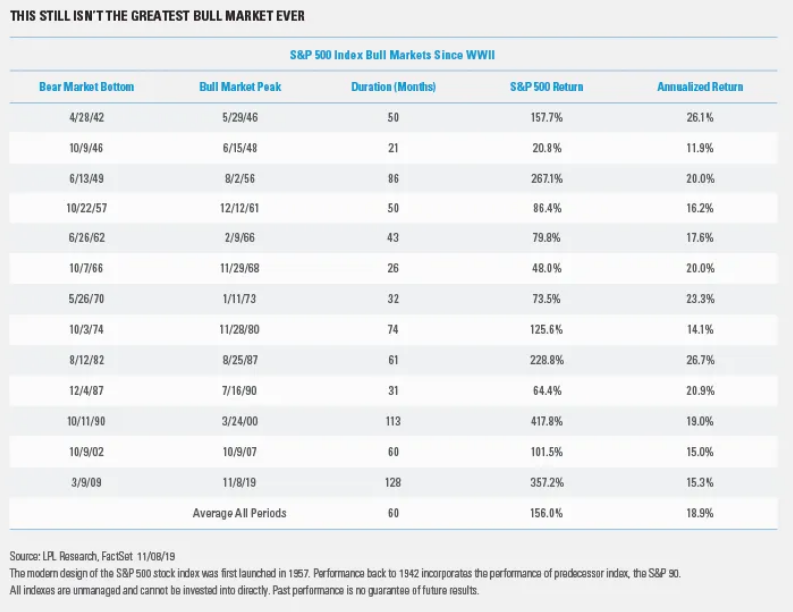
On an annualized return basis, this bull market has gained 15.3%, which is actually weaker than the average bull market annualized gain of 18.9 percent. Don’t let recency bias fool you folks!
The headlines making the rounds on Wednesday were largely geopolitical in nature, but markets largely shrugged off the headlines. Although it had previously been announced that the U.S. and China had an agreement in principle, there appears to be a snag in moving that agreement forward. The U.S. is trying to secure stronger concessions from China to regulate intellectual property protections and to stop the practice of forced technology transfer in exchange for rolling back some of the tariffs. China is also reportedly hesitant to commit to a specific amount of agricultural products in the text of a potential deal. China has agreed to buy up to $50 billion in U.S. farm goods as part of the so-called phase one trade deal, to-date. Regardless of the reported headlines, President Donald Trump said Wednesday a U.S.-China trade agreement is “moving along rapidly,”

Although the headline appears to postpone the signing of a phase 1 trade deal, it doesn’t exonerate it. Such a headline in past months proved the undoing of markets, as investors soured on the possibility of a trade truce, let alone a trade deal of any kind. While the headline did find equities under pressure Wednesday when it broke, stocks quickly rebounded with the Dow Jones Industrial Average (DJIA) and S&P 500 both finishing higher on the session. The Nasdaq (NDX) fell just under 4 points on the day, led lower by tech titans.
The market is sending a very clear signal to investors and U.S./China trade delegates regarding the trade war, and here is what we have stated numerous times in the Finom Group Trading Room: The market doesn’t need a deal as much as it requires no further escalation, no more tariffs. At this point in the economic cycle and trade war, U.S. corporations have mostly absorbed the imposed tariffs in 2019. The headwind has been felt, absorbed, adjusted for and reflected in quarterly results. Going forward, in 2020, the tariffs in place will simply prove the new normal and not the 2019 YoY headwind that they have been to-date. Any new/additional tariffs would lend themselves as a new headwind; the markets don’t want new/additional tariffs. As such, trade headlines proposing a snag in a phase 1 trade deal would not carry the same weight for investors as an outright escalation. Escalation means further economic and profit deterioration, ongoing negotiations equate to a continuous trade truce with the potential for a trade deal of sorts. Markets respond accordingly!
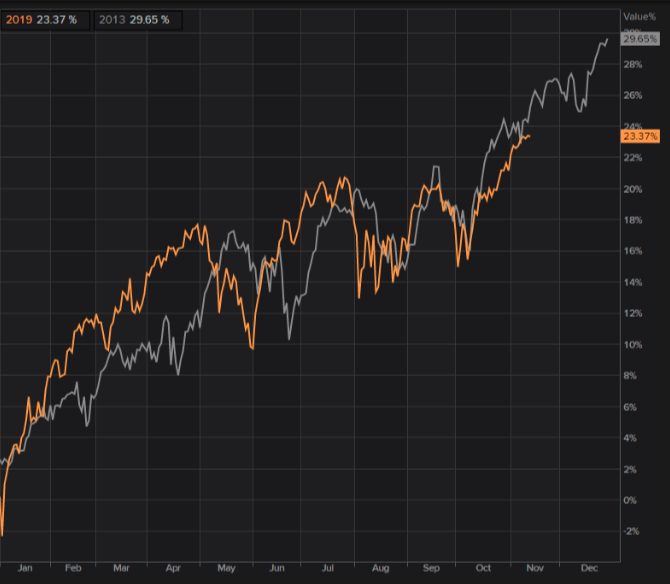
As we enter the final two trading days of the week, the market hasn’t corrected, but rather churned. It remains to be seen whether the major indices will correct for time or for valuation. Nonetheless, it appears that the record setting rally for the cycle in 2013 has held a very strong correlation to that of the 2019 rally. The two period charts for the S&P 500 are eerily similar and may prove to develop further with algorithms.
While investor sentiment has been on the rise and in step with the equity markets, we’re starting to see the unwind of the massive snap back rally in yields. The 10-year Treasury yield has rallied mightily post the Fed’s latest rate cut and announced pause in future rate activity. This week, however, a goodly portion of the yield rally has come under pressure as the 10-year yield falls back into the low 1.8% range.
This was to be expected as yields are likely to remain under 2% until the expected rebound in economic growth actually materializes both domestically and globally. Goldman Sachs (GS) recently shared their thoughts on bond yields.
- Despite talk of tariff rollbacks and a generally favorable economic outlook, we believe a major portion of the bond market selloff is behind us. Our analysis suggests that 10y Treasuries will struggle to move sustainably above 2.2% (and above 2% without tariff rollbacks), largely on account of policy expectations having reset lower over the past year, and central banks signaling a high threshold for future changes.
Lower yields will aid in the continuing rebound in the housing sector as well as mortgage market. Even with rates for a 30-year fixed rate mortgage on the rise in the previous week, we saw mortgage applications soar once again. Total mortgage application volume rose 9.6% last week compared with the previous week, according to the Mortgage Bankers Association’s seasonally adjusted index.
Refinance demand, which is most sensitive to small rate moves, increased 13% from the previous week and was 188% higher than a year ago, when interest rates were 114bps higher.
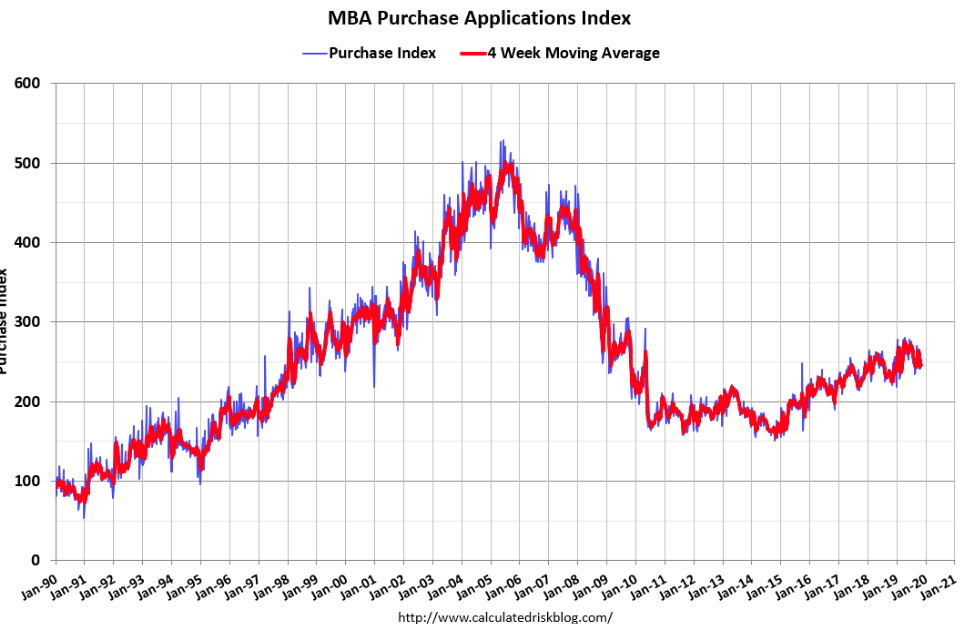
Mortgage applications to purchase a home rose 5% for the week and were a sharp 15% higher than one year ago. Buyer demand is high right now but is being tempered by a short supply of homes for sale, especially at the entry level. Mortgage application data continues to hover right around cyclical highs after a year-long decline in 2018.
Thursday’s economic data calendar is relatively light and coming on the heels of Fed chairman Jerome Powell’s testimony before a Congressional committee on Wednesday that proved innocuous. Initial Jobless Claims will highlight the light economic data calendar while a host of Fed speeches will likely grab headlines throughout the trading day.
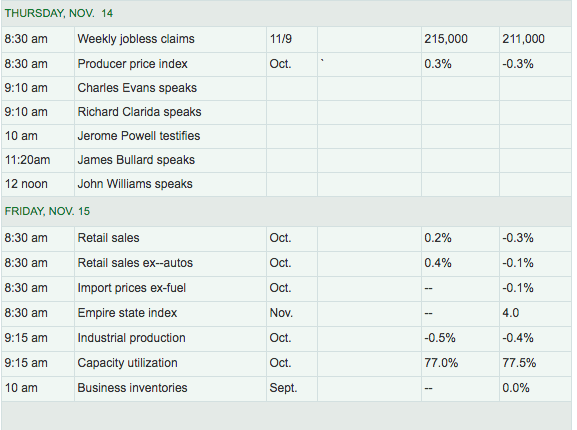
The big data point of the week remains Friday’s Census Bureau release of the October monthly retail sales. Expectations have come down from .3% earlier in the week to just a .2% rise as of Thursday.
The economic data released outside of the U.S. hasn’t proven as robust as some of the narratives surrounding a potential rebound would suggest recently. Germany’s gross domestic product increased by an adjusted 0.1% from the previous quarter, according to Destatis. This is better than economists’ expectations of a 0.1% contraction in The Wall Street Journal’s survey.
The agency, however, also revised the second-quarter data. Following the revision, Germany’s GDP decreased 0.2% in the second quarter of 2019, compared with a first estimate of a 0.1% decline. GDP grew 0.5% on year in the third quarter on a calendar and price-adjusted basis, Destatis said, in line with a Wall Street Journal poll of economists.
The economic data coming out from China overnight was none to kind to the boasts of an economic recovery afoot in the region. Readings of economic growth slowed further in October, government data showed overnight Thursday, with disappointing numbers in industrial output, household consumption and fixed-asset investment. China’s official National Bureau of Statistics said value-added industrial output in October was up 4.7% from a year earlier, slowing from September’s 5.8% pace and short of the median 5.2% forecast of 15 economists polled by The Wall Street Journal. Retail sales were up 7.2%, likewise slowing from September’s 7.8% pace and missing the 7.8% forecast.
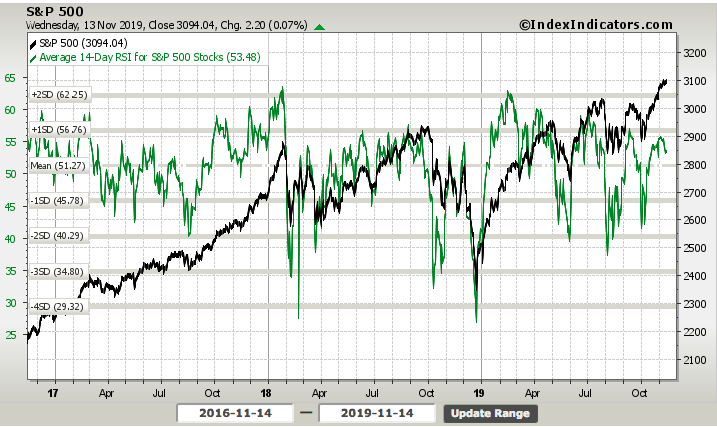
Without any major economic data releases in the U.S. Thursday, investors will continue to focus on the inevitable market pullback, as the headlines would suggest and given the protective activity taking place in the market. While we don’t necessarily see the portfolio protection activity through the put/call ratio, at all, it is showing up in VIX options activity. The chart below is worrisome, as it identifies the complacency among investors through the total put/call ratio against the rise in the S&P 500.
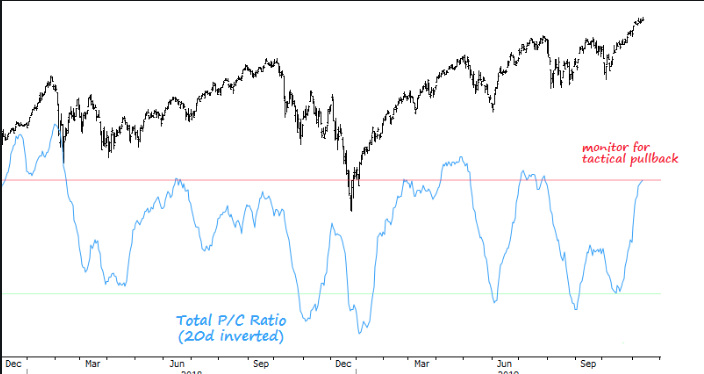
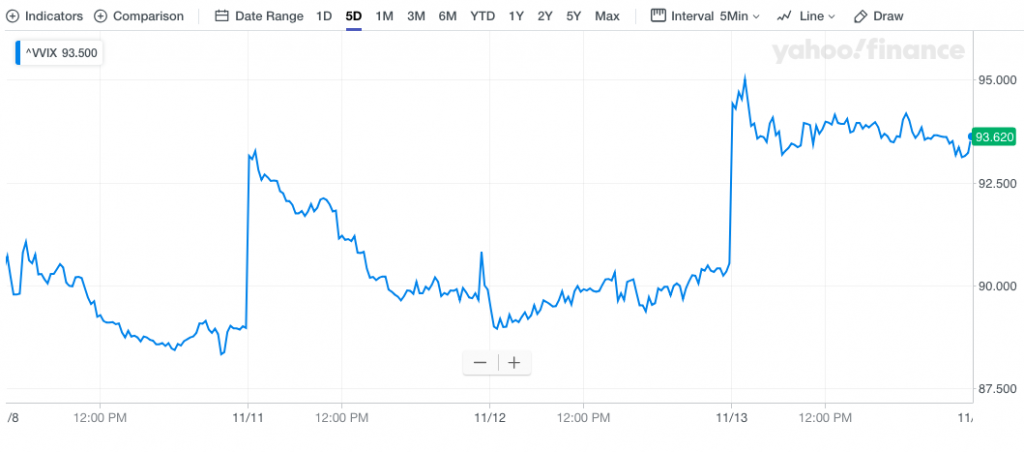
When at these levels in the total put/call ratio, we tend to see a market reversal of sorts. And with respect to VIX option activity on the rise, we can see that even with the S&P 500 breaking out to record level highs, VIX call options have been in high demand this week. The Volatility of Volatility Index jumped more than 3 points on Wednesday and is up nearly 4 points on the week.
Looking underneath the hood of the S&P 500 itself, we also come to find that the protective activity amongst investors using VIX call options may be in fitting with a diverging S&P 500 RSI reading this week. Breadth has weakened lately and depending on which breadth indicator one studies.
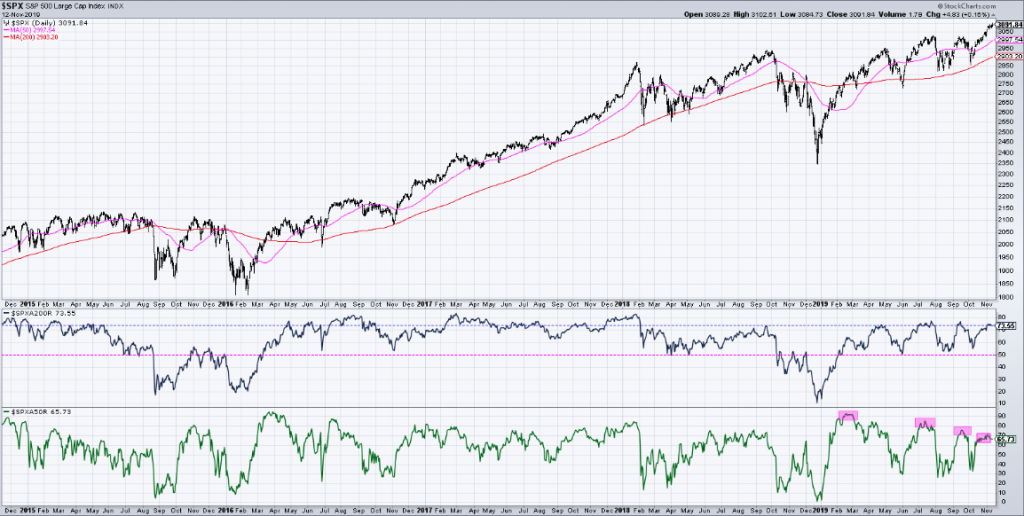
The other chart that identifies even greater breadth concerns is the S&P 500 number of stocks trading above their 50-DMA. It continues to print lower highs even as the S&P 500 has moved higher above it’s respective 50-DMA. The chart below identifies the breadth weakness from the deteriorating percentage of stocks trading above their 50-DMA, within the S&P 500 (bottom box, pink highlighted lower highs)
So how is it that the S&P 500 internals/breadth are breaking down, but the index itself continues to move higher? Market cap weighting is the answer! This is something that Finom Group discussed two weeks ago, in our weekly Research Report. This is why our readers should subscribe to our Premium or Contributor Membership levels, to have up-to-date analysis on what’s taking place in the economy and under the hood of the market rally to-date. Without any further ado, here is what we outlined in our report titled Breakout The Champagne! Record Highs Abound For Stock Indices!… and with regards to market internals.

“To answer the why we have to better understand what comprises the S&P 500. The S&P 500 index consists of most, but not all, of the largest companies in the United States. The S&P 500 market cap is 70 to 80% of the total U.S. stock market capitalization. It is a commonly used benchmark for stock portfolio performance in America and abroad. Beating the performance of the S&P 500 with less risk is the goal of nearly every portfolio manager, hedge fund and private investor. That should be everyone reading this report, by the way ! Now that we know what the S&P 500 is, so to speak we should now what stocks make up the greatest weighting. That’s the “why” we are looking for, which serves to explain the divergence found in the market internals.
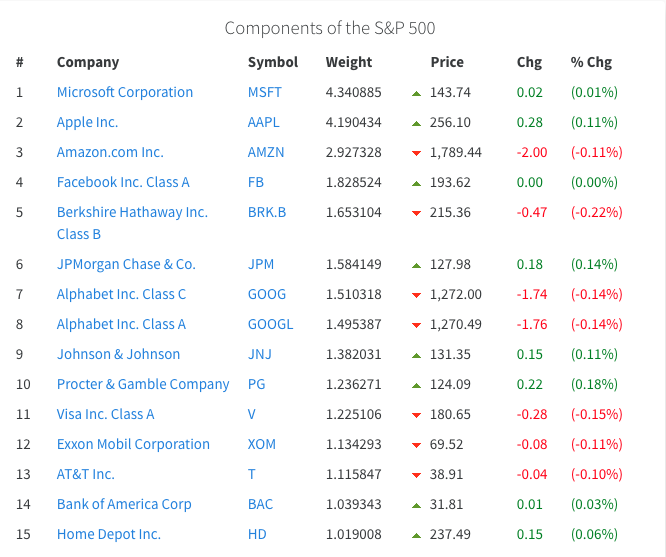
“You may have heard the saying, “As Apple goes, so goes the S&P 500”. As shown in the table above, AAPL shares are the second most heavily weighted stock in the S&P 500. AAPL shares are also up more than 60% year-to-date, 14% over the last month and were up nearly 4% this past week alone. So while many of the stocks within the S&P 500 are still not trading above their 50 or 20-DMA, the S&P 500 can still trend higher as shares of AAPL have performed remarkably. What this exercise or study in “why” we are seeing breadth divergence from the S&P 500 also suggests is very important. It suggests that should AAPL shares falter more so than what can be made up by a greater constitution of the S&P 500 stocks, the benchmark index would likely come under pressure.“
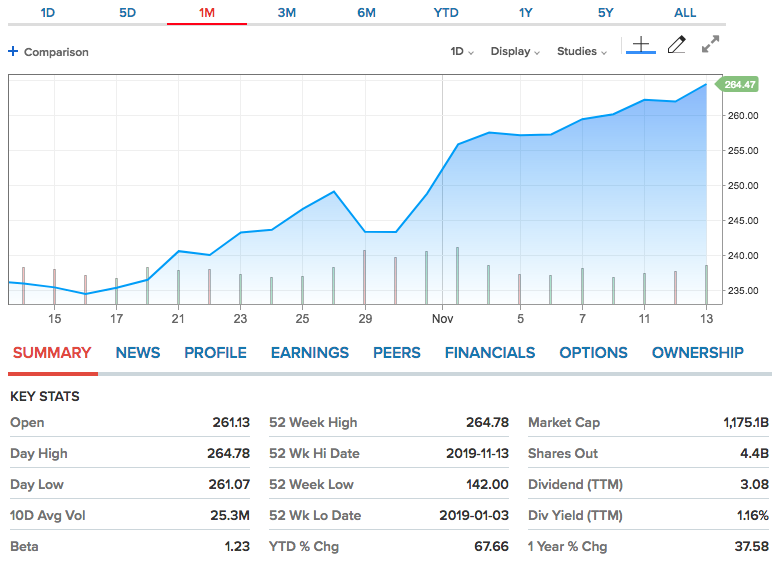
Since we offered this explanation to Finom Group members 2 weeks ago, AAPL shares have continued to march higher, carrying the S&P 500 with it. The monthly chart and table of AAPL shares below identifies the record high set just yesterday.
At some point, AAPL shares and possibly Microsoft (MSFT) shares will take a breather; when is anybody’s guess. We’re not in the guessing game and we would suggest investors not participate in such market timing either. Long-term, the macro-fundamentals suggest one very clear path forward and upward into 2020. Hence, should the market pullback near-term, it’s likely prudent to do exactly what corporations are doing, buying back their stocks. If you’re not a stock picker, the index or sector ETFs will do just fine. Having said that, below is a table of some of the recently announced buybacks over the last quarter.
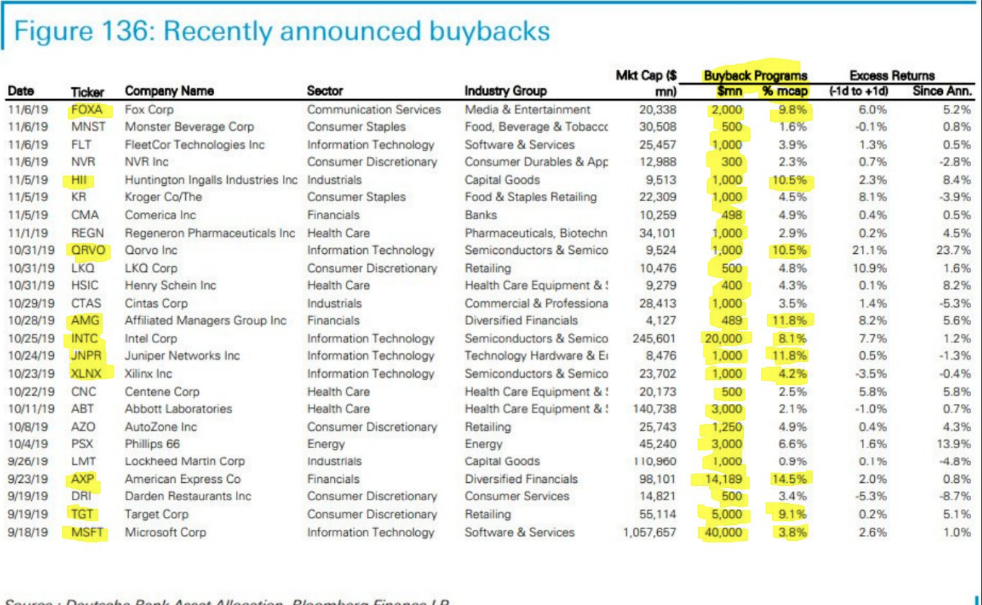
And look who’s at the bottom of that list with a monster dollar value buyback plan!
Ahead of the market’s open on Wall Street Thursday, equity futures are tilted lower. All eyes and ears will be tuned into Wal-Mart’s (WMT) quarterly results, which may also foreshadow holiday shopping expectations for the retail sector. Bank of America Merrill Lynch is expecting Walmart to report earnings per share of $1.06, compared to the $1.08 per share earned in the same quarter last year. The firm forecasts revenue of $127.961 billion, topping $124.89 billion in revenue a year ago.
Bank of America estimates 35% growth in Walmart’s e-commerce business “supported by expansion of grocery pick-up and delivery,” said Bank of America analyst Robert Ohmes in a note to clients. Bank of America and Cowen named Walmart and Target two of the top retail stocks heading into the holiday season. While it’s set to be strong, Walmart will have a tough time clearing the 4.2% comp growth in Q4 of 2018, said Ohmes.
Moreover, after the closing bell, investors will be awaiting quarterly results from Nvidia (NVDA). Tech and retail will likely be the heavily watched sectors of the trading day, as the impeachment inquiry hearings carry forward in Washington. And if you’re wondering why the market isn’t paying too much if any attention to the impeachment headlines, we remind folks of the Clinton impeachment timeline.
The rumors of the Clinton-Lewinsky affair broke January 19, 1998, on the Drudge Report, which was a market holiday. Recall U.S. stocks were in a rip-roaring bull market and massive bubble that saw the Dow rise 253% during the Clinton administration, second only to Calvin Coolidge’s roaring twenties bull market. The NASDAQ, home of the infamous dot.coms, rose a multiple of the Dow. The table below shows the timeline of various key events and the S&P500 returns.
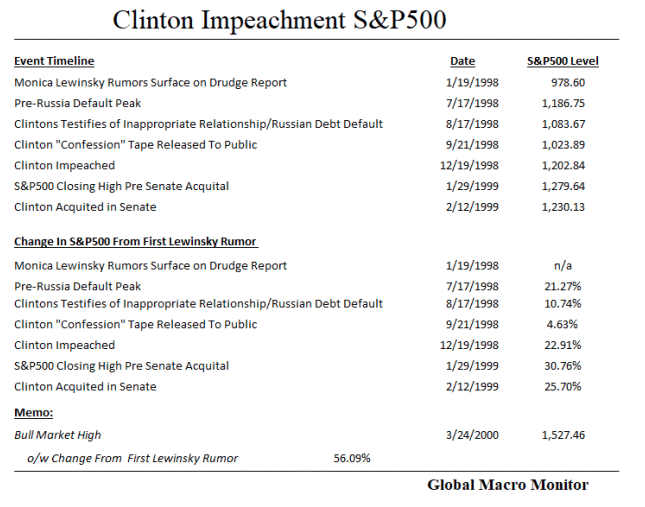
The impeachment hearings are the least of investor concerns folks, the least!


