
The S&P 500 came, saw and went just beyond 3,100 before finishing the trading day just 5 points higher on Tuesday. Will the 3,100 achievement prove the blow-off-top moment for the benchmark index or is 3,120 in the cards? Remarkably, the Dow Jones Industrial Average (DJIA) finished perfectly unchanged on the day, while the Nasdaq added roughly 22 points to its weekly gains. For all the concern and/or anticipation surrounding President Trump’s speech at the New York Economic club, even the VIX didn’t budge on Tuesday, finishing the day down just .01 to 12.68.
While the President did hit on many economic points during his speech Tuesday, he also highlighted trade issues and reasoning behind the approach to trade relations with China. The market seemingly accepted the President’s words, although much of the intraday gains were lost shortly after the speech ended. The President did indeed suggest more tariffs would be place on Chinese imports should a phase 1 trade deal not come to pass. Wharton professor Jeremy Siegel, in commenting on the markets after the speech, suggested a deal with China would prove a powerful thrust for equity markets.
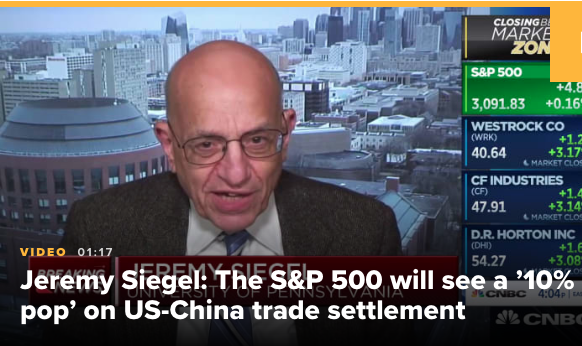
“If we get some sort of settlement, I think we get a 10% pop, at least, in the S&P. Otherwise, we’re just going to be muddling along, because valuations are pretty full at this particular juncture, until we get some push on earnings.
The most important factor for the stock market is the trade war, not any potential action from the Federal Reserve. I think the Fed has been taken out of the equation. Recession fears also have started to subside.
The market isn’t cheap. Now, it’s not expensive for the interest rate level that we’re at. But it doesn’t give a lot of room for some big disappointment. An escalation of any trade tensions would really bring a sell-off.”
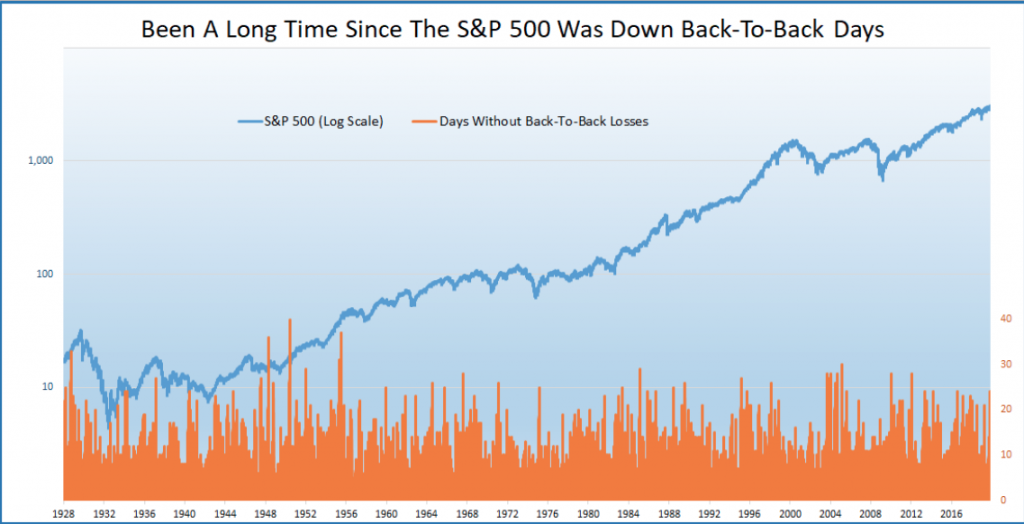
Siegel isn’t necessarily suggesting a trade deal brings about a 10% rally without its natural pauses and/or pullbacks here and there, but a 10% rally nonetheless. We offer this explanation given the remarkable S&P 500 march to its recent record highs. It’s remarkable in that the S&P 500 hasn’t been down back to back days for 25 days, beating the longest streak since Aug ’16. and tying the longest streak since early ’12.
With many market participants calling for a market top and subsequent pullback seemingly daily, it remains to be seen when that pullback will arrive. Additionally, it remains to be seen just a deep of a pullback will be produced. Investors are looking beyond the present period and pricing in future earnings, as such many are willing to make the argument that the market has not topped out for 2019 and as the equity risk premium remains relatively high when compared to bonds.
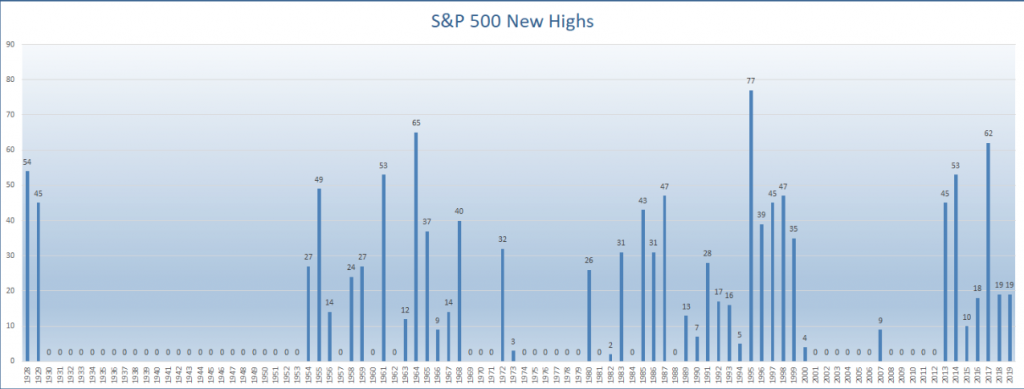
In reviewing the year-to-date S&P 500 performance, which finds the benchmark index up some 24%, it has done so while making many new record highs. The S&P 500 has made 19 new all-time highs during 2019 in fact. This ties it with the 19 it made last year.
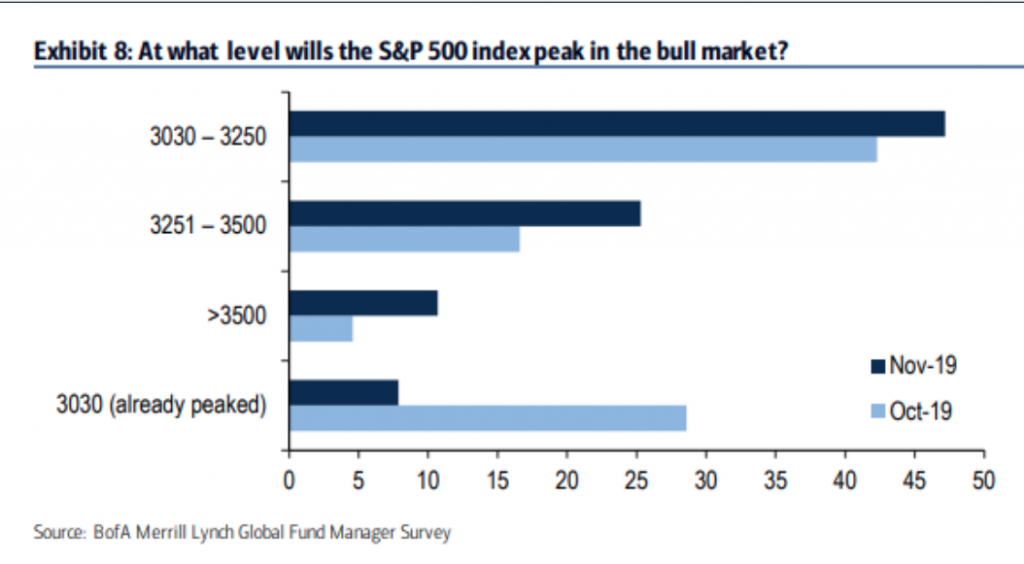
Record highs have seemingly come on a daily basis lately, and with the S&P 500 breaking to 3,102 on Tuesday, but how far could it go into 2020. that’s exactly what the latest Bank of America Merrill Lynch fund manager survey aimed to answer. From BAML’s fund manager survey and based on respondents answers, the S&P 500 is now expected to peak at 3,246, up from 3,166 last month and the highest expectation since the question was first asked in June 2018.
All year-long, the BofAML fund manager survey has expressed concern over the economy, the stock market and fear of the trade war. The concerns and fears have seemingly subsided in the latest fund manager survey, alongside a rising stock market and de-escalation of the trade war that began back in July 2018. Here is a list of standouts from BofAML’s latest Fund Manager Survey. The real takeaway is that there’s nothing like a change in price to drive a change in sentiment.

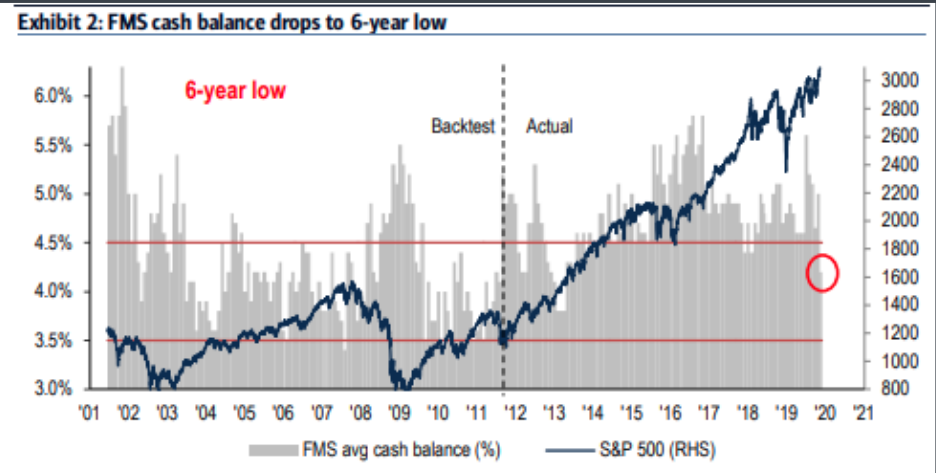
It’s nice to finally see fund managers with a little more optimistic outlook on the yield curve as well as the global economy. Possibly the most optimistic takeaway from the BofAML survey, however, was cash levels. After all, it’s one thing to say you’re feeling better about economic and market issues, it’s another to put your capital where your mouth is, so to speak. Fund manager cash levels saw their biggest monthly drop since November 2016, falling to a 6-year low. It was June 2013 when cash levels were this low. The S&P 500 rallied an additional 14.5% from the end of June 2013 to the full year end. Fund manager survey’s cash rule states that a “contrarian sell signal” is triggered when cash falls below 3.5 percent. It’s still well above that level at 4.2% presently.
This was one of the better BofAML fund manager survey’s we’ve seen in some time. There is a lot of positive and seemingly extreme sentiment going around of late, adding fuel to the market fire and as it rises to reach record heights. Allowing the positive sentiment to pervade prudent investing and trading disciplines, however, can prove a disadvantage. As such, Finom Group reiterates that market risks are always lurking, but planning ahead can replace market fear with optimism during downturns. We can’t predict with precision when downturns will take place, but we can plan for them.
We’ve expressed a willingness to take advantage of market pullbacks all year-long. Nothing has changed in that regard. As we complete the first couple of weeks of trading in November, it’s worth noting that the greatest catalyst for a market pullback is afoot this week in particular. Why is that? Well, as we wrote in this past weekend’s Research Report, it’s the last week of the year for unrestricted hedge fund redemptions. It’s one of the main reasons there is often a brief dip in markets into the final 8 weeks of the calendar year. See our notes from the Research Report below:
“In 2018, the redemption period acted to exacerbate already illiquid markets, as hedge fund redemptions soared. Leading up to this time period late last year, hedge fund investors were growing increasingly nervous, and rushed to redeem $15 billion from the markets in September, the largest single monthly outflow in years for that period.
For the hedge fund industry, November 15th is their so-called industry D-Day. It marks the deadline for investors to put managers on notice to get some, or all, of their money at year-end. Investors can cash out of most hedge funds quarterly after giving 45 days notice. Withdrawal schedules can vary, as do notice periods. Firms can also levy penalties on clients who want to bail outside of agreed schedules, while investors can cancel redemption plans if they change their minds.
The good news for 2019 is that the market is materially outperforming on a YoY basis and we don’t anticipate the same withdrawals as we witnessed in 2018 from the hedge fund industry. Nonetheless, positioning as light as it is and liquidity remaining quite low, any withdrawals from the industry will only provide a tailwind to fund outflows in the event the market does express a drawdown this coming week.“
In a rather optimistic year of trading, we don’t anticipate seeing similar hedge fund redemptions, but market positioning is still quite unsatisfactory. So while fund manager cash levels have come down, they haven’t entirely made their way into equity markets. There’s room to run folks!
Investors have come to understand that they don’t necessarily need to be the driver of markets since 2009, at least. The biggest driver of inflows for equities continues to be corporate share repurchase programs. Goldman Sachs quickly reminds investors that there’s no time like the present when it comes to buybacks.
- We are now again in the full buyback open window – which typically coincides with a +35% pick-up in repurchase activity
- Q4 historically sees the largest amount of buyback concentration
- As US Economic Policy Uncertainty has recently dropped below its 35-year average, the market is again rewarding firms that commit to share repurchases.
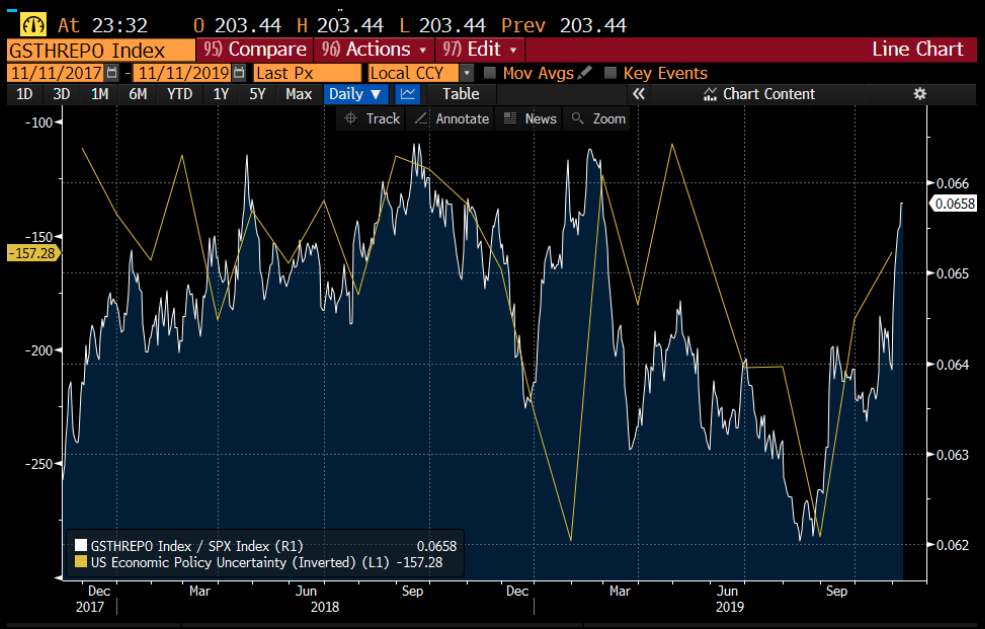
So in the event of a pullback, with economic policy uncertainty relief of some degree at-hand, we know there remains a significant buyer of U.S. equities. What might seem comical when we look at 2019 buyback plans, which are trailing only slightly the levels seen in 2018, is that CEO confidence is extremely low presently. Seriously, CEO confidence is nearly as low as it was back in 2009, but “let’s buyback record quantity of our shares”. It’s either a conflicting message from CEO’s about their economic forecast and feed through to profits or it’s not a direct correlation at all.
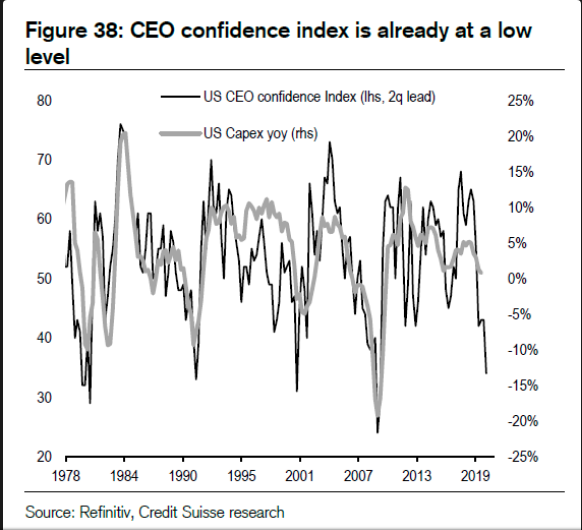
One thing is very clear from the U.S. CEO confidence Index depicted over the years, it is generally downtrending. It seems to always have this massive spike coming out of a recession or demonstrative economic event (9-11) and then downtrends from that point and throughout much of the economic cycle. In fact, this is the only economic expansion cycle since the 1970s whereby the CEO confidence Index has remain elevated and found with a higher-high, rather than lower lows through the expansion cycle. We can assign this anomaly to the anticipation of the Tax Reform Act and its subsequent passage. When it comes to this particular index, yes, this time is different.
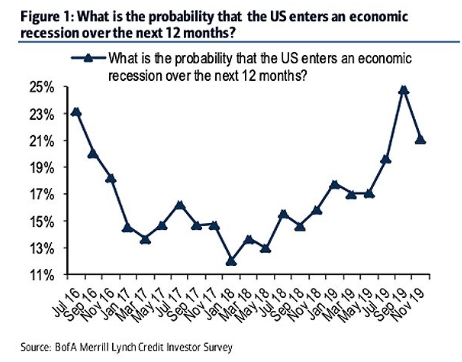
CEO’s are always “nervous-Nellies” it seems, but least we forget how nervous everyone was about the market and the economy now more than a few months ago. But since the August swoon, doom and gloom period much has changed. The rise in stocks, the steepening of the yield curve, and the rise in long term treasury yields have largely removed the threat of a recession over the next 12 months, something also identified in the latest BofAML fund manager survey. Credited investors now see a 21% chance of a recession in the next year which is down from 25% two months prior.
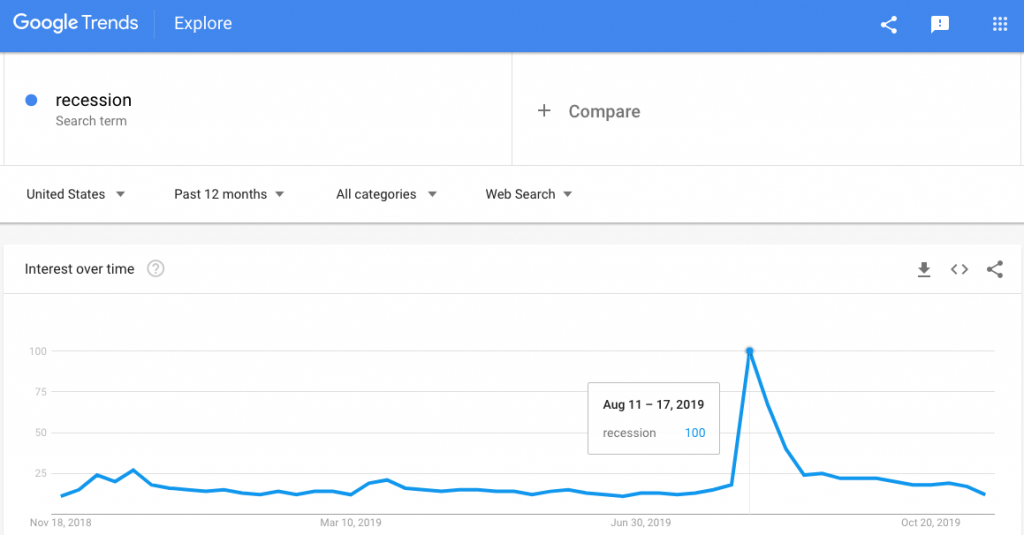
Again, this is what happens when prices change for the better, nothing more than a shift in sentiment folks. Everyone was looking for the recession in August, as the trade war was seemingly escalating to a point of no-return. Everyone was looking for unemployment to rise and initial jobless claims to bounce higher. Everyone was laying claim to the market’s demise. None of it came to pass even as everyone was searching for recession with keystrokes on their PC, laptop or mobile device.
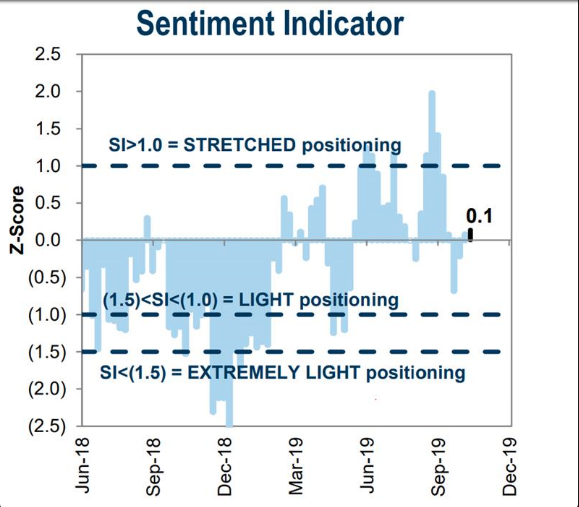
Soft data has waned for much of the year while the hard data has remained rather ebullient. And now, with prices improving for risk assets, it seems as if sentiment may be hitting an extreme high, at least for the moment.
And speaking of confidence, The National Federation of Independent Business’ Small Business Optimism Index climbed in October, reversing a two-month slide. Respondents in the October survey noted plans to increase capital expenditures and hiring, and reported subdued pricing pressures. Progress on the trade front could help lift business sentiment and encourage U.S. companies to resume capital investment, although it’s tough to expect meaningful improvement without more trade resolution. When a trade deal of sorts will materialize is anybody’s guess. The main component regarding trade going forward, however, is the absence of escalation. Even this pause without additional tariffs for the foreseeable future is a tailwind for the economy to one degree or another.
Beyond small businesses, consumers are also increasingly confident heading into the most important shopping and/or consumer spending period of the year. The stock market is at record highs, gas prices are relatively low, and the labor market is near full employment with wages rising YoY. What’s not to like. Moreover, the negative catalysts for last year don’t present a headwind for shoppers this holiday season. Threats of a government shutdown carry far more weight than impeachment inquiry headlines to-date.
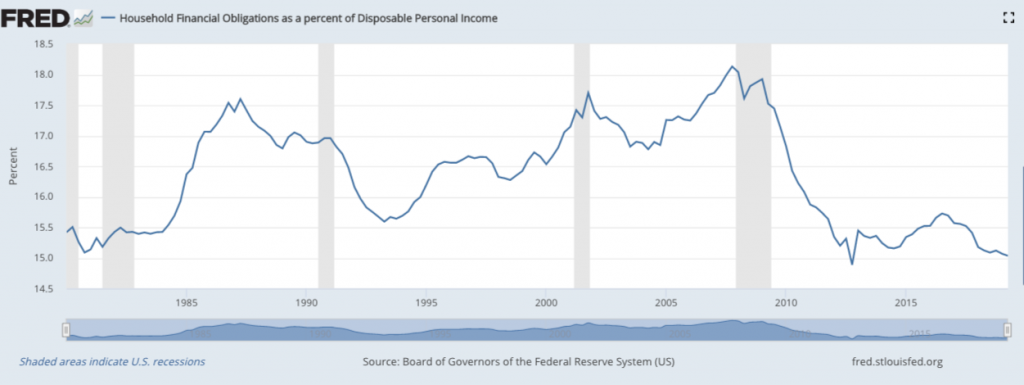
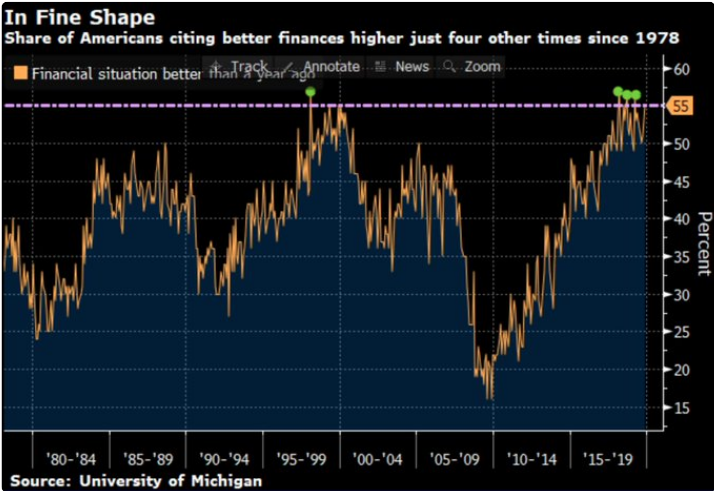
What we’ve seen from the recent University of Michigan Consumer sentiment survey is that the consumer is doing just fine. They have the best balance sheet that they’ve had since the 1970s. Household obligations as a percentage of disposable income remains quite low and continues to moderate lower throughout the expansion cycle.
Moreover, as we can extrapolate from the chart below, 55% of Americans stated their financial situation is better than it was 1 year ago. That percentage has been eclipsed 3 other times in the current economic cycle and 1 time in the late 1990s. Those are the only other times it was higher since 1978.
Possibly the best long-term view of the consumer’s health and wellness will be delivered by the New York Federal Reserve bank on Wednesday. The Federal Reserve Bank will release its Q3 2019 Household Debt and Credit Report on Wednesday, November 13 at 11:00 a.m. EST. The Household Debt and Credit Report offers an updated snapshot of household trends in borrowing and indebtedness, including data about mortgages, student loans, credit cards, and auto loans. In conjunction with the report, the New York Fed will publish a blog post exploring disparities in student loan outcomes by race. While this report isn’t a market mover, it is carefully combed over by analysts and economists alike.
As we approach the midpoint in November and gobble gobble time, we are still finding the consumer doing one thing and businesses doing the opposite. Consumers are spending, businesses are spending less YoY. That may not change all that much as we also approach an election year with certain Democrat candidates proposing a different tax structure if elected to the Chief Executive office. But consumers, consumers are still replacing the lack of business investment with advancing consumer spending dollars.
“Consumer spending is not growing as fast, but it’s still growing,” Moody said.
The “big” economic data report of the week will come on Friday, by way of the Census Bureau’s release of the October retail sales. While the typical dip in September retail sales still finds economists with concerns, they are anticipating a typical rebound in October’s retail sales results. According to Johnson’s Red Book retail sales tracking data, that rebound sentiment might be found misplaced.
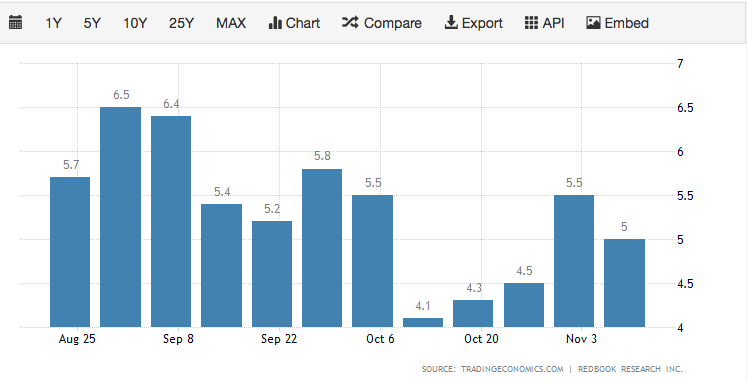
Redbook isn’t necessarily a good representation of what will be reported by the Census Bureau. The index is based on the sales data of around 9,000 large general merchandise retailers representing over 80% of the equivalent ‘official’ retail sales series collected and published by the U.S. Department of Commerce. And remember folks, the headline retail sales data is MoM and not YoY.
Wednesday is setting up to be a bit of a dicey day after SPX 3,100 has been achieved (equity futures pointed lower) and post the President’s speech in New York. What may also prove to weigh on investor sentiment/appetite is the public impeachment inquiry hearings, that will likely make headlines throughout the trading day. Lastly, the Fed Chairman will also be delivering his testimony before a Congressional committee Wednesday, which is likely to mirror his commentary from the last FOMC statement in October. So what’s your move? Do you buy the dip or is this the bear trap of all bear traps? Trade carefully mis amigos!


