
Investors will likely wake up this morning with a common theme or sentiment, “Soooo thankful October is over”! It was a brutal October for investors, having witnessed the major indices retrench into correction territory through the month and with a near 75% increase in volatility. As the calendar turns, investors are now confronted with a more politically charged and anxious market with midterm elections on the horizon. With midterms right around the corner, here are the historic facts that have defined market returns during midterm years.
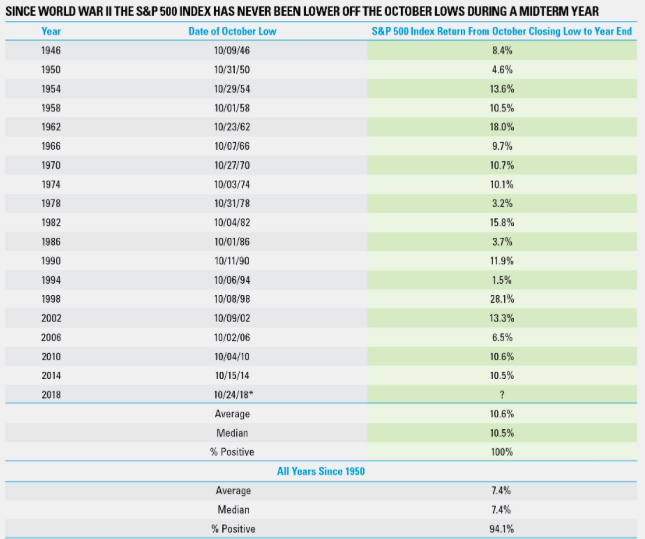
According to a study performed by LPL Financial, the past 18 midterm years saw the S&P 500 Index gain from the October lowest close until the end of the year every single time—up 10.6% on average. Given the average year since 1950 is up 7.4% on average from the October lows, midterm years can see even more strength to end the year.
We’ve had a pretty strong rally on Wall Street for the last 2 trading sessions, as buying spilled over into Wednesday, with the Dow Jones Industrial Average (DJIA) and S&P (SPX) both rallying about 1 percent. The Nasdaq (NDX) fared even better with a 2% jump. In stating that October was an ugly month for equity markets, here is just how ugly it was and why investors are thankful for November having finally arrived. For October, the S&P 500 shed 6.9% for its biggest monthly decline since September 2011, while the Dow dropped 5.1% in its biggest monthly percentage fall since January 2016. The tech-heavy Nasdaq was the worst performing major benchmark, dropping 9.2% in October for the biggest fall since November 2008.
Besides what were seemingly low valuations that investors simply couldn’t pass up spurring the recent rally in equities, economic data continues to show a strong economy in the United States, an economy that may not be weakening to the extent previously heralded by the likes of CNBC’s Jim Cramer.
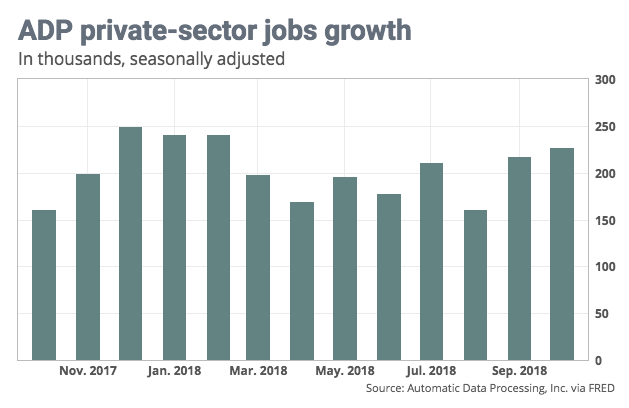
ADP on Wednesday reported 227,000 new private-sector jobs in October. Economists polled by Econoday had expected 178,000 new jobs. The September total for jobs added was revised down from an initial 230,000 to 218,000, ADP said.
The American employment picture remains strong, with the official U.S. government report on payrolls due Friday. Economists polled by MarketWatch expect the Labor Department to report 202,000 new jobs in October and a 3.7% unemployment rate.
Job growth leads to improved economic activity as proven by the recent release of Q3 GDP, which grew at a faster pace than economists had anticipated, 3.5% during the period. Alongside job growth, workers are experiencing wage growth. In fact, workers are reaping the benefits of the lowest unemployment rate since the late 1960s: Wages, salaries and benefits are rising at the fastest rate in a decade as recently reported by the U.S. government. The employment cost index rose 0.8% in the third quarter running from the beginning of July to the end of September, the government said. The 12-month increase in the ECI was unchanged at 2.8%, but it’s still at a 10-year high.
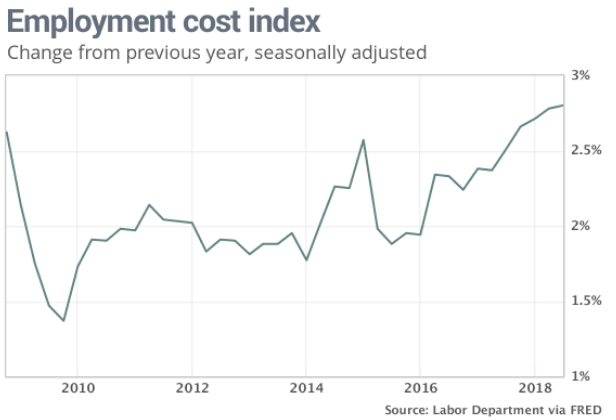
Private-sector wages and salaries grew even faster. They rose 3.1% in the 12-month period ending in September, topping 3% for the first time since 2008.
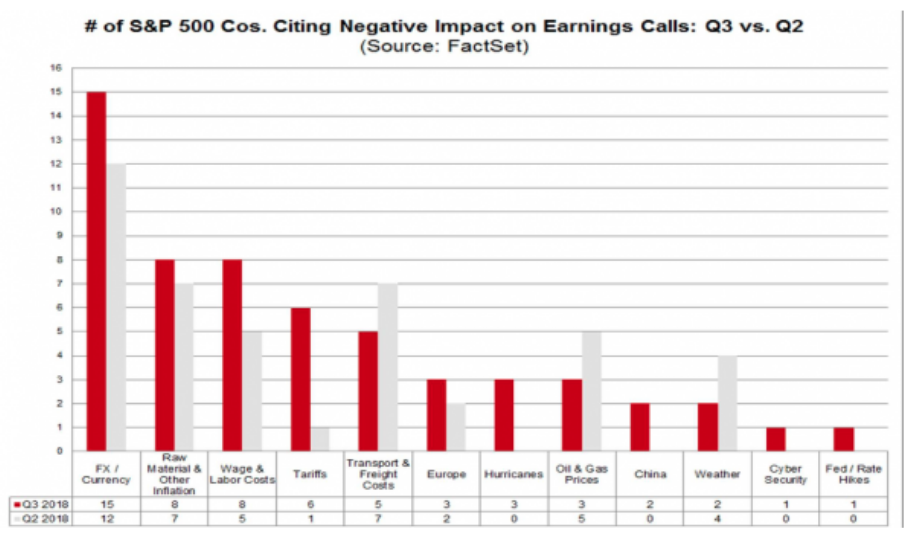
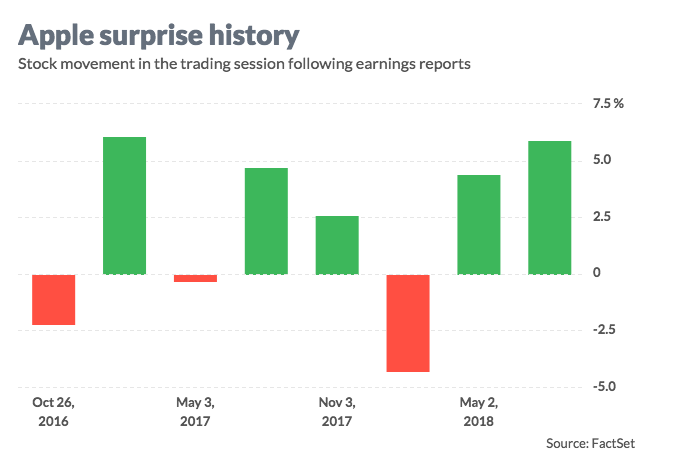
As it pertains to wage growth, even without the data on the Employment Cost Index, we understand from corporate earnings reports that wages have and continue to rise. Recall that back at the start of earnings seasons, FactSet performed a rather relevant study on the companies that have already reported. FactSet searched for specific terms related to a number of factors (i.e. “currency,” “China,” etc.) in the conference call transcripts of the 24 S&P 500 companies that had conducted third quarter earnings conference calls through October 11 to see how many companies discussed these factors. FactSet then looked to see if the company cited a negative impact, expressed a negative sentiment (i.e. “volatility,” “uncertainty,” “pressure,” “headwind,” etc.), or discussed clear underperformance in relation to the factor for either the quarter just reported or in guidance for future quarters. FactSet also compared the number of companies citing these factors in the third quarter to the number of companies that cited these same factors in the second quarter through approximately the same point in time (through July 12). The results are shown in the below bar chart:
Anybody suggesting that workers aren’t experiencing stronger wage growth, even when adjusted for inflation, is simply ignoring the data in favor of a personal bias.
“We’ve been trading on things that aren’t fundamental in nature, and now we’re back to looking at the fundamentals, which are very attractive,” Brent Schutte, chief investment strategist at Northwestern Mutual Wealth Management Company, told MarketWatch.
Schutte pointed to Wednesday’s employment-cost index release as evidence that wage growth is accelerating while inflation remains moderate. “We’re hiring more people and we’re paying them more, and that’s great news for the economy,” he said.”
Make no never mind about it folks, interest rates are rising and the volatility that markets have experienced in 2018 is a normal expression of rising rates and as investors fight internal fears of the Fed overshooting. Will they or won’t they go too far in raising rates. Whereby equities didn’t have viable competition for investor capital given the prolonged period of low rates previously, that tide is also slowly turning as rates move higher and portfolio managers weigh their options when deploying capital in the most risk adverse manner. Recall that back in December 2015, the Fed exercised its first rate hike post the Great Financial Crisis. It’s with this in mind that we have to consider what may come for the markets going forward and when the calendar year shifts from 2018 to 2019. Here’s a helpful chart from a social media friend of ours to keep in mind, as investors consider the subject matter at-hand.
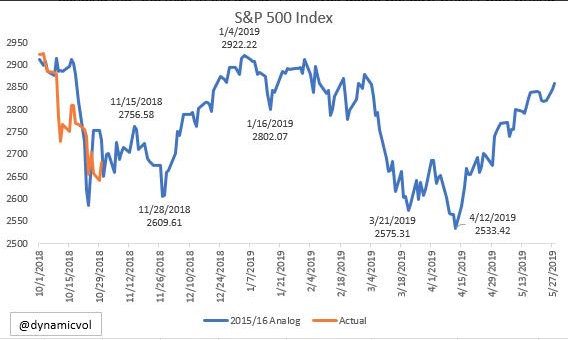
In the chart above from Matt Thompson, he asks investors to consider where the S&P 500 goes if the Aug ’15-Mar ’16 pattern repeats exactly. (He states it won’t) As recognized by the orange line, laid over the blue line in chronology, the current S&P 500 move is mirroring that of Aug “15-Mar ’16. Finom Group suggests a similar path to that of the aforementioned will prevail and largely due to the path of rate hikes the Fed is currently forging. 2015 went out with a December rate hike and it is highly probable, according to the FedWatch Tool (70+% rate hike probability), that 2018 will also go out with a rate hike. As we’ve seen with previous rate hikes, the market forces a readjustment in valuation for each rate hike that has occurred. As such, the proposed chart comparison offered by Thompson is noteworthy.
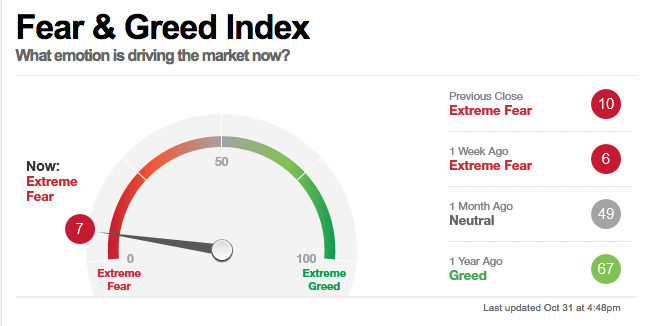
As thematic as it will sound, thank goodness we are out with October’s poor investor sentiment and market performance and thank goodness November is here… unless of course November breaks with history and doesn’t showed marked market performance. Having said that, at present the situation is looking optimistic and much of the market indicators will likely improve from recent lows. When we look at investor sentiment by way of CNN’s Fear & Greed indicator, ouch! But talk about having room to improve.
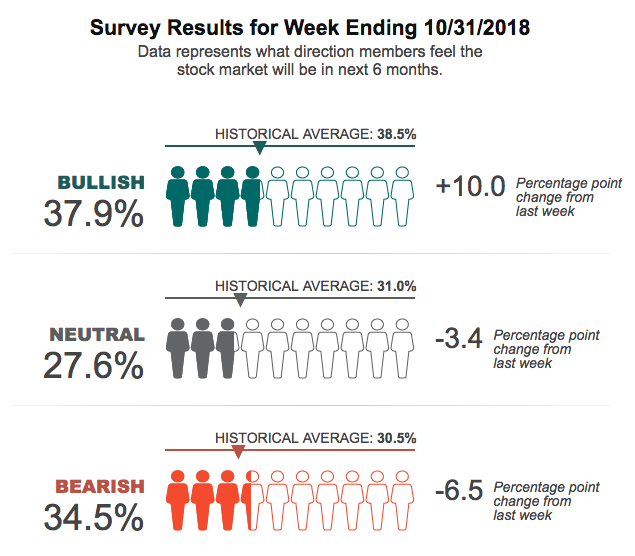
And of course when we review yesterday’s release of investor sentiment from the American Association of Individual Investors, we see an early sign of improving investor sentiment from recent 2-week lows.
Thursday will be another big day for the market in terms of earnings. Apple Inc. (AAPL) will report its quarterly results after the closing bell and to much anticipation. Apple is the last domino standing. Its FAANG brethren have all crashed, even the almighty Amazon, which has slumped roughly 25% from all-time highs. Apple’s decline is more in line with that of the S&P 500.
Bernstein analyst Toni Sacconaghi said he expects Apple to continue to reap the rewards of its pricing tactics, at least for its fourth quarter, which wrapped up in September. So far this year, Apple has been able to beat financial expectations even while selling fewer iPhones than projected, due to a greater mix of expensive devices that helped boost the company’s average selling prices.
“Given that Apple has changed its SKU [stock-keeping unit] strategy and pricing yet again (with an initial launch of the iPhone XS Max and XS), we estimate that ASPs could be significantly higher than consensus,” he wrote. Sacconaghi has projected an average selling price of $800, compared with a FactSet consensus of $748.
Analysts surveyed by FactSet expect Apple to generate earnings per share of $2.78 for the September quarter, up from $2.07 a year earlier. iPhone unit sales are expected to climb to 100 million from 99 million last December. The FactSet consensus calls for $61.4 billion in September-quarter revenue. A year earlier, it posted $52.6 billion in sales.
Of the 40 analysts who cover Apple, 26 rate the stock a buy, 13 call it a hold, and one rates it a sell. The average price target is $239.75, 11% above Friday’s close.
To conclude this morning’s daily market dispatch here is a note from Finom Group’s chief market strategist Seth Golden:
“We’ve had very strong growth in the middle portion of 2018, where a good deal of the economic growth is occurring on an annual basis. The summer doldrums are characterized that way because absent the back-to-school shopping season, there’s really not much going on. And so we go through this every single year in the economy and many years in the equity markets. Things are supposed to slow in the summer and even the fall, ahead of the all-important November-December Holiday shopping season. Ask yourselves how many more times you find yourself saying to your child in September, “If you’re good Santa will bring it for Christmas”, versus any other time of the year. I guess what I’m trying to say is the economy naturally slows before the Holiday shopping season. Nothing abnormal is happening in the economy or has been, but you wouldn’t believe that if you listened to what the media was reporting and what the stock market was doing. Believe in earnings, earnings are the truth teller of the economy and the market long-term. These fits the market goes through every now and then are normal; they come, they go, but ultimately the market aligns with corporate earnings. Investors should lean on mentors during these fits and less on media pundits in my opinion.
Is everything perfect with the economy, perfect with the market…NO! You know what’s odd about that, NOTHING! There’s no such thing as a perfect economy or a perfect market and investors shouldn’t expect anything to the contrary. Are corporate debt levels high, is the bull market historically aged? Yes and yes, but neither are causation for the market to fall off a cliff. At best high debt levels can exacerbate the severity of a bear market, but it doesn’t cause a bear market.
When everything in the market is seemingly at its bleakest point and with corporate earnings growing over 20%, what do you think will happen next?”


