
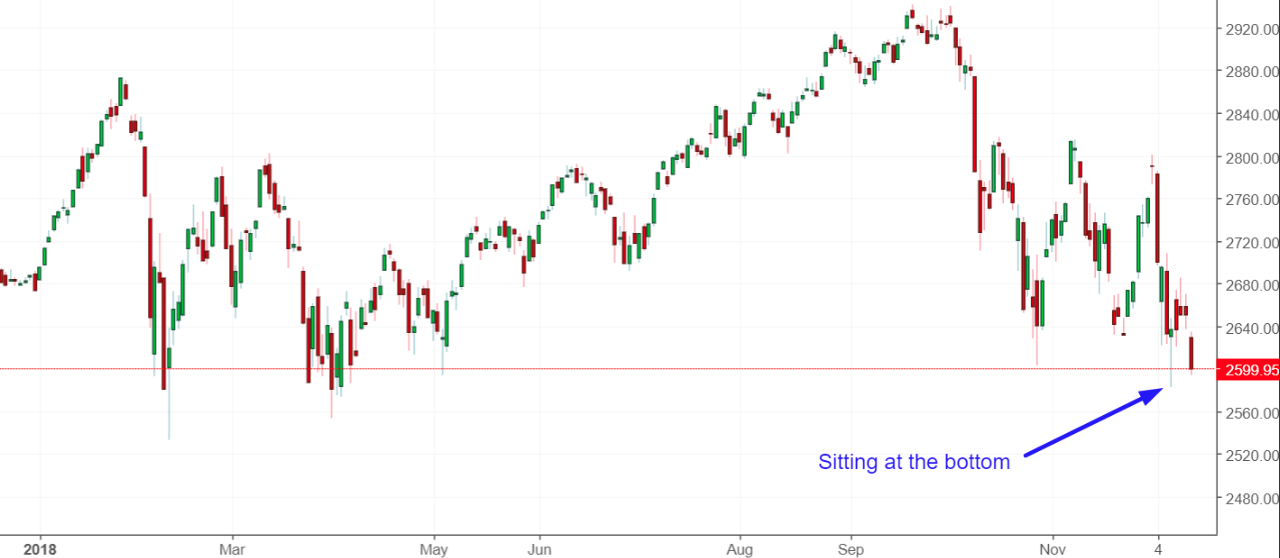
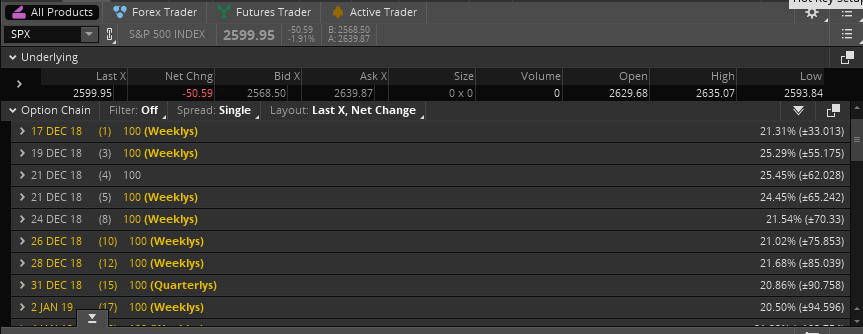
For equity market bulls, the following chart is nowhere near that which you would like to have found the markets finishing the week. Finom Group has been stating for some time now, that the mechanical/technical/quant/algorithmic correction has taken hold of the marketplace. It continuously seeks out and finds most every important S&P 500 (SPX) level on a weekly basis, bringing about a bear market condition in many sectors such as the financials and many of the FANG stocks to boot. In the previous trading week, the key level for the S&P 500 was the October low of 2,631; the S&P 500 closed at 2,633. For the week that was, the next target level to the downside was forecasted to be the S&P 500 closing daily low from February of 2,581. On Monday, the S&P 500 made a B-line to that level, touching 2,583 before rebounding. Obviously, narrowly missing the 2,581 mark was akin to the narrow miss from the October low in the previous week, but none of this matters as the S&P 500 managed to close below the key psychological level of support being 2,600. The main point we’re demonstrating through the key market levels is how fundamentals have given way to aglos/quant trading programs.
What was eerily interesting about the market last week is that while the S&P 500 fell another 1.2% on the week and is now down roughly 2.75% on the year, the VIX actually fell for the week. The VIX ended the prior week at 23.33 and fell nearly 5% to 21.63 in the week that was, diverging from its inverse correlation to the S&P 500. Does this happen often; no, not really. But here are the instances for which the S&P 500 was down over 1% in a trading week and with the VIX falling greater than 5% in the same trading week. (table from Troy Bombardia)
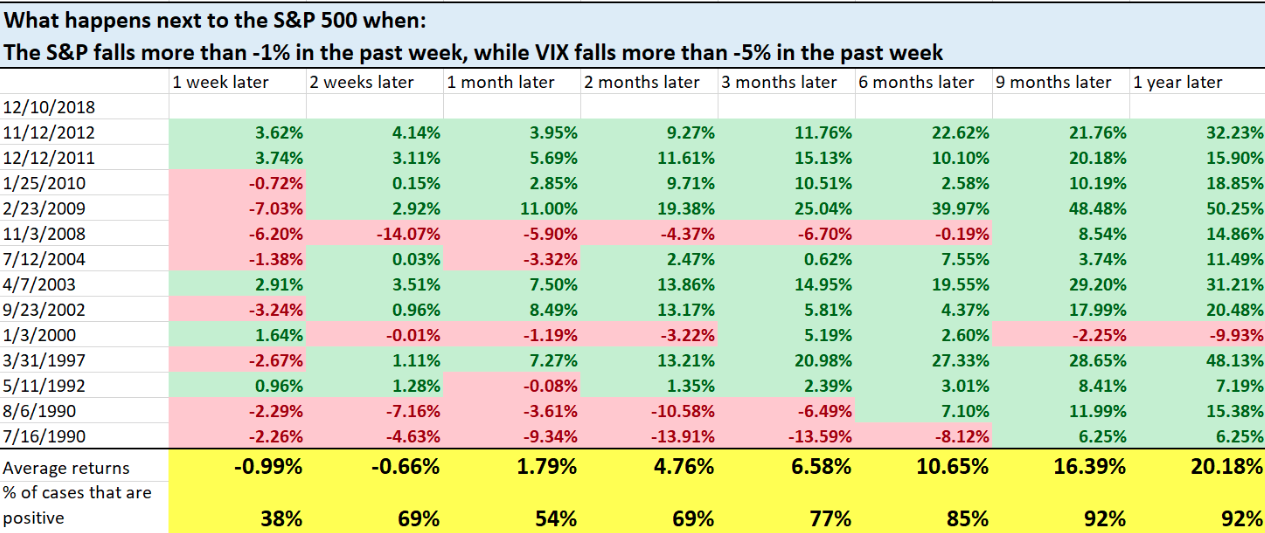
As we can see, the stock market tends to go up 6-12 months later, even if it does face short-term weakness over the next 1 week. Once again, this divergence is identifying just how controlled the sell-off in the overall market has been during the correction period and unlike that which we had seen from the February-April correction period, which further evidences the rise of algorithmic/quant trading programs.
There are several reasons for the VIX to have not been responding as most would anticipate with a near 12% correction from the peak level of 2,940 in September.
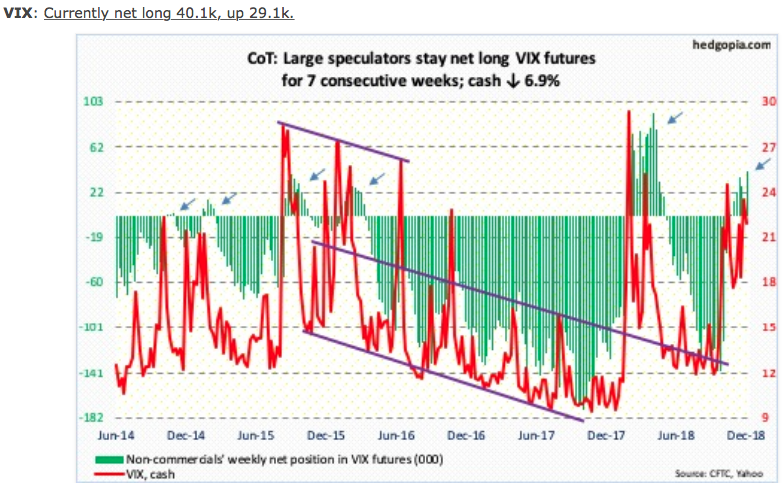
As shown in the chart of noncommercial net long VIX Futures interest, the trend of positioning long has lasted for nearly 2 months now. This indicates that the short-VOL normal positioning has been absent and many institutional traders have already deleveraged and protected their long portfolio positions.
Something else we are seeing in the way of hedging risk and buying protection via .SPX options also identifies that fund managers have greatly deleveraged themselves leading up to the October-present correction. Based on the following chart, there doesn’t seem to be a lot of demand for further-out-of-the-money, two-month put options on the S&P 500 or Nasdaq 100, relatively speaking.
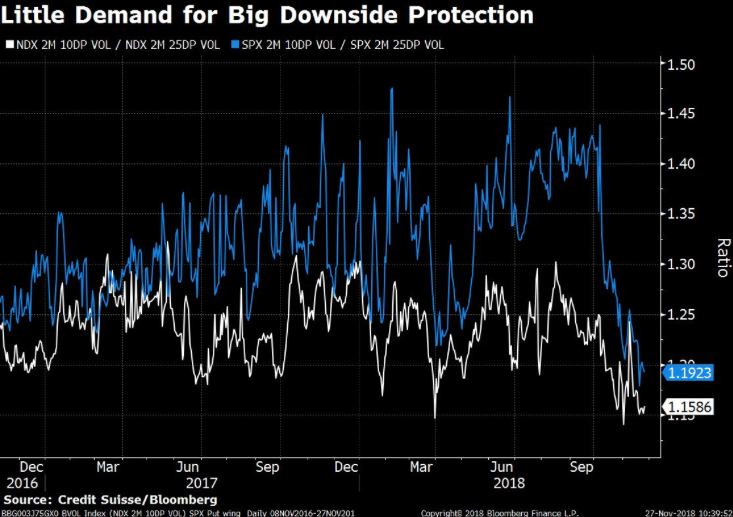
That chart is somewhat scary if you haven’t been following the VIX thoroughly and through the correction period. It either validates that fund managers have already deleveraged and therefore are in little need of downside protection, or they are simply negligent in their fiduciary duties to clients. We’re going to suggest it is the former and not the latter. Now let’s look at one last VIX table before moving on.
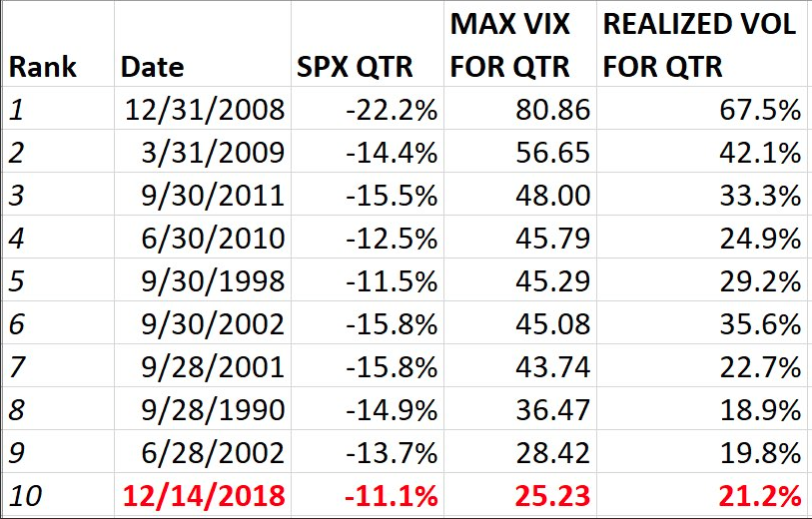
The table (from Matt Thompson) above is of the top 10 worst quarters for the S&P 500 since VIX’s inception in 1990, ranked by max VIX close during the quarter. Realized VOL is also included for comparison. As one can see from the table, this is the most complacent VIX in history using the said “worst quarters from the S&P 500 since VIX inception”.
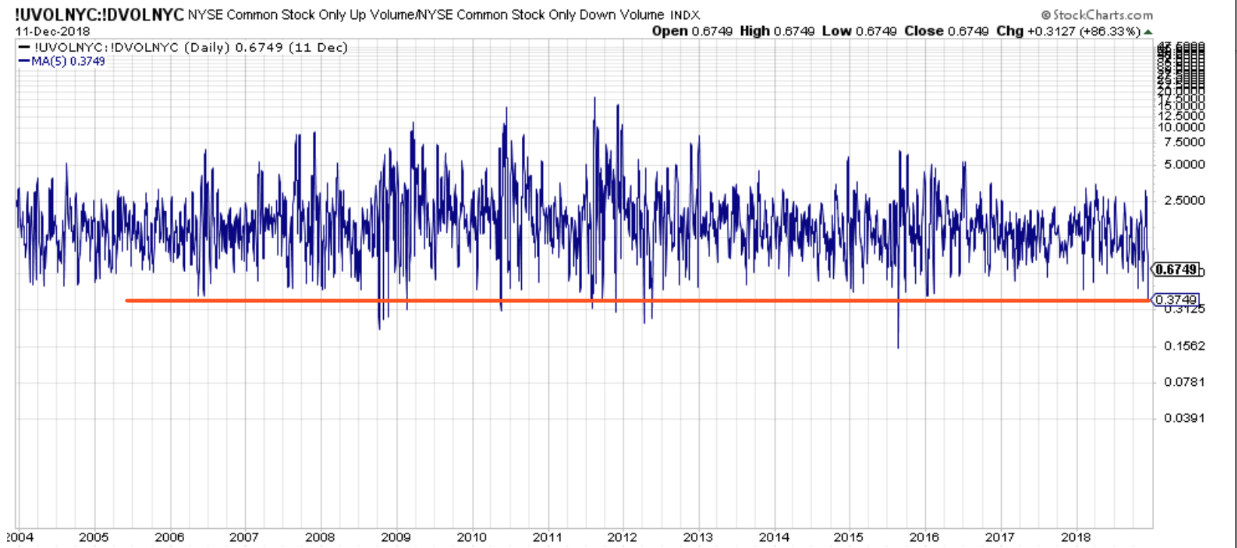
While protection hasn’t been the name of the game during the present correction period, the VIX has the ability to explode at any time as .SPX put option volume can come back into favor at any given market moment. With the S&P 500 having closed below the 2,600 level, what waits for investors on Monday morning when Wall Street opens could be very scary, benign or surprising altogether. What we most importantly are demonstrating through the factual representations of fund manager hedging activities and the VIX’s rather complacent divergence from the S&P 500 decline is that there is something vastly unique to this market correction period that aligns with the thesis suggesting the algos/machines have given rise and taken control of the downturn. Simply put, for the major averages to have such wild and wide intraday swings, volumes would show the involvement of human trading. We’ve seen the Dow (DJIA) whip back and forth nearly 900 points on 2 separate occasions during the correction period; human traders can’t perform such a feat of strength. When we look at total NYSE daily volume decay, it becomes clearer that humans aren’t at play during this correction period. The downward volume has become somewhat extreme. Here’s the 5-day moving average of the NYSE Up/Down Volume Ratio.
Given the S&P 500 weakness during the Q4 2018 period thus far (down over 10%), we think it only reasonable to take a look at historical occurrences for similar performance during the stated period. The S&P 500 is down more than 10% and has closed right at the bottom edge of the box we’ve identified in previous weekly research reports. (table from Bespoke Investment Group)
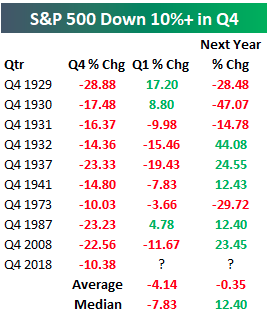
As shown in the table above, Q4 2018 is tracking to be just the 10th time since 1928 that the S&P 500 has fallen 10%+ in Q4. And unfortunately, when Q4s have been bad for the S&P 500, the following Q1s have been bad more often than not; this is not always the case, but more often than not it has been.
This market is not reacting as one would think it should, given the economic fundamental backdrop. Every piece of good earnings news is met with a sell-off and every piece of good economic data is equally treated with market declines. In short, the market has divorced itself from the fundamentals of the economy. The S&P is down over 10% for the quarter. With recent batches of economic data coming in better than expected, if GDP is roughly 3% for the Q4 period it would be the first time since 2010 that the economy grew by 3% and the S&P 500 fell at least 10% in the same quarter. It’s absurdity in the market place, which has resulted in a compression of the S&P 500 multiple. But you wouldn’t guess the market has performed so poorly by the fear gauge/VIX.
Economic Data Remains Strong
In the week that was, we saw a strong JOLTS Survey reported (over 7mm job openings), Jobless Claims plunge (down to 206K, near half-century low level) and stronger than expected monthly retail sales. In fact, this is very much what we expected from the consumer during the Q4 period. Recall what we offered from last week’s research reporting:
“October’s monthly retail sales surged higher by .8% MoM and by 4.6% year-over-year, blowing away expectations. Based on record setting Thanksgiving Thursday and Black Friday readings from Adobe Analytics, Finom Group is of the opinion that the .2% retail sales growth expectations for the month of November are low.”
In a consumer-driven economy, we desire to see a healthy consumer spending at a healthy rate of growth. That’s exactly what we saw in the latest reported November retail sales report. Retail sales increased 0.2% last month, led by online stores such and big-box stores the Commerce Department said. Most economists were expecting a rise of just .1 percent. If a big drop at gas stations is stripped out, retail sales rose a stronger 0.5%, the government said Friday.
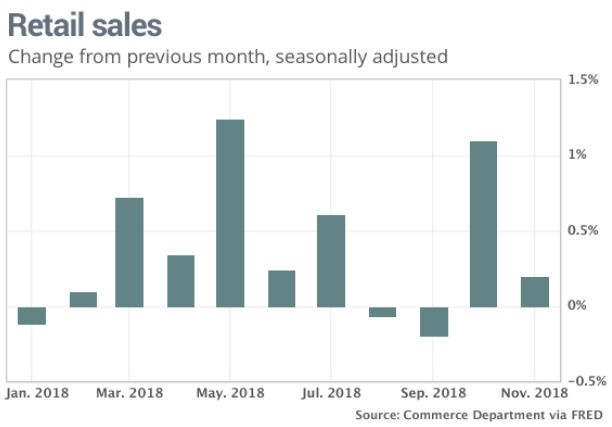
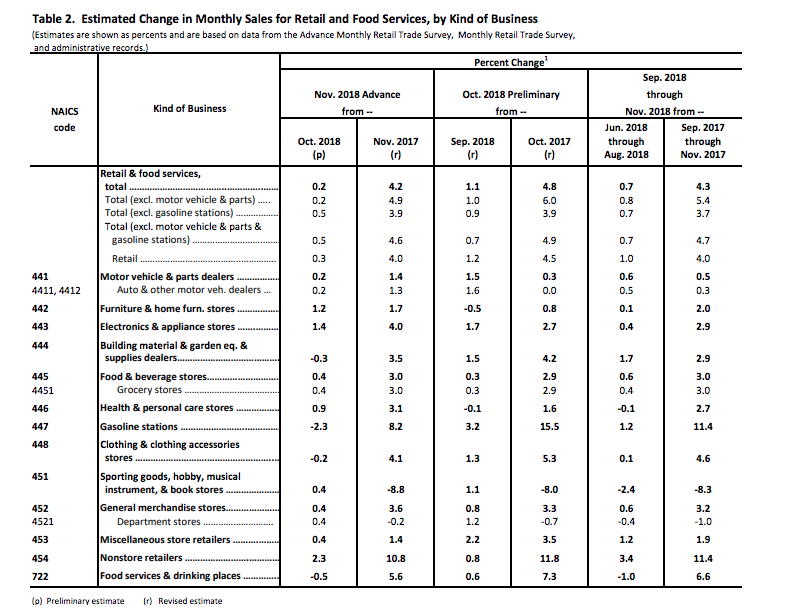
More importantly, the increase from sales in October was raised to 1.1% from 0.8%, suggesting the U.S. economy got off to an even stronger start in the fourth quarter than it initially seemed. As depicted in the table below from the Commerce Department, the strength from November’s retail sales was widespread. Yes, even autos rose both MoM and year-over-year, again.
“It is obvious that the economy is not falling apart nearly as quickly as the markets are implying,” said Neil Dutta, head of U.S. economics at Renaissance Macro Research. “Importantly, consumer confidence is strong, which indicates that strong employment and lower gas prices are offsetting the drop in equity markets.”
When we look at the key drivers of the market long-term we look at the economic data, which supports corporate earnings growth. Job growth remains strong, the consumer remains strong and inflation remains tamed. But the market has shrugged its shoulders nonetheless. Federated Investors’ Steve Chiavarone believes there’s nothing on the horizon that suggests the 2018 market corrections will become a massive downturn next year. Heck, even Goldman Sachs (typically bearish on the market outlook) doesn’t believe the market correction is correlating appropriately with economic conditions.
“The decline in U.S. stocks has opened up a rare divergence between the market’s performance and economic data, an indication that fears over a growth slowdown have gone too far, according to strategists led by David Kostin.” 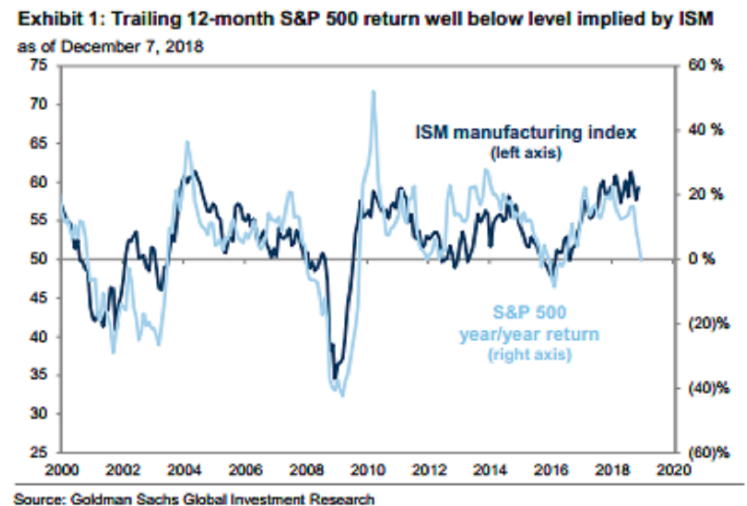
The S&P 500’s return over the last 12 months has turned negative for the first time since 2016, something that has historically corresponded to a reading of 50 in the Institute for Supply Management’s manufacturing index, or stagnant growth, Goldman data showed. By contrast, the factory gauge rose to 59.3 last month, a sign of healthy expansion. Simply put, the economic data does not fit with what the market has done and is doing year-to-date. Nobody worth their analytical salt believes this market correction has anything to do with the fundamentals of how a market typically performs. This is fear for the future, a future recession with the market itself being a forward pricing mechanism of such fears.
When we looked at the current market multiple and juxtapose it with a natural economic slowdown that is widely forecasted to take place in 2019, we still find the market terribly cheap. Once again, Goldman Sachs agrees. Based on Goldman’s model, the market is predicting zero growth for 2019. That contrasts with expected GDP growth of 2.5% next year, expected by the firm’s economists.
“Recent equity market performance implies a more dramatic slowdown than our baseline,” Goldman’s Kostin wrote in a note published late Friday. “Accordingly, we believe there is short-term upside to the S&P 500.”
Recall that just last week and prior to a slew of economic data reported in the week that was, the Atlanta Fed GDPNow forecast was indicating GDP growth of 2.4% for the Q4 2018 period. Let’s take a look at the update of GDPNow after the latest round of economic data.
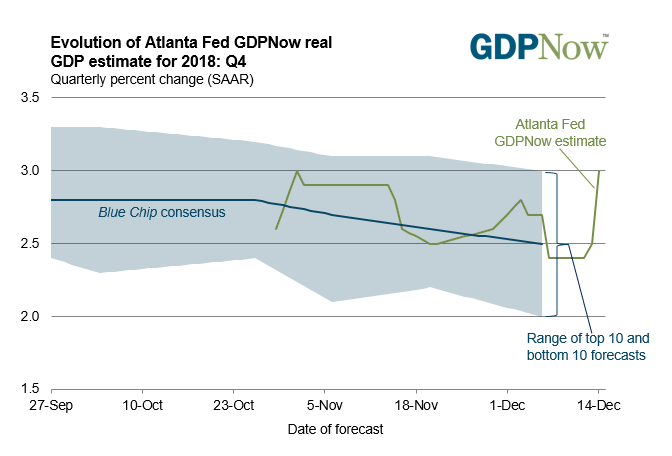
That’s a pretty big jump from the last week in GDP expectations. The GDPNow model estimate for real GDP growth (seasonally adjusted annual rate) in the fourth quarter of 2018 is 3.0% on December 14, up from 2.4% on December 7. The nowcast of fourth-quarter real personal consumption expenditures growth increased from 3.3% to 4.1% after this morning’s retail sales report from the U.S. Census Bureau and this morning’s industrial production release from the Federal Reserve Board of Governors. The economy is humming along folks, despite what the stock market is suggesting.
While U.S. economic data is undeniably strong, even strengthening in some respects, the Chinese economic data released last week poured cold water over the U.S. markets, as fears of global economic slowing had increased. The U.S. has bucked the global economic slowdown trend all year long, but still…
For The Week Ahead
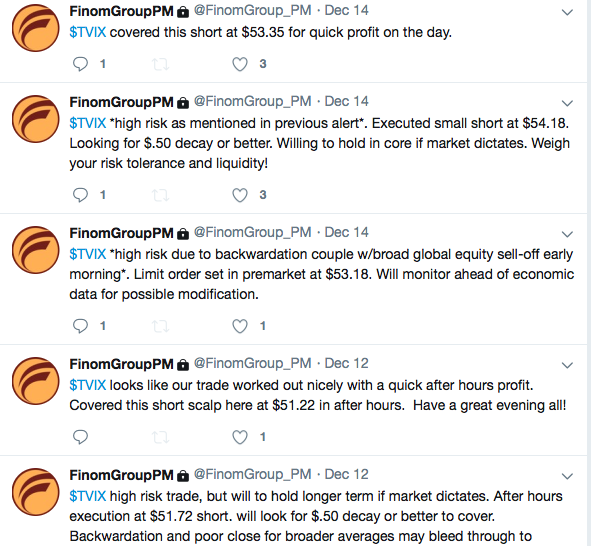
In truth, we don’t have a clear path forward and certain idea of how the market will perform in the coming week and as such Finom Group has been hedging over the last 3 weeks. Our trading activity has slowed to a crawl although we continue to look for opportunities, as demonstrated in the screenshot below. (Finom Group private Twitter feed scalp/swing trade alerts)
What we do know is that the S&P 500 weekly expected move for the coming week is $65/points. This is less than the $80+ expected move from the week that was.
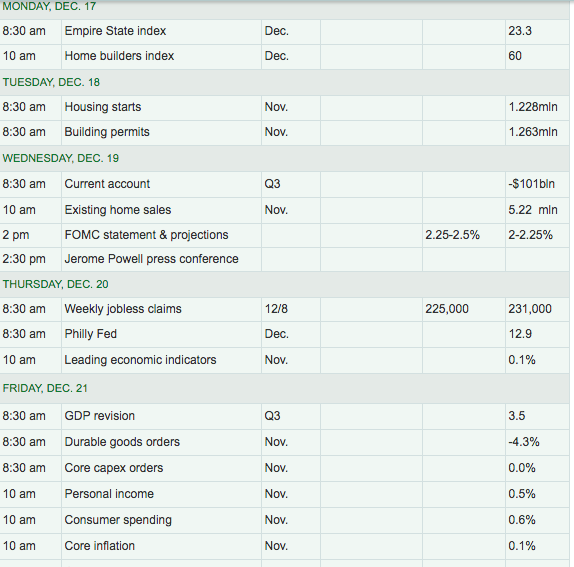
Last week was the 1st week in the last 4 weeks that the weekly move wasn’t breached by the end of the week. This may prove a sign of the market recapturing some semblance of efficiency, although with many issues developing in the coming week, we may not find a market efficiency trend developing. Option pricing has failed to measure the risk in the market during the correction period, making it extremely difficult to hedge and/or sell premium. Let’s now look at some of the expected highlights for the coming week:
- FOMC 2-day meeting and press conference. A .25 bps is widely expected. Most economists and analysts also expect the Fed to indicate a pause in rate hikes that is a result of the Fed being closer to the neutral rate than previously cited. Additionally, the Fed will signal its reliance on data.
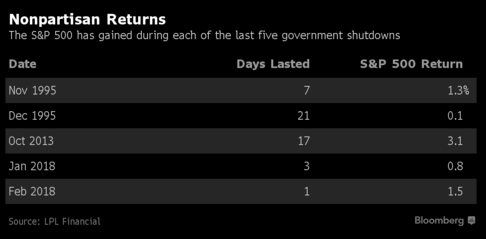
- Government shutdown looming: Two key points to keep in mind on this issue: Unlike the last shutdown (1/19 – 1/22/18), this is only a partial shutdown. While past performance is no guarantee of future results, the last 4 government shutdowns have resulted in market gains, not losses.
- Continued headlines surrounding U.S. President Donald Trump-Mueller investigation.
On top of these key issues that the market will be forced to grapple with in the coming week, the economic data calendar is rather heavy with Personal Income and Expenditures (PCE) rounding out the week.
Investor Takeaways
Finom Group is not of the opinion that a recession is in the cards for 2019, nor is a 2016-like earnings recession in the cards. While there remain headwinds for equities through the end of 2018 and into 2019, we don’t view these headwinds as recession-producing. Additionally, given the greater than 10% decline from the S&P 500 peak of 2,940 in September to current levels, we can appreciate that there may ultimately be another leg lower, to the February intraday lows of 2,530, before a more sustained market bounce takes hold. Given the risks associated with technical trading mechanisms defined within our report, we still believe hedging against or maintaining hedges against further downside is in play.
Based on significant equity market deleveraging that has already taken place, gamma risk remains to the upside longer-term and as gamma positioning itself is nearing the “end of its bearish rope”. More than $46 billion was redeemed from U.S. stock mutual funds and ETFs between Dec. 5 and 12, the largest weekly outflow since Lipper began tracking weekly flows in 1992.
Finom Group is also of the opinion that the FOMC 2-day meeting will lend clarity to markets and investors with regards to future rate hikes. Much of the market’s move since the FOMC’s last press conference and rate hike has largely priced in FOMC policy error in our opinion and any signs of clarity will be seen as bullish/risk on by investors. Having said that, initial market reactions to the FOMC don’t warrant increased market exposure until key market levels to the upside are breached.
There is nothing materially wrong with the U.S. economy, despite the S&P 500 YTD performance. Global macro-headwinds along with geopolitical headwinds have combined to increase the level of fear surrounding future corporate earnings, compressing the SPX multiple in much the same way it did from late 2015-2016. Back then and much like today, oil prices plunged and the yuan was steeply devalued. The same permabear rants that proliferated back then are present today. Having said that, the bears only found SPX marching higher thereafter and as earnings growth accelerated into 2017 and beyond. Get ready for a potential bounce in the coming weeks as the calendar year ends and begins a New!
For the holiday shortened week to come and in accordance with Finom Group’s year-end scheduling, this will mark the final weekly research report of 2018. Our daily market dispatch articles will still be published through year-end and if you have any questions, please feel free to contact us at support@finomgroup.com Following the Christmas Holiday, our next weekly research report will provide our outlook for the S&P 500 in 2019 alongside our volatility trading strategy.


