
It’s August 23rd, which means its tariff implementation day between the U.S. and China. A fresh bout of U.S. tariffs on $16 billion worth of Chinese imports commenced on Thursday, prompting Beijing to retaliate with its own tariffs on American goods worth the equivalent. The latest trade escalation comes as officials from the world’s two largest economies meet for tariff negotiations in Washington.
At 12.01 a.m. EDT on Thursday, the U.S. began collecting additional 25% duties on 279 Chinese import product categories. Key products that will be hit by the duties include semiconductors, chemicals, plastics, motorbikes and electric scooters. Beijing, of course, retaliated with its own fresh tariffs on $16 billion worth of additional imports from the U.S. including fuel, steel products, autos and medical equipment. So here is the bottom line with why negotiations have failed between the two nations to-date, “the tariffs are just too innocuous to move the needle!”
What many look at is the headline number and assume that is the value of the tariffs, $16 billion worth of tariffs. The reality is that $16 billion is just the value of the goods, but the tariff is only worth 25% of the identified value of the goods. In other words, 25% of $16 billion equals $4 billion in collectable tariffs. It might not even equate to one day’s work in China.
As it pertains to trade, however, the Fed is weighing the potential for trade to disrupt economic strength in the United States. Federal Reserve officials see ongoing global trade tensions as the biggest threat to otherwise strong U.S. economic growth, based on the latest Fed meeting minutes released on Wednesday. Minutes from the July 31-Aug. 1 Federal Open Market Committee meeting indicated that members remain fairly confident that the “strong” economic growth of late will continue at least over the near term. Officials said it would “likely soon be appropriate to take another step in removing policy accommodation. In laymen terms it means they will more than likely raise rates another .25 bps come September.
“Wide-ranging tariff increases would also reduce the purchasing power of U.S. households,” the minutes said. “Further negative effects in such a scenario could include reductions in productivity and disruptions of supply chains. Other downside risks cited included the possibility of a significant weakening in the housing sector, a sharp increase in oil prices, or a severe slowdown in [emerging market economies].”
FOMC officials stated, “An escalation in international trade disputes was a potentially consequential downside risk for real activity. Some participants suggested that, in the event of a major escalation in trade disputes, the complex nature of trade issues, including the entire range of their effects on output and inflation, presented a challenge in determining the appropriate monetary policy response.”
Moreover, Fed officials pointed out that business contacts said they have not yet cut back investment and spending but could do so if the trade issues are “not resolved soon.”
Companies in the S&P 500 Index reported a 24% YOY increase in capital spending in the second quarter, the fastest since 2011, according to Bank of America Merrill Lynch. More comprehensive government numbers paint a similar picture. Business investment rose by 11.5% in the first quarter of this year from the preceding period and 7.3% in the second. So when we review why the market has “yet to respond” to the threat and implementations of tariffs to-date, there simply hasn’t been the curtailment in capital or consumer spending to impact corporate profits. Corporate profits are the drivers for the market over time. If Q2 2018 GDP wasn’t validation of the limited impact on the already implemented tariffs…, well now!
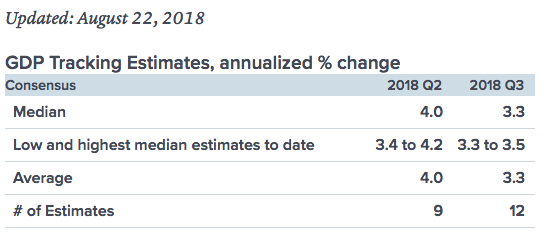
It’s true and a logical retort that the affects from tariffs may take some time to curtail economic activity, but with that in mind we review the current estimates for Q3 2018 GDP in the United States. The St. Louis Fed Nowcast expects 3.69% growth, which would be a continuation of the torrid pace in Q2. The NY Fed Nowcast was lowered from 2.57% to 2.39% on Friday as it continues its run of negativity. It was wrong in Q2 but that doesn’t mean it will be wrong in Q3. The biggest impacts on this estimate change came from housing starts and the Philly Fed index. The Atlanta Fed GDP Nowcast expects 4.3% growth, making it the most optimistic. As of August 15th, the Q3 estimate from the CNBC rapid update shows the average of 12 estimates expect 3.3% GDP growth.
In a consumer driven economy, consumer spending and retail sales outline the strength of the economy. Winding down the Q2 2018 earnings season, retailers have come out with spectacular results for the most recently ended quarter. Target (TGT) followed this trend with its most recently announced quarterly results. In Finom Group’s daily market dispatch Wednesday and prior to the release of Target’s results, here is what we offered in our analysis:
“Target shares have retraced gains in 4 of the last 5 reporting periods and on the day of reporting quarterly results. Having said that, the company and stock are set up nicely for a breakout, in kind with the breakout witnessed yesterday by T.J. Maxx (TJX). The company maintained its FY18 guidance after its Q1 2018 results and if Wal-Mart, Kohl’s (KSS) and Macy’s (M) Q2 reporting is any guide for Target, the company may be poised to report results ahead of analysts’ estimates and a boost to its FY18 guidance. Recall, it wasn’t until Q2 of 2017 that the company boosted its FY17 guidance.”
And that is exactly what happened, Target beat on both the top and bottom line and boosted its FY guidance. Target shares closed up 3.2% on Wednesday after the retailer reported a 7% revenue increase, to $17.55 billion for the quarter; traffic growth of 6.4%, the strongest since it began reporting the metric in 2008; and same-store-sales growth of 6.5%, the biggest percentage gain from a year-earlier quarter in 13 years.
“The elevated experience at both newer and refurbished shops is driving both customer traffic and conversions, which is one of the reasons why shops contributed 4.9 percentage-points to comparable sales growth,” said Neil Saunders, managing director of GlobalData Retail. “In essence, Target has given people reasons to come and visit and is encouraging them to spend when they do.”
As it pertains to the consumer and consumer spending, here is what Target’s CEO Brian Cornell had to offer on the company’s conference call with analysts and investors:
“There’s no doubt that, like others, we’re currently benefiting from a very strong consumer environment, perhaps the strongest I’ve seen in my career.”

With solid results in the Q2 2018 period and already half of the Q3 2018 period in the books, Target raised its FY18 guidance. The retailer now sees 2018 adjusted EPS outlook of $5.30 to $5.50 from $5.15 to $5.45.
“Longest bull market ever!” This is still the rhetoric of the week in the media and as the S&P 500 continues to attempt a new closing all-time high and with a fantastic S&P 500 Q2 2018 earnings season in the rear view mirror. Something else that we’re hearing a lot about in recent weeks is that “the stock market today is as overvalued as it was in 2000 and at the top of the dot-com bubble”.
Quick understanding of how markets are valued. Markets are valued against or correlated to earnings, not sales! Anybody choosing to value the market against sales is simply choosing to break from the norm and align a biased narrative.
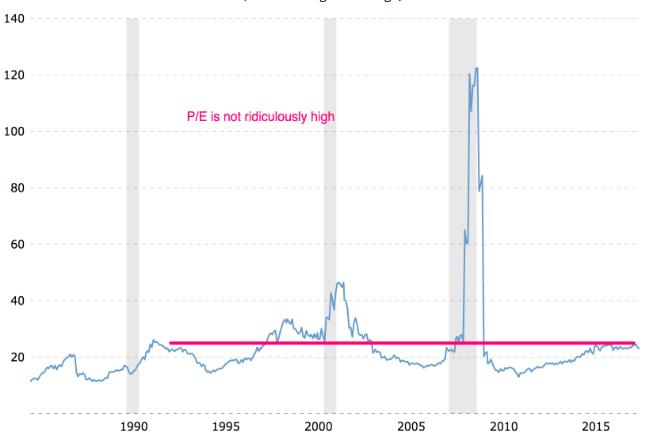
As shown in the chart above, while the current price-to-sales ratio of the S&P 500 has surpassed its 2000/dot-com peak level, the price-to-earnings ratio is less than the dot-com period. Far less than the dot-com period in fact. Unfortunately, this reality is not what permabears and market pundits find palatable or favorable with regards to their bias.
The questions investors should be asking themselves with regards to valuing the market are related to historical valuations. At present and according to FactSet, The forward 12-month P/E ratio for the S&P 500 is 16.6. This P/E ratio is above the 5-year average (16.2) and above the 10-year average (14.4).
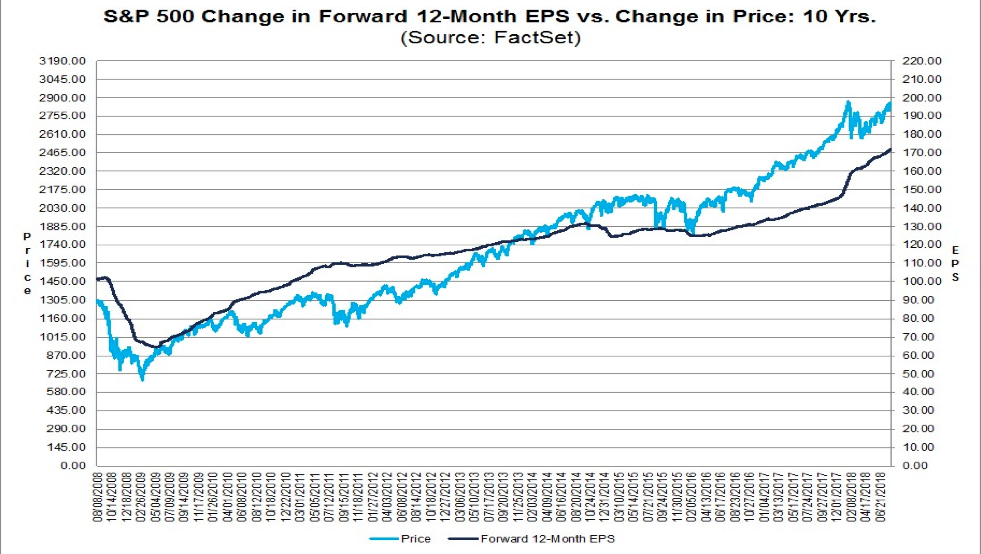
The chart above indicates what drives the market, earnings. As earnings grow, the “price” of the market grows. Given the current valuations and the notion that valuations are forward looking, the S&P 500 may at best be fully valued. The problem for permabears that may be hoping for a market crash is that projected earnings for the balance of the year are expected to grow in the 20% range. Additionally, S&P 500 earnings are still projected to grow double digits in 2019. As such and barring any unforeseeable macro-economic impact on the economy, the bull market is likely to carry forward and into 2019. This is not to say another market correction can’t be found along the way, but as earnings trend higher, the market is likely to trend higher over time.


