
As U.S./China talks were being held during the day in Washington, investors were found less optimistic about these talks and with the major averages all falling on the trading day. The Dow lost .3% on the day while the S&P 500 and Nasdaq lost .17% and .13% respectively. Volatility was slightly higher in a back and forth trade that ultimately resulted in risk-off and with bond yields somewhat flattening further.
The 10-year Treasury note yield was mostly flat at 2.821%, hovering near its lowest since May 29, while the shorter 2-year note yield rose 1.4 basis points to 2.610%. Bond prices move in the opposite direction of yields. The yield gap between the 2-year and the 10-year note narrowed 1.6 basis points to 21.1 basis points, or 0.211 percentage point, its tightest since August 2007. A flattening yield curve can signal growth fears, but also expectations for tighter monetary policy in the future.
At Jackson Hole, Fed Chairman Jerome Powell’s Friday speech is expected to be the highlight, with investors hoping for more clarity on the central bank’s monetary path and the potential impact on emerging markets. Investors will be looking for signs of what would derail the central bank’s commitment to a gradual rate-hike path, amid the growing downside risks, including trade tensions.
Kansas City Fed President Esther George said she supports two more rate increases this year. Dallas Fed President Robert Kaplan said he was hopeful the central bank could hit the neutral rate, where interest rates neither speed up nor slow down the economy, without inverting the yield curve.
With bond yields flattening and somewhat creating concerns for equity investors, let’s take a look at one of the more concentrated equity groupings, FANG. According to data from Goldman Sachs, mutual funds have been reducing their exposure to the so-called FANG group of stocks.
“The collapse in FB’s stock price in July would have boosted mutual fund performance given their underweight exposure to the stock,” Goldman wrote in a note to clients.”
According to Goldman Sachs, overall, funds are underweight the FANG group by 75 basis points; at the start of the second quarter, they were underweight by 56 basis points. Much of that increase reflects a move away from Amazon. Fund managers are, on average, underweight the e-commerce giant by 47 basis points, compared with 38 basis points at the start of the second quarter. Separately, while managers are more overweight on Alphabet, the degree to which they are lessened over the quarter. Currently, they’re overweight Google’s parent by 11 basis points, compared with 19 at the start of the second quarter.

Overall, mutual funds trimmed how overweight they are on the technology sector by 11 basis points over the second quarter. For consumer-discretionary stocks, the overweight allocation dropped by 6 basis points. Financial stocks saw a more significant drop in allocation. On average, funds cut their overweight exposure on the sector by 107 basis points.
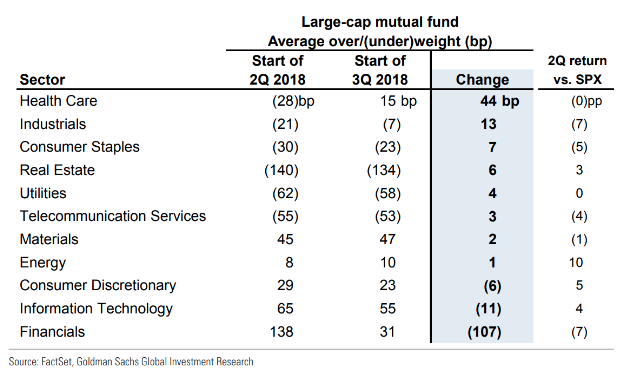
On the other end of the spectrum, funds turned overweight on health-care stocks, and now have an allocation to the group that 15 basis points larger than the market. That’s up 44 basis points from the start of the second quarter.
While FANG witnessed a great deal of outflows over the last 12 months and underweighting continue, with respect to funds, the money must go somewhere. As such, let’s see where some of this money has been going over the last few months.
Global equities have seen a good deal of outflows in recent weeks as geopolitical tensions mount. Investors pulled money from both stock and bond funds in the past week, and piled that into U.S. equities from safe sectors. Per Bank of America Merrill Lynch, about $3.6 billion was pulled out from equity mutual funds and ETFs, of which $2.6 billion was U.S. equities.
Thanks to rising rate concerns, investors had to dump government debt. Per CNBC, there were net outflows of $1.5 billion from Treasuries and government bonds marking “the biggest since December 2016.” Investors also got rid of gold, which is down $500 million due to a jump in the U.S. dollar. Nonetheless, all this money has to find a home, as stated previously.
All these outflows occurred when monthly fund managers’ survey indicated the biggest U.S. equity overweight since January 2015, as quoted on CNBC. According to Bank of American Merrill Lynch (BofA), some sectors scored high in the past three months, in terms of inflows and all of those were defensive sectors of the U.S. equity market.
- Health-care stocks/fund (XLV): inflows of $800 million, leading the sector to see a total of $5.5 billion in inflows for the past three months. The fund amassed about $872.20 million in assets and was up about 9% past three months (as of Aug 17, 2018).
- Consumer Staples (XLP): inflows of about $1.15 billion in assets in the past two months (as of Aug 17, 20218). The fund has been up 10.7% in the past three months.
- Utilities Select Sector SPDR ETF (XLU): inflows of about $420.04 million in assets in the past two months (as of Aug 17, 2018). The fund is also known for high yields. The fund has added about 10.7% in the past three months.
The market being as forward looking at is it invites investors to participate in kind. August, thus far, has proven a better month for the market than historically indicated and surprisingly so. Given rising trade tensions, scandal and uncertainty surrounding the White House and emerging market concerns, the U.S. equity markets have proven remarkably resilient. But that resiliency will be put to the test come September. With only one more trading week left in August, investors will turn their attention to September positioning.
Since its inception in 1928, the S&P 500 has finished lower in September more than any other month, or 55% of the time for an average return of negative 1.01%, according to Dow Jones Data Group. Since 1896, when the Dow Jones Industrial Average was created, the Dow has lost an average of 1.03% in September. That compares to an average gain of 0.76% across all other months of the calendar.

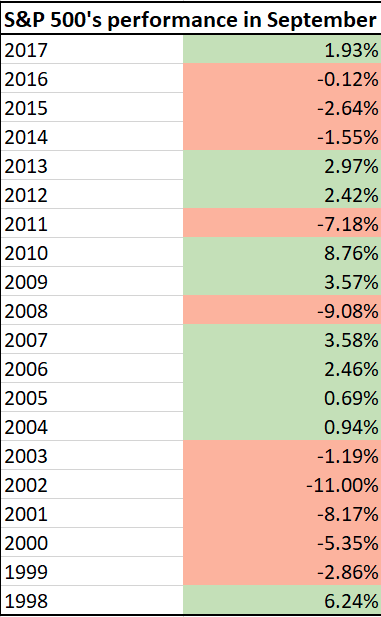
Much of September’s poor performance record can be attributed to seasonality, with investors slow to return from summer vacations, resulting in low trading volumes. Additionally, many mutual funds have fiscal years that end on Sep. 30, leading them to engage in window-dressing during the month. Volatility also tends to be higher in the month of September, albeit less volatile than August. Having said that, as we edge closer to mid-term elections, volatility may prove to be higher than this August 2018. Below is a chart of the S&P 500 September performance over the last 20 years as provided by bullmarkets.com.
Seasonality and a confluence of geopolitical and U.S.-administration concerns may prove a headwind for the major indices in September. Shortly thereafter, however, equities should resume their alignment with corporate earnings that are expected to grow roughly 20% in both Q3 and Q4.
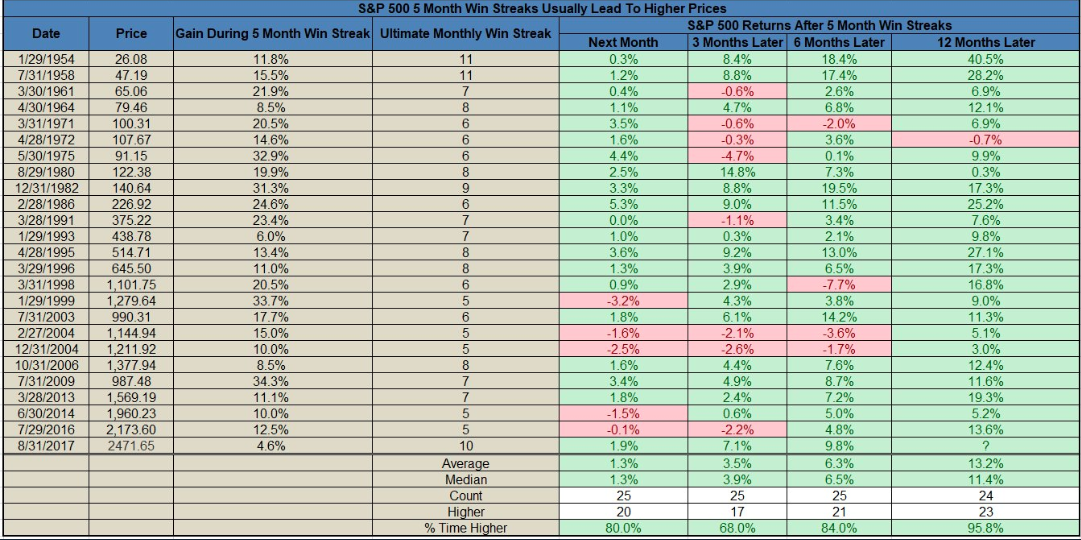
The more important consideration is the long-term trend for U.S. equities and history suggests the market should trend higher given the economies fundamental strength. Also, history shows that after the S&P has a 5-month win streak, it is nearly always higher 12 months later. In fact, since 1950, 23 out of 24 times it was higher, as reported by LPL Financial. Although the month isn’t over yet, there is a 5-month win streak through August.
Given the factors surrounding central bank tightening, equity outflows, geopolitical tensions and pending seasonality, investors might consider rebalancing their portfolio near term, but in keeping with a longer term vision for the markets.


