
Past the midway point in the trading week and the major averages have bounced back from consistent selling in the previous week and what many thought may prove a period of continued market consolidation and/or retrenching. Even with Boeing (BA), the most heavily price-weighted stock on the Dow Jones Industrial Average (DOW), proving a major headwind, the index is higher week-to-date and finished up .58% on Wednesday. The S&P 500 (SPX) and Nasdaq (NDX) both finished .69% higher on Wednesday as well.
The rally in equities continues, even with a rally in bonds, which finds yields lower YOY. The 10-year Treasury yield (TNX) ticked higher Wednesday but is still hovering near lows not seen since January 2018. Additionally, the typical inverse relationship between bond yields and equity prices has continued for a longer period than most investors would care to see. We can review the divergence in the chart comparison of 10-year Treasury yield and S&P 500 below. The divergence has persisted since the onset of the equity market rally in the New Year.
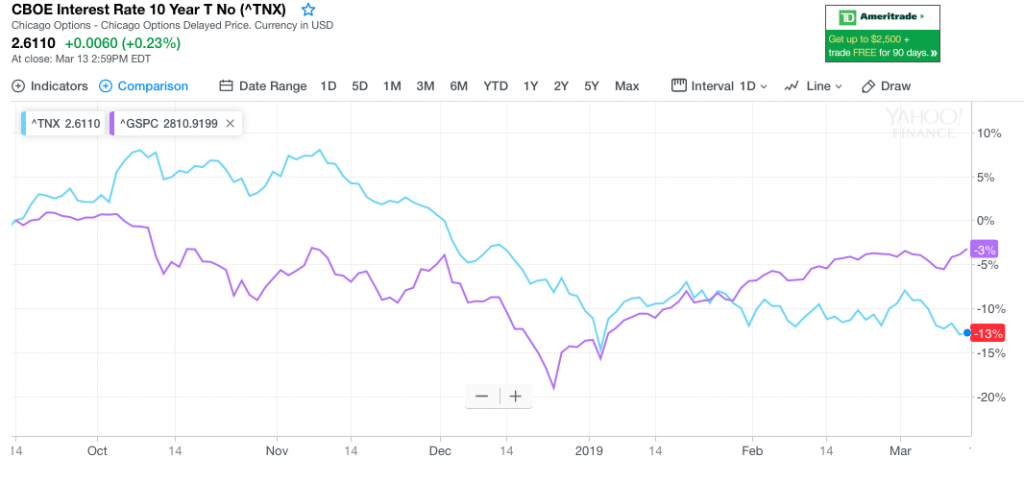
The breadth of the investor and analyst community suggests that the current divergence in correlation will likely prove negative for stocks. But when…
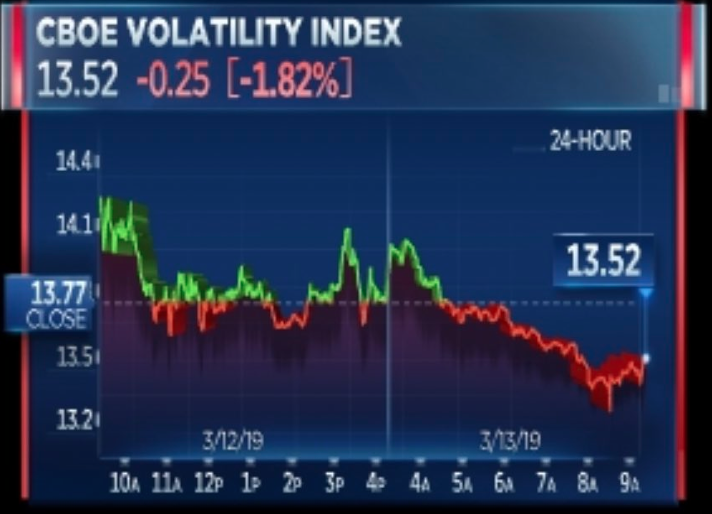
With the equity market bounce back this week, complacency has crept back into the market, as gauged by the VIX. The so-called fear gauge fell to a 5-month low during Wednesday’s trade, finishing the day at 13.41. Just over 1.2 million VIX options contracts traded on the day.
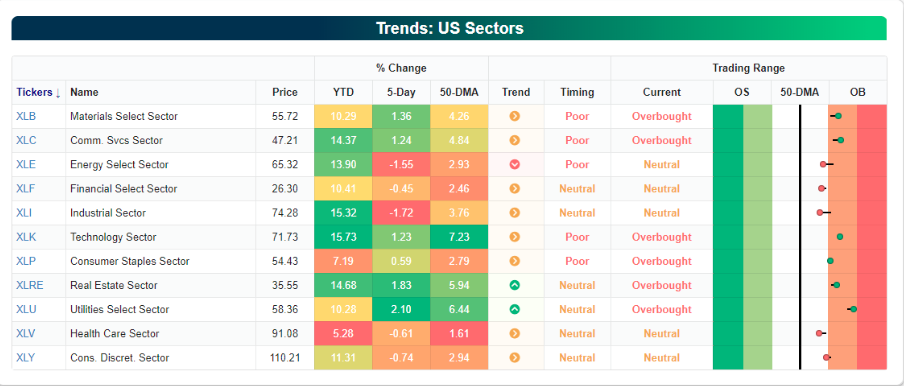
In terms of market breadth, its pretty much split down the middle with respect to index ETF breadth. Half of the major index ETFs are Overbought while the other half are still Neutral. On a sector basis, Utilities are approaching extremely Overbought levels.
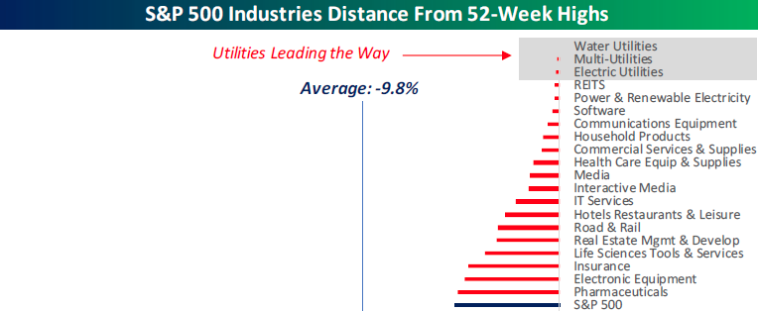
Based on the lack of volume and hedge fund positioning throughout the market rally leaning defensively and with limited exposure to cyclicals, it probably comes as no surprise where individual stock groups stand relative to their highs. Just as the Utilities sector is the most overbought sector, groups within the sector recently hit 52-week highs. As shown below, Water, Multi, and Electric Utilities all hit 52-week highs on Tuesday and closed out the session less than 1% from those highs.
There’s no viable way to sugarcoat this market rally and to suggest it shows itself to be a healthy one would require a strong bias. Nonetheless, when the algorithms take hold they can prove to push a rally or decline further than many think possible, seeking out levels as they navigate capital in and out of sectors. And speaking of capital flows, last week found ETFs with another week of outflows.
- ETFs suffered net outflows of $4.1 billion for the week, driven by taxable bond ETFs (-$2.6 billion) and equity ETFs (-$1.6 billion). Municipal debt ETFs had net positive flows of $85 million for the week. For taxable bond ETFs, the largest net outflows belonged to iShares iBoxx $ High Yield Corporate Bond ETF (HYG, -$1.4 billion) and iShares 20+ Year Treasury Bond ETF (TLT, -$541 million), while for equity ETFs SPDR Gold ETF (GLD, -$899 million) and iShares Russell 2000 ETF (IWM, -$787 million) were hit the hardest.
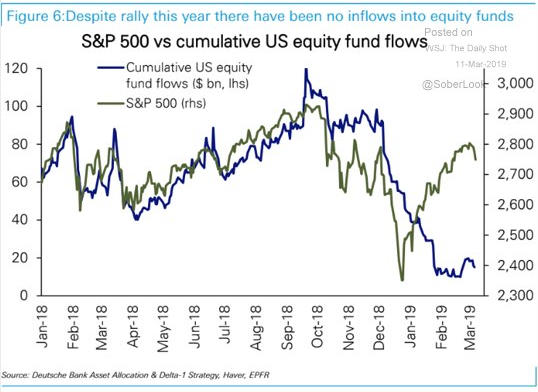
As depicted in the chart above, fund flows have been negative on the whole and for the totality of the 2019 market rally. But light equity positioning and light volume have benefited a market that may have proven to overreact to a period of earnings uncertainty, an FOMC that was over tightening and too hawkish and a global economic slowdown. J.P. Morgan Chase’s (JPM) quant team recently offered an update on their market outlook with detailed analysis of equity positioning among CTAs and what is affecting market positioning.
“Equity positioning is still relatively light across discretionary and systematic portfolios (~30th percentile) while retail saw outflows until late Feb. This implies most investors have not participated in this V-shaped recovery other than corporates and insiders who were accelerating purchases into the sell-off. Buyback activity remains elevated and so far in-line with 2018, which was a record year (see Buyback report). While the market is increasingly pricing-in a US/China trade deal, based on our discussion with investors, many still remain on the sideline waiting for a confirmation (given multiple false- positives thus far) before repositioning their portfolios. The Fed is signaling a more accommodative stance and China fiscal policy is turning more supportive. This backdrop should continue to favor risky assets and help reaccelerate the global business cycle. As noted in our Global Style Investing report, our fast moving business cycle indicator is suggesting a bottoming in US activity while the EM cycle indicator is already recovering. For these reasons, the upside equity pain-trade should continue. We reiterate our S&P 500 price target of 3,000, and maintain our pro- cyclical sector stance (Tech, Industrials, C. Disc, Energy).
In our view, the expected margin compression is less related to late-cycle dynamics (i.e. falling demand, rising input costs, declining pricing power), but more driven by tariff related drags, poor trading environment for Financials, and certain company/industry specific factors that could ultimately prove to be temporary (e.g. Commodities, Semis, Apple, Facebook, Real Estate, etc.). The current environment is turning more reflationary and should be broadly supportive for margins in the coming quarters given expanding labor market, easing financing conditions, rising commodities prices, and lower USD. This should drive above-trend revenue growth of 4-5% and roughly flat margins, which combined with strong buyback activity supports our view for 6-7% EPS growth for this year. This stands in contrast to 2015/2016 earnings recession (when EPS compressed by -3%) that many are comparing the current environment to. We expect the trade-sensitive sectors that have seen sharp revisions (Tech, Industrials, Energy/Materials, see Figure 17) to deliver strong upside surprises given our ongoing assumption of a trade deal and/or stable to lower USD.”
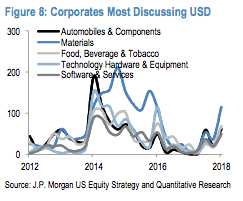
The Quant team also offered key company themes and trends based on textual analysis of 25,000+ corporate transcripts. Of particular interest was the recent 4Q18 corporate and investor commentary related to tariff impact, input costs, and investment spending activities. Below are key takeaways:
- Tariffs remain a key concern for US corporates though there has been a noticeable tick down in focus during Q&A sessions suggesting investors are now better versed on this risk.
- Input costs are a concern for trade sensitive industries; local producers are benefiting from lower commodity prices (i.e. Staples). While input costs remain a key topic for US corporates in aggregate, the fears transitioned from passing down commodity related inflation (e.g., transportation, energy prices, raw materials) to trade and tariff related costs.
- Contrary to popular investor narrative, fewer S&P 500 companies are highlighting rising wages as a risk. Labor-intensive industries (typically less specialized workers) remain concerned about the tightening labor market. On the other hand, sectors that employ a more skilled workforce less frequently discussed labor and wages in company reports. Since the latter makes up ~60% of S&P 500 market cap (and growing), the expanding labor market should be a net positive for S&P 500 profits through rising demand/revenue, which should more than offset wage pressures at this point in the cycle.
“Capital Spending and Shareholder Return should remain robust in 2019. The deceleration
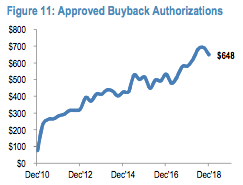
in EPS growth (from ~10% ex Tax Act growth to 6-7% this year) is not material to create a negative feedback loop for corporate spending. In fact, the latest GDP report supports this view with investments in equipment growing by 7% and IP by 13% during 4Q even as corporates faced elevated market volatility and policy uncertainty. Also, US corporates remain flush with profits as net income margin has steadily risen over the cycle to a record high of ~12% (vs. 9.3% seen at prior cycle peak in 2007). While corporates should continue to reinvest at a robust pace in capex and R&D (S&P 500 already reinvests ~50% of operating cash flow), we believe corporates will remain partial to buybacks given the strong profitability and excess cash.
New buyback announcements remain strong YTD at $187b (in-line with 2018, which was a record year) and we expect another $600b+ of buybacks for remainder of 2019.
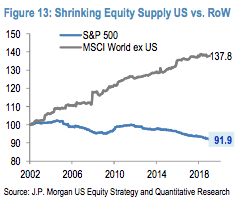
This should drive EPS growth of ~2.5% and will remain a significant technical support for US equities. As shown in Figure 13, the buyback theme is unique to the US with equity supply shrinking to levels last seen in late 1990s, while equity supply
for Rest of the World is hovering near record level due net issuance. Despite growing pipeline for IPOs and secondary offerings, we expect buyback demand for shares to remain multiples of new issuance supply.”
J.P. Morgan Chase’s market analysis and outlook remain positive and somewhat in contrast to that of Goldman Sach’s commentary on share repurchase programs. According to Goldman, if EPS trends decline, buybacks should follow.
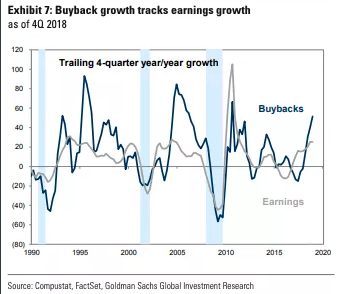
The problem with the simplicity of Goldman’s chart is that it doesn’t include a period of such significant net margin performance over the last few years and with 2018’s margins proving their highest of the expansion cycle. Additionally, corporations have never been flush with so much cash either from improved margin performance or the repatriation of billions of dollars in 2018 and post the Tax Reform legislation. These considerations are very much detailed within the J.P. Morgan Chase notes and simply can’t be confused for the simplicity of retrospect in the Goldman Sach’s chart. Lastly, the bulk of annual buyback programs are highly concentrated, not found from specific corporations in the past and therefor also don’t lend well to the Goldman Sach’s chart. Think of when Apple Inc. (AAPL) and Alphabet (GOOGL) began there respective share repurchase program folks. Do they fit into this thesis offered by Goldman Sachs, given the chart’s time frame and historic context?
While the market rally finds a period of slight continuation in the current week, the economic data continues with its mixed performance results. Wednesday’s key data point, given that all other inflation-centric reports (CPI and PPI) proved innocuous, was Durable Goods orders.
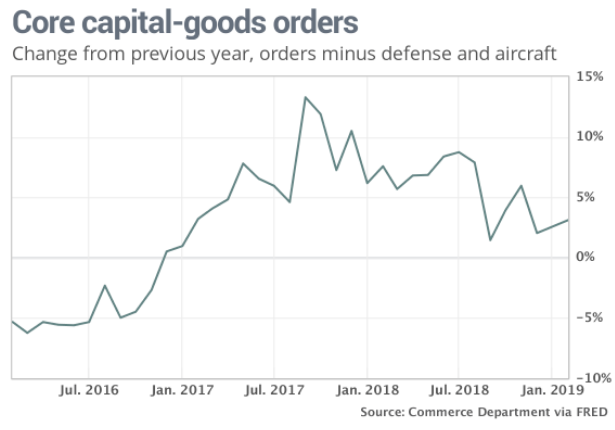
New orders for manufactured durable goods in January increased $0.9 billion or 0.4 percent to $255.3 billion, the U.S. Census Bureau announced today. This increase, up three consecutive months, followed a 1.3 percent December increase. Excluding transportation, new orders decreased 0.1 percent. Excluding defense, new orders increased 0.7 percent. Transportation equipment, up five of the last six months, drove the increase, $1.0 billion or 1.2 percent to $90.9 billion.
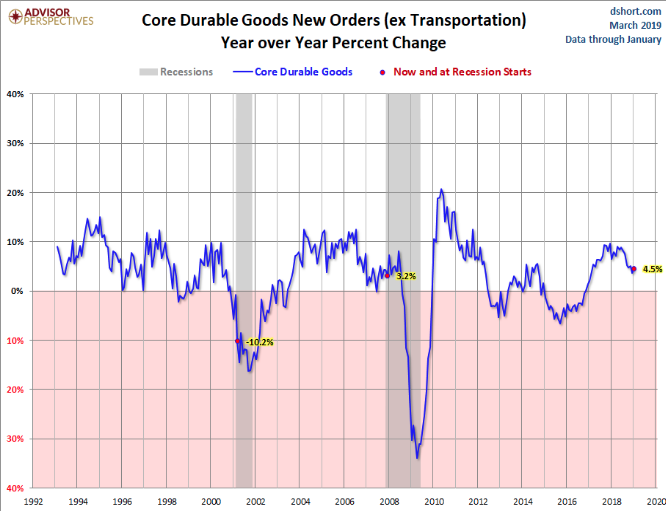
Companies pared investment toward the end of the year as interest rates rose and ongoing trade dispute with China disrupted supply chains and business planning. The yearly rate of investment rose slightly to 4.1% in January, but it’s down sharply from recent peak of 13 percent. The next chart shows the year-over-year percent change in Core Durable Goods (i.e., excluding transportation).
Equity futures are pointing to a modestly higher open on Wall Street as headlines continue to roll in for the likes of Boeing and Facebook (FB). Facebook shares are under pressure in the pre-market as the online social/media platform suffered from outages on Wednesday and is possibly offering refunds to its core advertisers and brand promoters. In addition to the headlines over the outages, a recent New York Times story details the ongoing criminal investigation into the company’s data deals with some smartphone manufacturers. Facebook has already recognized the investigation both publicly and in quarterly filings.
*Finom Group subscribers, stay tuned for the release of our weekly State of the Markets (SOTM) video this evening. Our readers and visitors are welcome to subscribe and access our wealth of weekly content that includes daily articles and weekly Research Reports as well as Trade Alerts and our newly instituted Trading Room!


