
Some things never change. That’s why they call them permabears! Jeffrey Gundlach was available and ready to declare, yet again, his bear market call and characterization of the market. It’s an annual ritual for Gundlach, the CEO of Double Line Capital.
“The stock market was and still is in a bear market. Stocks could go negative again in 2019.
Based on history, Gundlach has never called a recession or a bear market; he’s simply permanently heralding a recession and a bear market. And eventually, as long as he keeps it up, he’ll be right at some point. With that resilience, one doesn’t have to be uber intelligent; they simply have to be uber persistent.
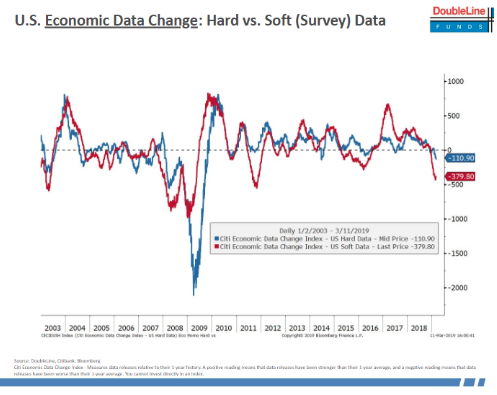
In Gundlach’s recent webcast, he highlighted the deteriorating hard and soft data and the collapse in December retail sales.
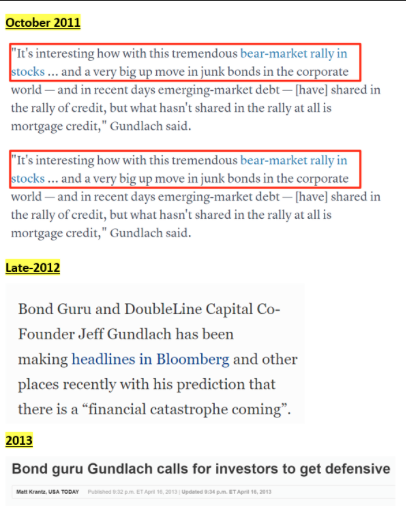
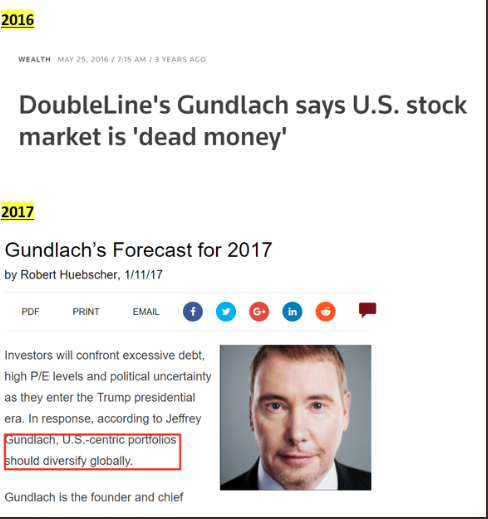
We’ve no doubt that Gundlach is an intelligent investor, but his market calls have been extremely poor throughout history as a bond investor. And when he decides to dip into equities, volatility or commodities, his calls have been equally poor. Below are his dire warnings that almost literally occur on an annual basis.
And speaking of Gundlachs commodity call for last year; Gundlach’s most recent market/investing call came in December 2017, forecasting out to 2018.
“DoubleLine CEO Jeffrey Gundlach said Wednesday on CNBC’s “Halftime Report” that his best investment idea for the new year is commodities, such as oil and gold. You go into these massive cycles,” he said. “The repetition of this is almost eerie. And so if you look at that chart the value in commodities is, historically, exactly where you want it to be a buy.”
To be clear, a recession or bear market can occur for any number of reasons and at any time. Having said that, when a trader or investors sees these types of warnings and or commentary from a noted industry veteran, they should look a little deeper; that’s all we’re saying really.
Regardless of Gundlach’s posturing and market calls, the S&P 500 rose once again on Tuesday. With Tuesday’s move the S&P 500 has now breached the weekly expected move, one that consists of a triple witching event.
The Dow Jones Industrial Average finished down 96.22 points, or 0.38%, to 25,554, while the Nasdaq was up 0.44 percent on the day. As Monday proved to find the Dow impacted by Boeing’s (BA) fatal plane crash, Tuesday’s trade was also impacted to one degree or another as shares of Boeing fell once again. Boeing is the most heavily price weighted stock on the Dow.
The United Kingdom, Singapore and Australia have joined China and other countries in banning the Boeing 737 MAX 8 from landing and taking off from their airports following Sunday’s fatal crash of one of the aircraft in Ethiopia. It was the second fatal crash of the recently introduced model in six months.
Nearly 40% of the in-service fleet of 371 Boeing 737 MAX jets globally has been grounded, according to industry publication Flightglobal, including 97 jets in China, the biggest market, Reuters reported. The USA is the second largest MAX market, with 72 aircraft in service, Flightglobal reported. U.S. Senators Dianne Feinstein, D-CA, and Richard Blumenthal, D-CT, called for all Boeing 737 MAX 8 planes to be grounded until the aircraft’s safety could be ensured. The Federal Aviation Administration issued a certificate of continued airworthiness for the planes late Monday.
Secondarily, equity investors were on pins and needles awaiting the latest Brexit Vote that was revealed late in the trading day Tuesday. It was widely expected for the vote to fail, but to what degree was the unknown. U.K. lawmakers rejected the deal again on Tuesday evening by 149 votes, despite some latch-minute assurances from the EU, which May had achieved in Strasbourg earlier in the week.
The route forward is still extremely uncertain but May has already promised two more votes for the U.K. Parliament. On Wednesday and Thursday, respectively, lawmakers will get to vote on whether the U.K. should leave the 28-member bloc with no deal, or should request a delay to its departure, which is currently scheduled for March 29. May confirmed that these votes would go ahead just seconds after her deal was overwhelmingly rejected for a second time.
The bigger piece of economic data delivered on Tuesday came in the form of consumer prices. The consumer price index climbed 0.2% in February following three straight months of no change, the government said Tuesday. That matched the forecast of economists polled by MarketWatch.
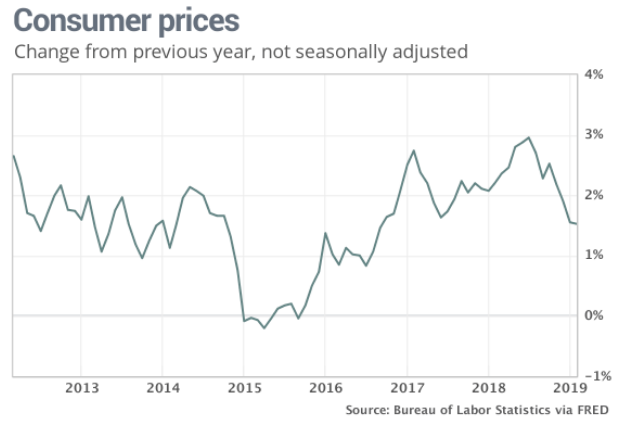
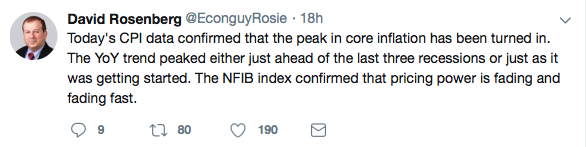
The increase in the cost of living over the past year, however, slowed again to 1.5% from 1.6 percent. The rate of inflation has throttled back sharply since hitting almost 3% last summer. As we often suggest at Finom Group, there is no reality in the theory of sustained inflation. Prices head lower over time as the nature of consumer intent dominates in consumer driven economy. But if you require a more sanguine and dire characterization of consumer prices and inflation, David Rosenberg has ample commentary to offer on the subject.
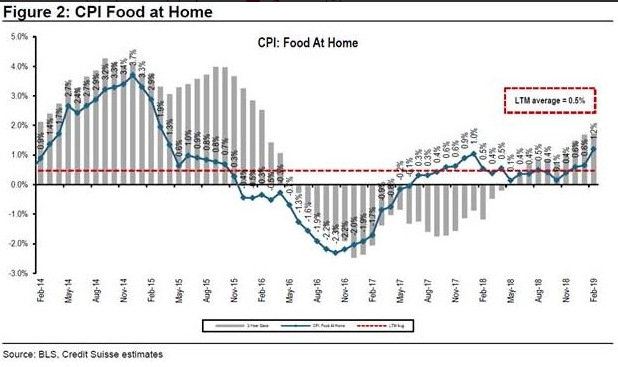
One thing is for sure, however and that is the cost of food at home. But to be clear and as evidenced in the following chart, the rise in food costs is only temporary and has only lifted in the last 10 months or so.
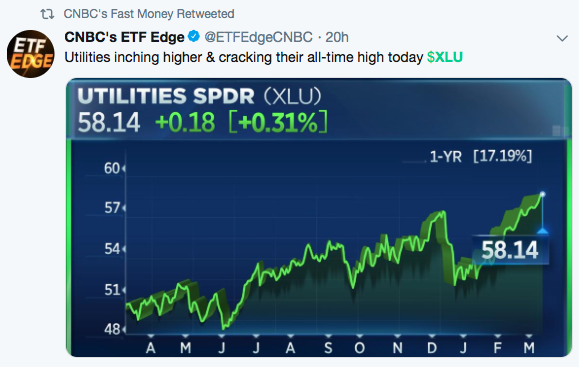
As the equity markets continue to churn, with the S&P 500 hovering just below 2,800 recently, defensive sectors continue to draw fund flows, as we mentioned recently. Be it utilities or consumer staples, investors are participating in the 2019 rally, but they are doing so with greater trepidation and with a security blanket of sorts. Shown in the chart below is the utilities sector ETF (XLU) hitting an all-time high on Tuesday.
This is something we also discussed on Monday, given the unusual piling into defensive sectors and what it tends to signal for the markets going forward. The strength in the XLU has been rather unique. XLU’s 14 day RSI is much higher than the S&P’s 14 day RSI. Here’s what happens next to the S&P when XLU’s 14 day RSI is above 77 while the S&P’s RSI is below 60, according to Troy Bombardia’s study on the two dynamic variables.
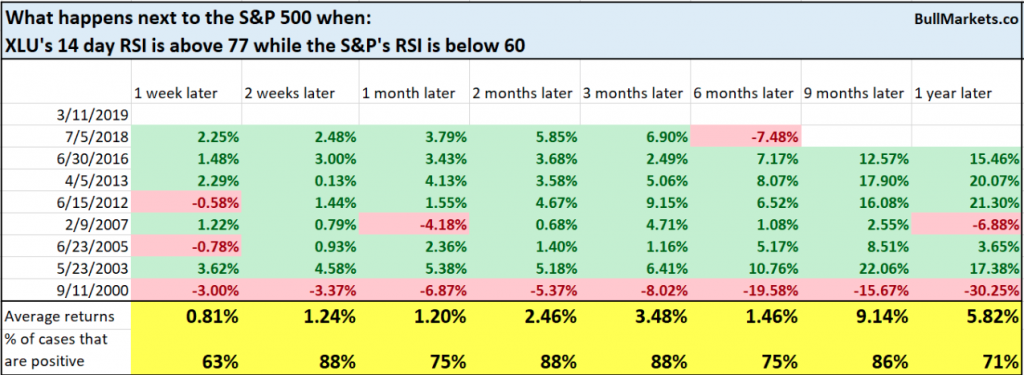
Based on the table above, the XLU’s performance tends to be bullish across most time frames over the next 12 months for the S&P 500, but history is just that, history.
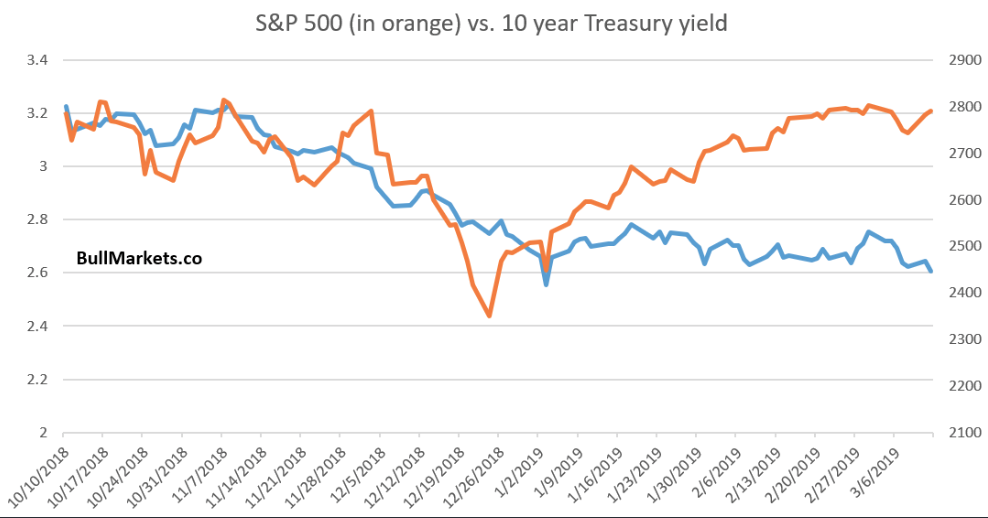
The other issue with the 2019 equity market rally is that it has coincided with a bond market rally. As the price of bonds goes up, yields go down. The 10-year Treasury yield briefly dipped below 2.60% on Tuesday, even with the equity market rallying.
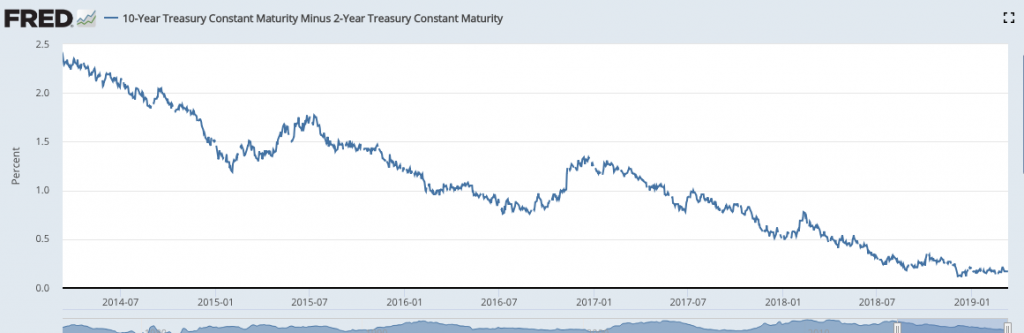
Additionally, the spread between 2-year and 10-year Treasury yields has hovered around 15 to 20 basis points (bps) (.15–.20%) over the past few months, the lowest level since 2007. Many investors and analysts alike are of the opinion that should this part of the bond yield curve invert, it heralds an imminent recession. After all, an inverted yield curve (or long-term rates falling below short-term rates) has preceded each of the nine recessions going back to 1955. To be precise, an inverted yield curve has also preceded 2 recessions that never actually happened.
Tightening Fed policy and muted growth and inflation expectations have driven yield curve flattening amid rising interest rates the past few years, a shift known as a “bear flattener” that isn’t necessarily ominous for U.S. economic potential. However, stagnant longer-term yields at the end of last year increased speculation that the Fed’s gradual rate tightening plans could derail the expansion.
The Fed has promised patience in deciding on future hikes, but the yield curve remains historically flat. Short-term rates have settled into a range that aligns with a Fed pause: The 2-year yield has closed within 10 bps (.10%) of the upper-bound fed funds rate for 31 straight days, the longest streak since 2013. However, 10-year yields have fallen into their smallest year-to-date range since 1974.
“We see the stall in long-term rates as a clash between steady economic growth and rising inflation expectations on one hand, and higher global demand amid lower yields in other major regions on the other,” said LPL Research Chief Investment Strategist John Lynch. “However, we think sound economic fundamentals will eventually prevail over global uncertainty.”
While it is usually the dog whistle of the permabears to denote the smart money coming from bond investors, let’s take a look at another study from Bullmarkets.co to see what happens when the S&P went up 13%+ in the past 50 days, while the 10 year Treasury yield’s % change was less than -5% (using TNX).

The reality is, stripping out historic data and statistics, the market is seemingly in need of a pause and or retracement before finding another leg higher. The S&P 500’s 2-day gain this week pushed it back above its 50-DMA, but market internals are still neutral with 44% of stocks overbought and 8.4% oversold. We discuss some of our latest thoughts on market conditions in the form of technical analysis here in our latest daily Technical Market Recap with Wayne Nelson.

Regardless of market conditions and/or sentiment, Finom Group will continue to trade what the market delivers.
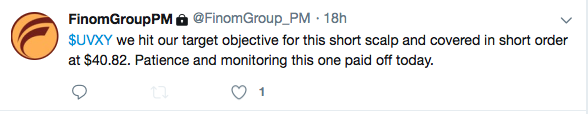
With Tuesday’s volatility crunch, complacency continues to characterize the 2019 markets. That could, of course, become disrupted at any time, but as volatility traders, Finom Group took the opportunity to short shares of UVXY, as shown in the screen shot below.
In addition to our latest short-VOL trade, we completed our trade alert in shares of Apple Inc. (AAPL) Tuesday. Our Technical Analyst, Wayne Nelson, offered the following trade alert in our new Trading Room.
After several weeks of sideways price action in AAPL, which we had been monitoring very closely, an analyst issued an upgrade on Monday, March 11th that sparked a pre-market rally in the stock.
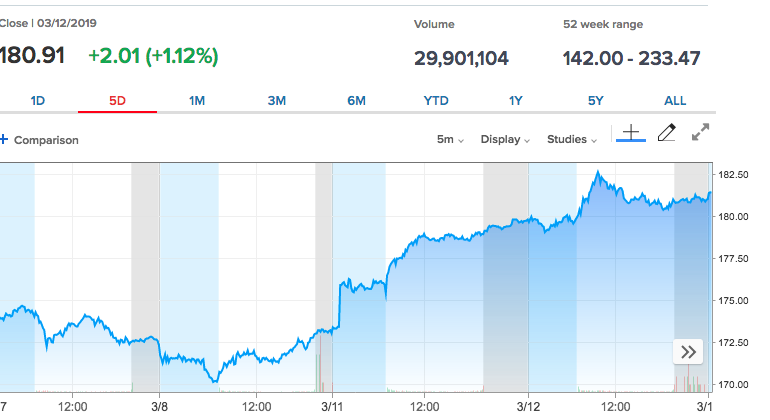
We witnessed AAPL continue to rise after the U.S. Stock Market open, which told us that institutions were accumulating the stock and that Apple’s Share Buy-Back Program was most likely a contributing factor for the upside move.
We initiated a Trade Alert for AAPL when the stock traded at approximately the $176.50 price level. We then suggested buying either the stock or options.
For options we recommended either the 190 or 200 strike price in the JUN contract, depending on the Risk/Reward desired. I set my price target at $182. This price level was hit the next day, Tuesday, March 12th, at which point we exited the position for a nice profit. The high of the day was 182.67 and the stock closed at 180.94.
So we stuck to our plan, remained objective and realized a nice profit. And that’s how it’s done. We will continue to monitor AAPL for additional opportunities.
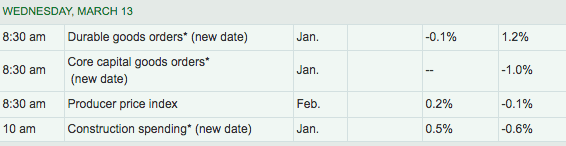
Equity futures are looking toward a flat open on Wall Street and with limited, but important, economic data ahead.
Subscribe to Finom Group today and join our Trading Room and receive our weekly Research Report and State of the Markets video.


