It wasn’t quite the landslide for equities on Tuesday one might have assumed after Monday’s pivotal announcement from a key handset provider warned on revenues. And that handset provider was of course…
Apple said Monday that it does not expect to meet its quarterly revenue forecast because of lower iPhone supply globally and lower Chinese demand as a result of the coronavirus outbreak. The company said that it expected to report net sales between $63 billion to $67 billion in its fiscal second quarter. Apple did not provide a new forecast for its fiscal second-quarter revenue on Monday. The company said it provided a wider range than usual in late January, citing the uncertainty around the coronavirus outbreak.
“As you can see from the range, anticipates some level of issue there. Otherwise, we would not have a $4 billion range,” CEO Tim Cook said at the time.

Opinions concerning Apple’s announced revenue warning from analysts were wide ranging, but generally forgiving and optimistic. Some of those opinions are as follows:
Morgan Stanley: leave FY20 / FY21 and PT unchanged
“…we assume Apple ends the March quarter with three weeks of iPhone channel inventory versus the normal six weeks, representing a $7.5B revenue shortfall in the quarter. To be conservative, we assume 80% of the channel inventory rebuild plays out in the June quarter, with the remainder boosting September quarter revenue. Importantly, while the guidance miss messaged today takes into account the current manufacturing ramp communicated to Apple from its partners, Apple hopes to ramp manufacturing even faster than what our new estimates imply and Apple views any revenue miss as temporary and supply-driven.”
Wedbush analysts Daniel Ives and Strecker Backe
“While trying to gauge the impact of the iPhone miss and potential bounce back in the June quarter will be front and center for the Street, we remain bullish on Apple for the longer term 5G supercycle thesis despite today’s news.”
Raymond James analyst Chris Caso argued that the March quarter is seasonally slow for Apple
“Almost all of the production and most of the demand is likely to be recaptured once Apple’s manufacturing partners are able to return to full production, and once retail facilities in China return to normal.”
Provided that Apple’s production issues are resolved by the summer, we don’t anticipate an impact to the upcoming 5G iPhone upgrade cycle, “and since that’s the prime reason for our bullish view on the stock, this represents no change to our thesis.”
Samik Chatterjee and a team of analysts at J.P. Morgan
“Owing to “continuing challenges stemming from the coronavirus outbreak on both domestic demand and global supply,” we are now expecting much lower fiscal second-quarter iPhone volumes and a more modest reduction in those volumes for the third quarter, led by the iPhone 11.
We see downside risks to consensus expectations for the smartphone industry and 5G smartphone volumes in 2020, led by the lower volume outlook for China. But the impact on 5G iPhones may be less, due to the fact North America accounts for around 40% of iPhone volume shipments and Apple’s iPhone volume exposure to China is declining.”
Despite the announced revenue shortfall expectation by Apple and what was presumed to be a tech-heavy pounding in the market on Tuesday, when traders got back to work, the Nasdaq (NDX) actually squeezed out a 1 point positive finish. The Dow Jones Industrial Average (DJIA) lagged the major indices, falling by .5% while the S&P 500 (SPX) fell just 9 points on the session. What became increasingly apparent to U.S. investors on Tuesday, in the wake of the Apple revenue warning, was that in the face of the coronavirus fallout, the hunt for dollar denominated assets is real.
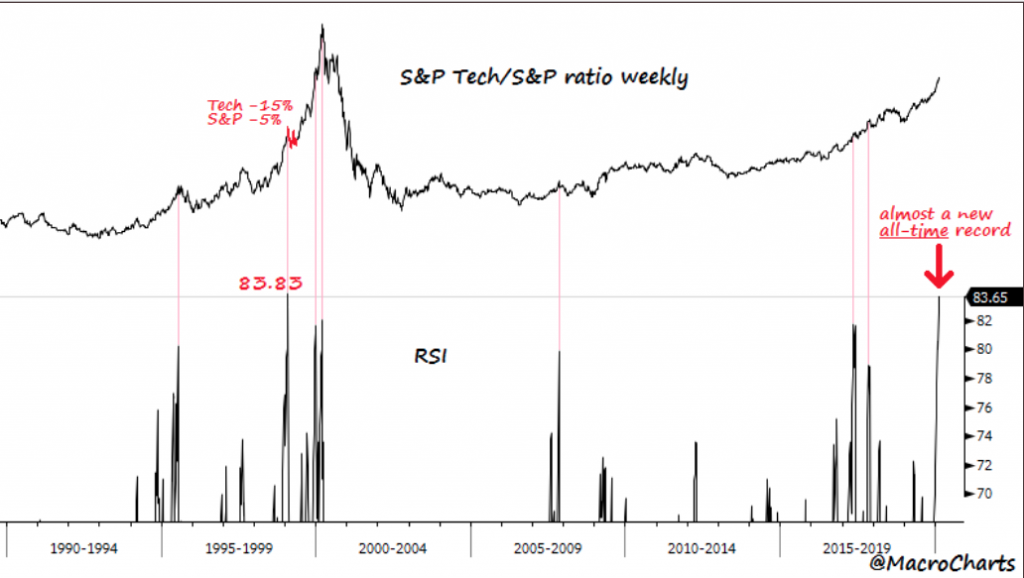
In speaking of Apple (not really a tech stock) and the tech sector, tech heavyweights continue to carry the broader market higher. According to MacroCharts, the Tech/S&P weekly RSI is now within pennies of a new *all-time* record overbought (30 years).
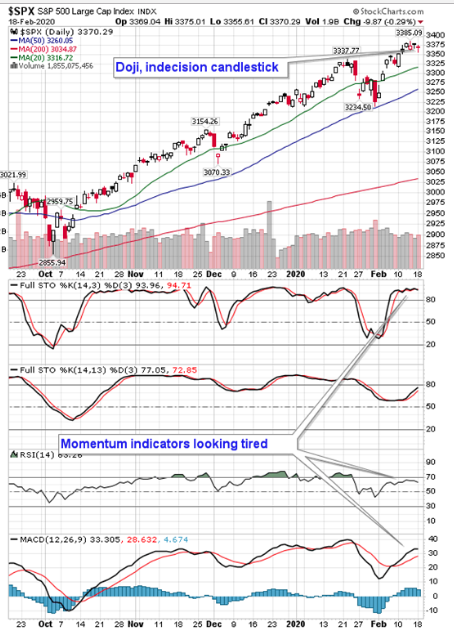
The S&P 500’s weakness yesterday was felt more so in breadth and momentum than in the 9 point decline. In the chart below, we can discern that the benchmark index remains well above its 50 and 200-DMA, while the RSI and MACD is starting to rollover. Of course, this can change from one day to the next and we assert that the bullish trend remains intact.
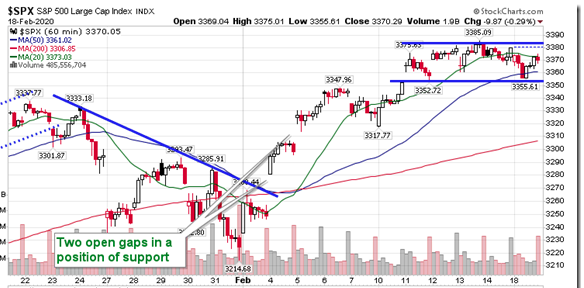
On the hourly chart below from Equity Clock, signs of stalling below resistance at 3385 can be witnessed. The benchmark has essentially gone nowhere for the past week, trading in a tight range between the gap that was opened at 3352 and the all-time high at 3385. Momentum indicators have been negatively diverging from price for the past week or so, suggesting waning buying demand and large caps holding the market at record levels. It appears that price is now trying to reflect the deteriorating technical conditions that have become apparent over the past month. Even though the fundamentals and seasonal parameters for the broader market are still bullish, the technicals are showing cautionary signs, suggesting investors might look at the present market conditions through the lens of portfolio rebalancing opportunity.
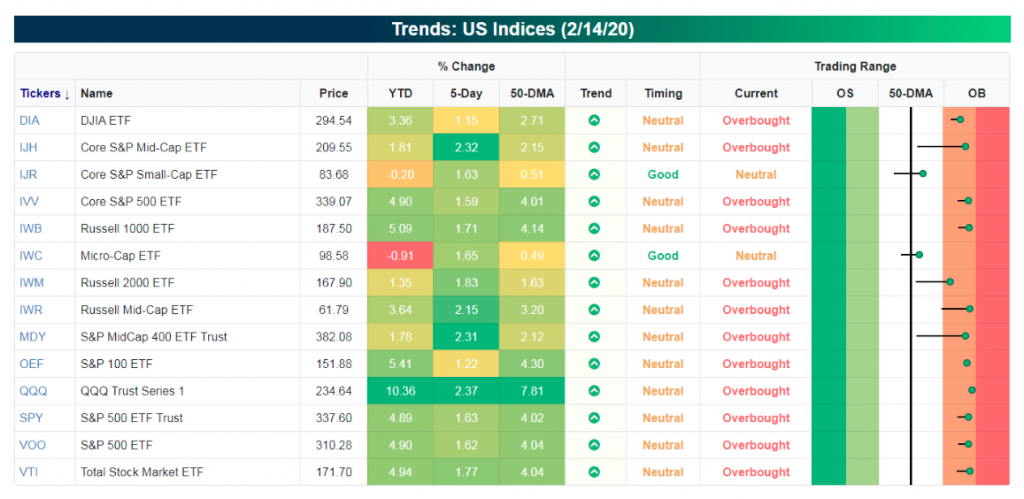
It is important for investors/traders to rationalize the bullish trend in equities vs. near-term correction probabilities. The longer-term bullish trend remains with strength, even when we dig down to the index ETF level. Every major U.S. index ETF ended last week above its 50-DMA, with all but 2 overbought and all in long-term uptrends.
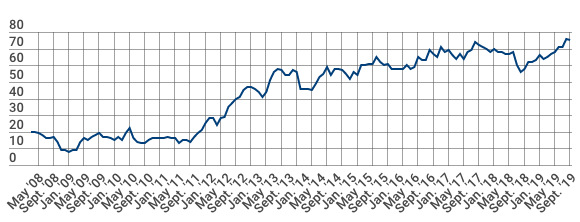
With overbought conditions proliferating in the market, investor positioning has largely shifted out of single stocks. It appears that all the bullish speculation has moved into the options market where both retail investors and professionals are buying calls as fast as they can get them, while their direct exposure remains limited. This chart from Goldman Sachs shows that single stock option notional volumes as a percentage of shares are at 91%, it’s highest level ever.

Despite the daily coronavirus headlines and continued Chinese provincial quarantines that will be impacting the global economy to one degree or another, this too shall pass. In differentiating and qualifying the impact from the coronavirus we draw a distinction between this latest threat to the global economy and that from the 2018-2019 trade war.
The biggest difference between the two threats is that the trade war was a manmade crisis and coronavirus is a natural crisis. It is much harder to analyze a crisis created by “Mother Nature” than one which can be removed by man with the stroke of a pen or handshake. Nonetheless, domestically the U.S. economy continues to hum along for now.
The National Association of Home Builders’ monthly confidence index dropped one point to 74 in February from 75 the month prior, the trade group said Tuesday. That’s just two points below December’s figure, which represented the highest index reading since June 1999.
“Steady job growth, rising wages and low interest rates are fueling demand but builders are still grappling with increasing construction and development costs,” said NAHB Chairman Dean Mon.
“At a time when demand is on the rise, regulatory constraints along with a shortage of construction workers and a dearth of lots are hindering the production of affordable housing in local communities across the nation,” said NAHB Chief Economist Robert Dietz. “And while lower mortgage rates have improved housing affordability in recent months, accelerating price growth due to limited inventory may offset some of that effect.”
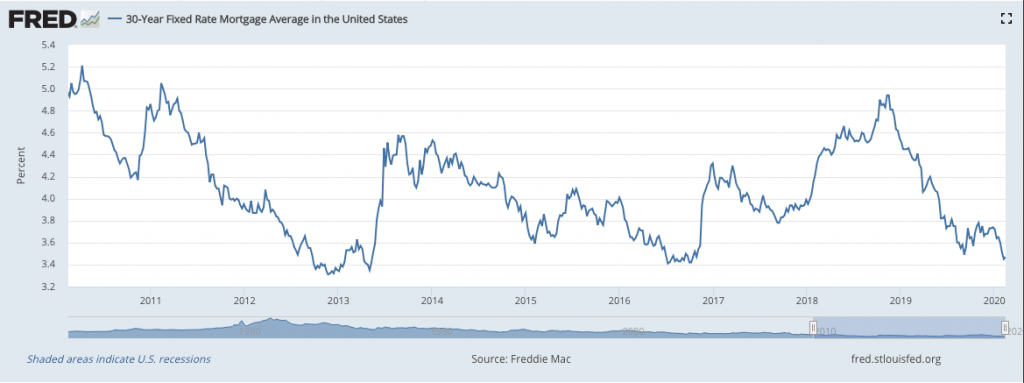
Finom Group has offered that with job and wage growth expectations and the low rate environment, we expect the housing sector to remain strong through the 1st half of 2020, barring any exogenous shock to the economy. A 30-year fixed rate mortgage remains near record low levels, further spurring housing demand even as housing prices have continued to rise.
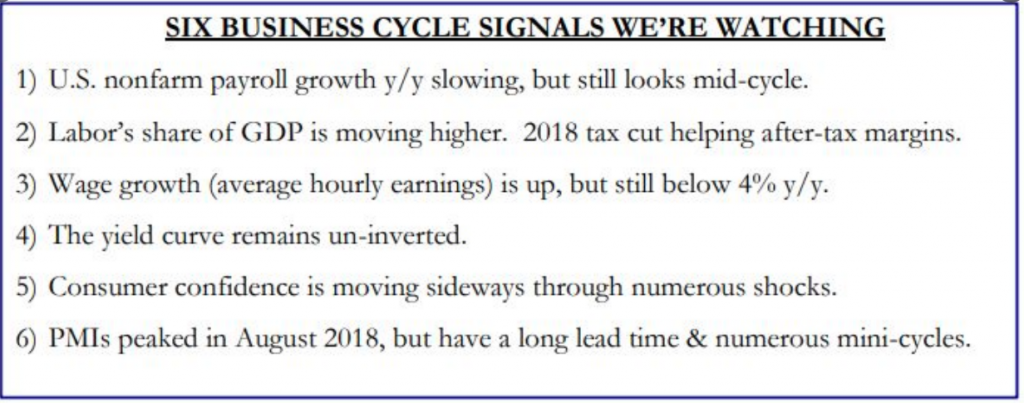
With respect to the broader U.S. economy, here is what analysts from Strategas had to offer:
“The 6 leading indicators we watch signal the U.S. economy remains solid and that there is still time left in this business cycle. A soft-landing is our base case in 2020, even if the data is underwhelming during 1Q. The long cycle will continue amid & beyond near term volatility.”
In other economic data released on Tuesday, the New York Federal Reserve’s Empire State business conditions index rose 8.1 points to 12.9 in February. This is the highest level since last May. Economists had expected a reading of 4.0, according to a survey by Econoday.
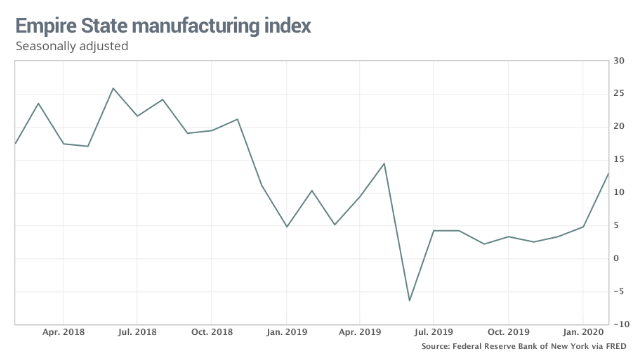
The new orders index rose 15.5 points to 22.1 in February, the highest level in over a year. The shipments index also had a strong gain, rising 10.3 points to 18.9. Labor market indicators remained soft. Delivery times lengthened and inventories increased sharply. Optimism remained somewhat subdued. The index for future business conditions was little-changed at 22.9.
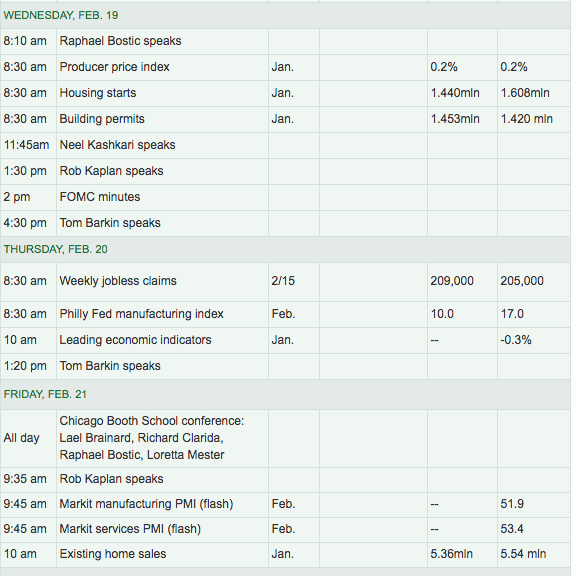
For the remainder of the week, economic data continues to deliver readings on the housing and manufacturing sectors of the U.S. economy.
Earnings season is winding down and as it does it continues to identify stronger than forecasted Q4 EPS and revenue results. Alongside such results, the market has marched higher, now revealing the highest P/E multiple of the cycle at roughly 18.8X forward looking EPS. And with such a rich valuation, naturally we see all different types of “bubble” headlines and chart comparisons to the dotcom era.
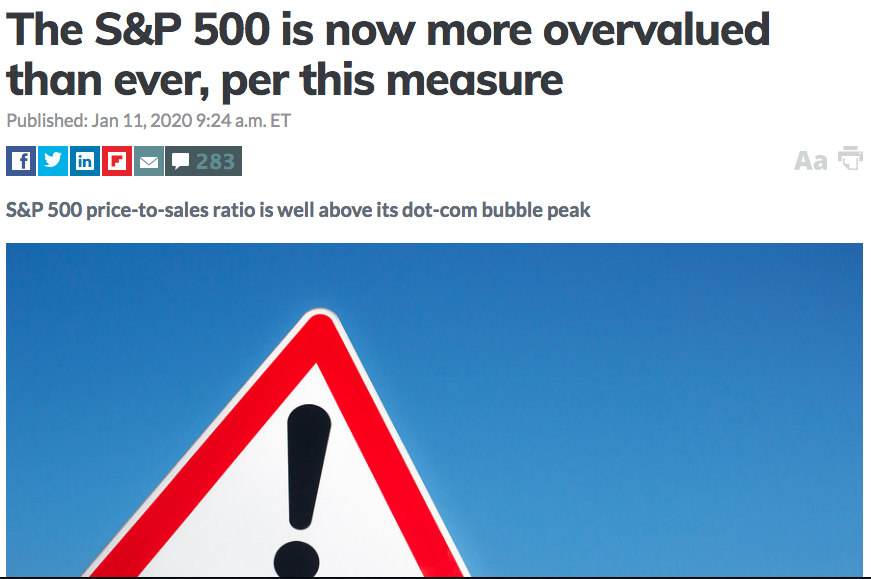
But here is the reality of current valuations. On both an absolute basis and relative to bonds, equities are more reasonably valued today. Closing out 1999, the S&P 500 was trading at a 25.2x P/E, whereas today this figure stands at 18.5x. The equity risk premium back then fell to the 1st percentile of its historical range, suggesting negligible benefit to picking equities over bonds, versus today at roughly the 75th percentile, making stocks much more attractive.
For many investors, the current near cyclical-high absolute valuation for equities may seem daunting; however, we would caution that valuations can be a poor indicator of near-term returns. Extreme levels of valuation can signal attractive long-term entry points or a sign of leaner returns going forward, but today’s levels indicate that returns will be more guided by the business and profit cycle. We also believe that equity valuations can remain seemingly elevated due to major changes undergone by the U.S. economy. Over the past few decades, the volatility of gross domestic product (GDP) growth and inflation has declined due to more proactive fiscal and monetary policies, and a shift to less cyclical services from more cyclical manufacturing activity has made the modern economy less prone to recessions. Higher certainty on future cash flows and earnings is reflected in higher multiples on a structural basis.
In the second half of 1999, then Fed Chair Alan Greenspan started to hike policy rates. This seems unlikely today given that inflation is quiescent and the Fed is becoming more tolerant of it moving higher. In fact, the probability of the Fed lowering rates this year has risen recently in part due to the economic uncertainty from the coronavirus outbreak. Therefore, given the significant role of lower interest rates today in keeping equities
relatively attractive, it seems that rates are poised to remain lower for longer.
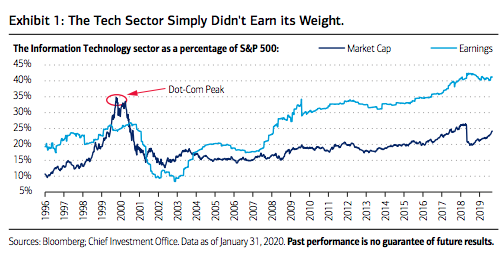
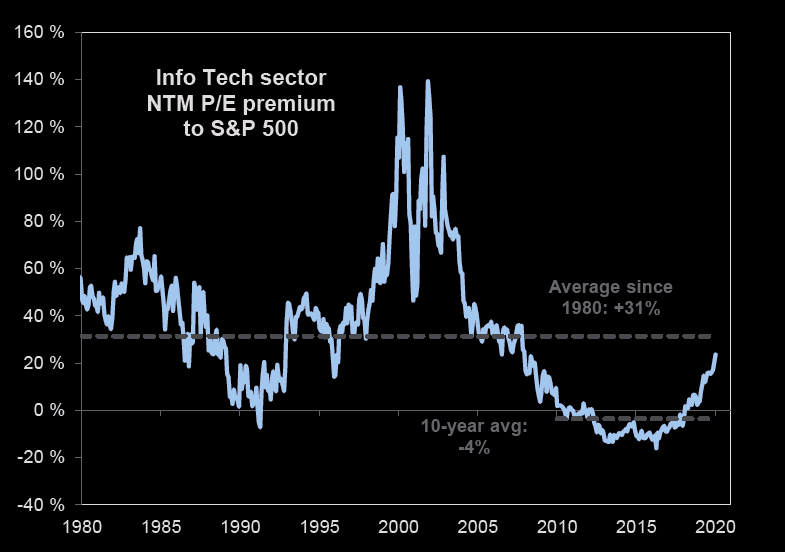
The technology sector today is producing real earnings and cash flows At the height of the tech bubble in 2000, the technology sector traded at a near 2.5x premium to the overall market on a price-to-earnings basis. Today, this premium is only 1.2x. Back then, the sector’s weight in the broader S&P 500 nearly doubled its earnings contribution—today, that story has reversed (Exhibit 1). The sector is not punching above its weight and has rightfully earned its outperformance and dominance in the current cycle. Also unlike 1999, the average technology company of today tends to be more mature, often delaying Initial Public Offerings (IPOs) in efforts of boosting profitability.
Another difference is that in 2000, the technology sector generated subzero free-cashflow margins when accounting for employee stock options, according to Empirical Research Partners. That figure is currently 18%. Empirical also notes that expectations were much higher back in the late 1990s. Research analysts then estimated that the earnings of technology stocks would grow four times as fast as that of the broad market’s. Current expectations call for a 1.6x differential. Lower expectations and cheaper valuations compared to the late ‘90s keep us bullish on the sector in the long term, which is being driven by the accelerating digital transformation of enterprises and customer experiences on a global basis.
Another visual aid to help rationalize current tech valuations is to understand that primarily, the market is valued against earnings, not sales. Most AAPL investor can attest to this as the company’s EPS grew in 2019, but sales fell. This was most obviously due to the company’s sizable share repurchase program.
Information Technology still trades below long term valuation premium when compared to the overall market. This chart from Goldman Sachs should make you worry less about the relative valuation of U.S. tech.
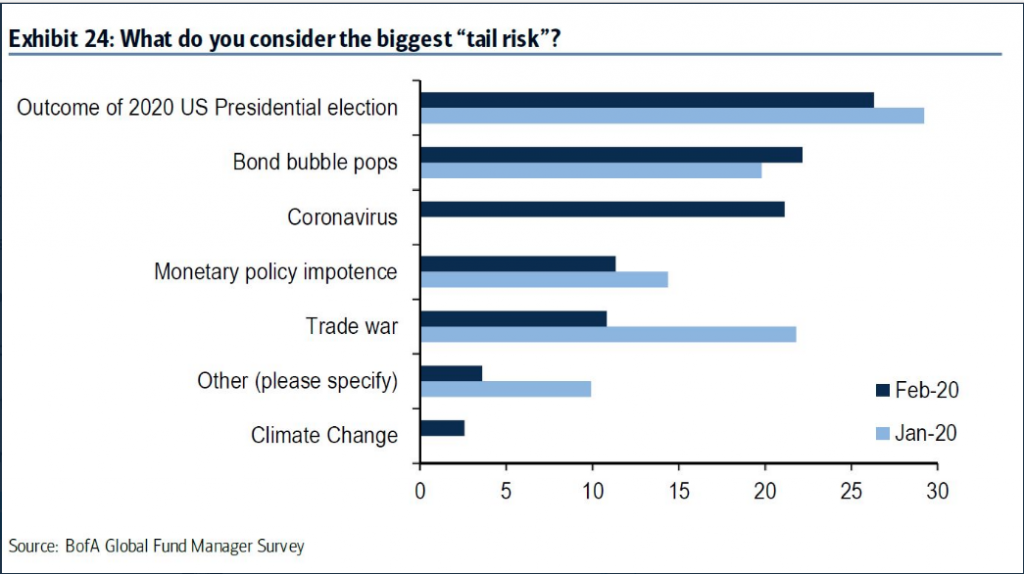
In the current environment, investors would be wise to keep in mind that the world will not come to an end due to the recent outbreak in China. Demand may be displaced, only to rebound in the future, but demand will not die. Central banks continue to provide the global economy with ample liquidity and other drippings of accommodative policies, as the epidemic saga may be reaching its climactic point. Oddly enough, while the coronavirus is front and center for media headlines and analysts forecast considerations, it’s not proving the biggest concern amongst fund managers. The latest BAML Fund Manager Survey suggests that the biggest tail risk to the market is the U.S. presidential election outcome, not the coronavirus.