
Welcome to another trading week. In appreciation for all of our Basic Membership level participants and daily readers of finomgroup.com content, we offer the following excerpts from within our weekly Research Report. Our weekly Research Report is extremely detailed and has proven to help guide investors and traders during all types of market conditions with thoughtful insights and analysis, graphs, studies, and historical data. We encourage our readers to upgrade to our Contributor Membership level ($14.99/monthly, cancel anytime) to receive our weekly Research Report and State of the Market videos. Have a great trading week and take a look at some of the materials from within this week’s Research Report…
Research Report Excerpt #1
Secondly, investors have a tendency to believe that holding onto “losers” is a losing strategy, but there is so much more to holding onto losers than meets the eye.
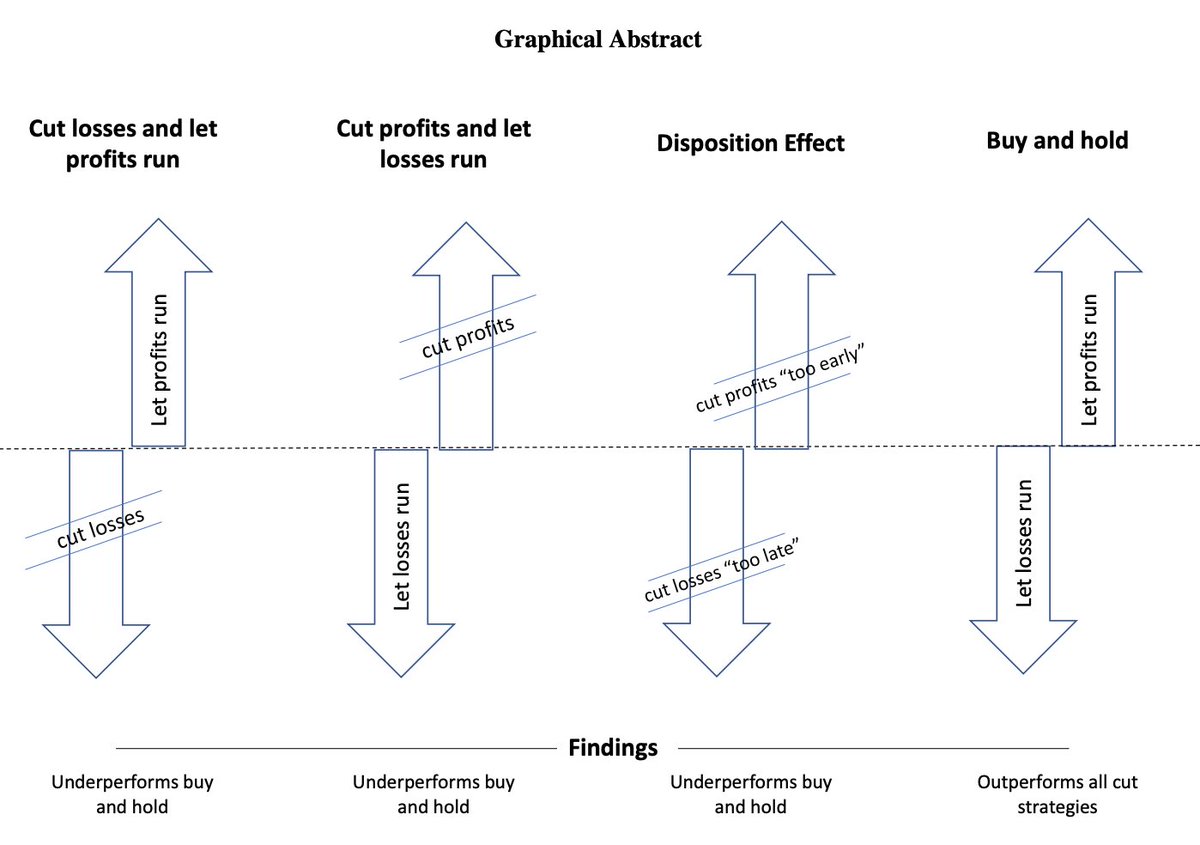
As the graphic and associated data suggests via FINDINGS, weak loser stocks do not strictly fall, and strong winner stocks do not strictly rise, which implies that the best strategy is to let both losses and profits run i.e. Buy & Hold! There is a psychology to investing that is highly underrated and which most investors fall prey. Most behavioral finance expressions are reciprocal, meaning that what we tend to do to the upside we tend to to do to the downside. If we attempt to cut losses early, we are likely to cut profits too soon as well. Over time, our winners mathematically have the ability to overpower our losers, as the upside is unlimited while the downside is limited to 0️⃣, and the closer a loser gets to 0️⃣ the losses slow while winners can compound and accelerate. This is an important physics concept that gets lost on investors, no pun intended, but a necessary understanding to long-term investing psychology. If it is numbers it is math, but our ego insists we can be better or overcome the simplicity of the math, and so we interfere even when the math is infallible.
Research Report Excerpt #2
We hope these potential catalysts were your focal points over the last several weeks more so than Wall Street’s rhetoric and fund manager’s positioning for more market pain. Then again…sometimes knowing what fund managers are doing can prove a strong contrarian signal, as they are more often than not short and/or under leveraged.
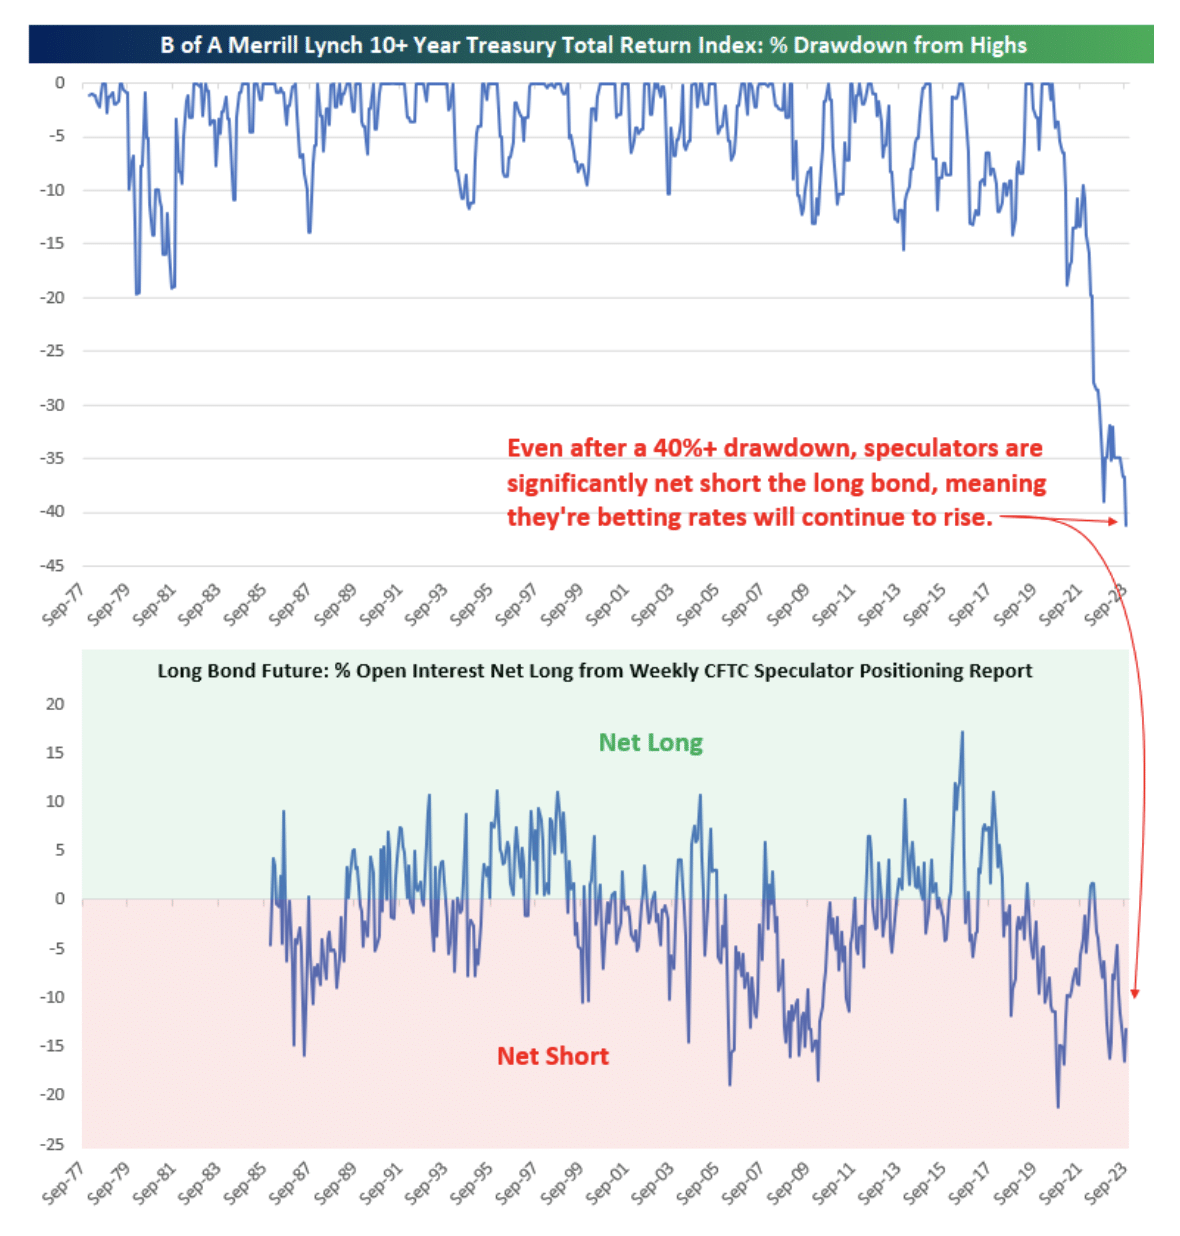
As shown in the first chart above, long-term Treasuries just had by far their steepest drawdown of the last 45+ years. Talk about pain in an area that’s typically considered “safe” relative to other asset classes. The long bond was recently back to levels last seen at the turn of the millennium, roughly 5% for the 10-year Treasury yield.
As Treasuries had traded lower and lower on a seemingly daily basis, speculators continued to press their bets that prices would drop even further, based on open interest data released by the CFTC. As shown in the second chart above, instead of seeing a shift from net short to net long as the long bond has collapsed in price this year, speculators remained heavily tilted to the short side.
Research Report Excerpt #3
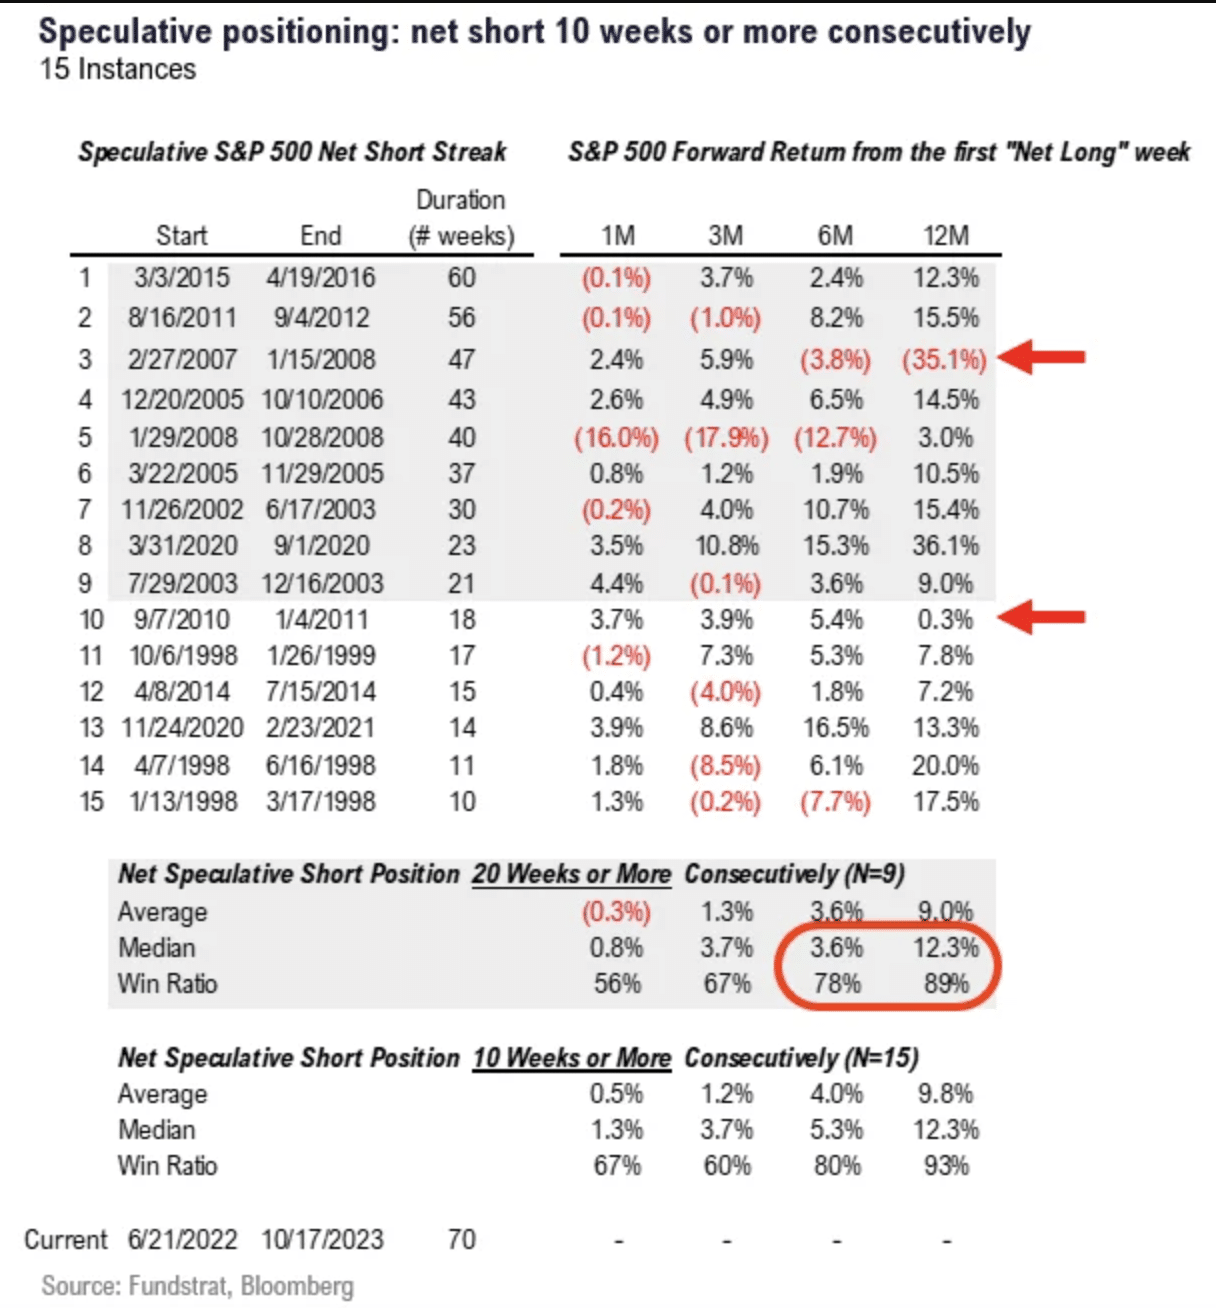
Fundstrat noted that speculative positioning on S&P 500 flipped net long for the first time in 70 weeks. That is the longest ever period of speculators being net-short S&P 500 futures. And to me a sign selling might have exhausted itself. According to analysis by Fundstrat’s data science team, led by Tireless Ken, in the 15 instances where speculative positioning was short >10 weeks (n=15), the win-ratio for the S&P 500 is displayed below:
Research Report Excerpt #4
The SSI has historically had better predictive capability for subsequent 12-month S&P 500 total returns (Exhibit 4) than many other “market timing tools.” Although an R-squared of 24% might sound low, it is significantly higher than that of other popular single-factor market timing models (Exhibit 5).
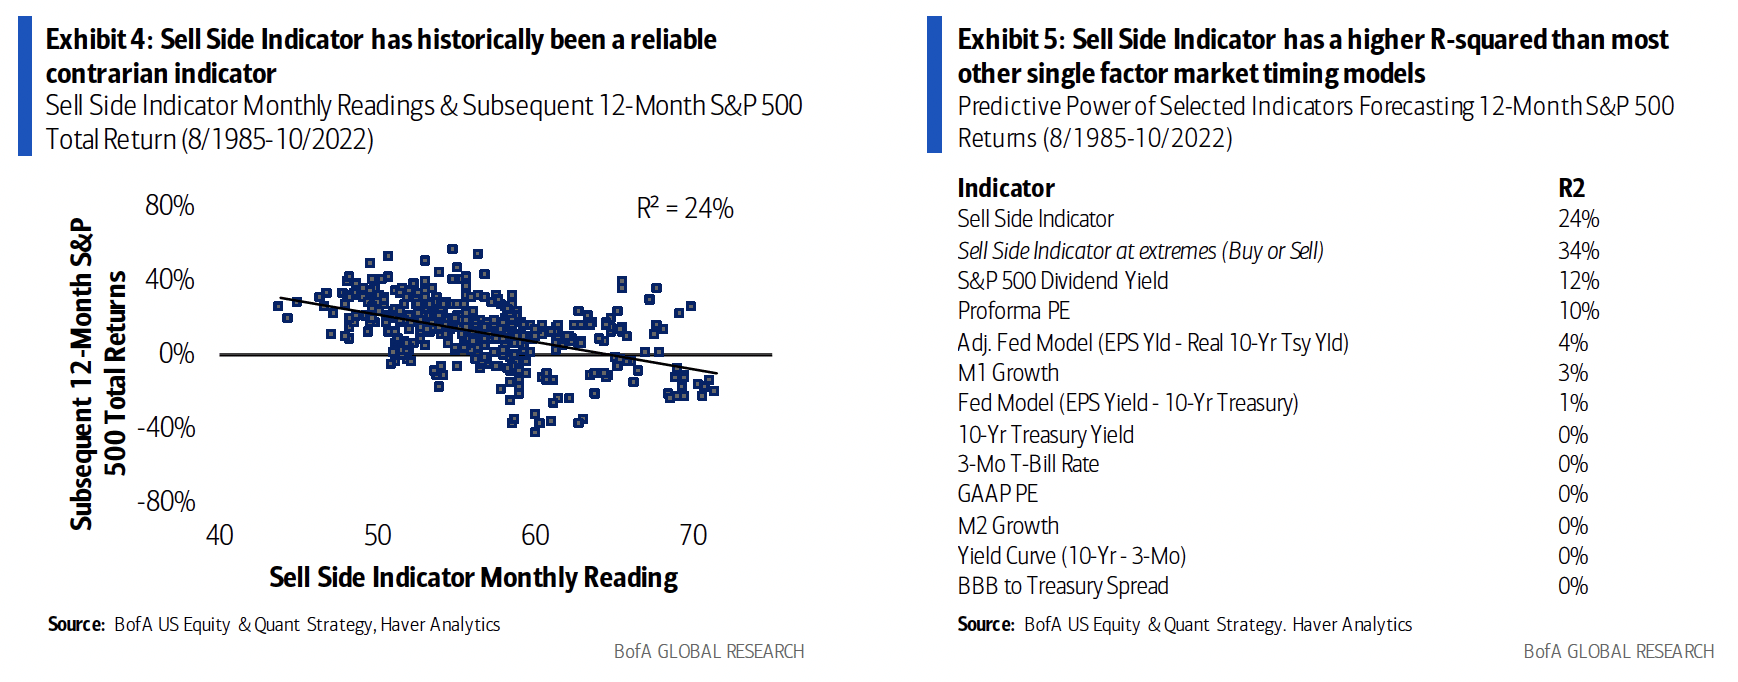
So while the fund managers and strategists are seemingly battling with narratives surrounding valuations, Equity Risk Premium, Treasury Spreads, M2 Growth and the yield-curve inversion, the most reliable market timing measure/tool has been the SSI, since 1985. In other words, POSITIONING MATTERS.
Research Report Excerpt #5
Now, let’s check out the following S&P 500 chart and annotations.
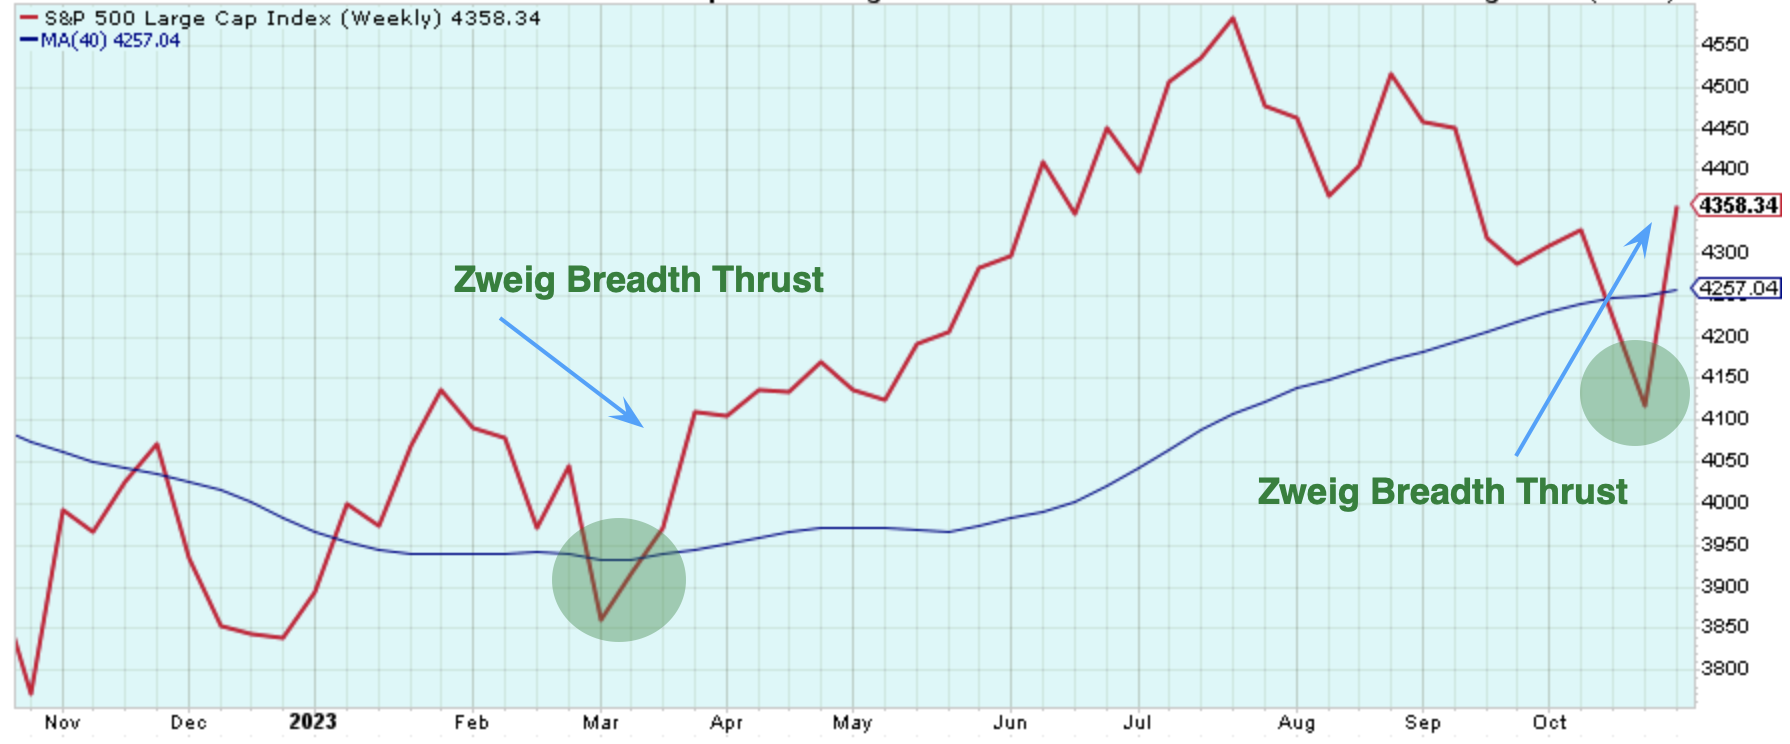
This weekly S&P 500 chart depicts a break back above the 40-week moving average, something we’ve discussed in the recent past, and when it was on the verge of breaking below the 40-WMA. What I had encouraged investors to recognize is that while this is a critical level of support, even if broken temporarily, it shouldn’t prove the end of the bull market. Heeding this suggestion would have proven savvy!
Research Report Excerpt #6
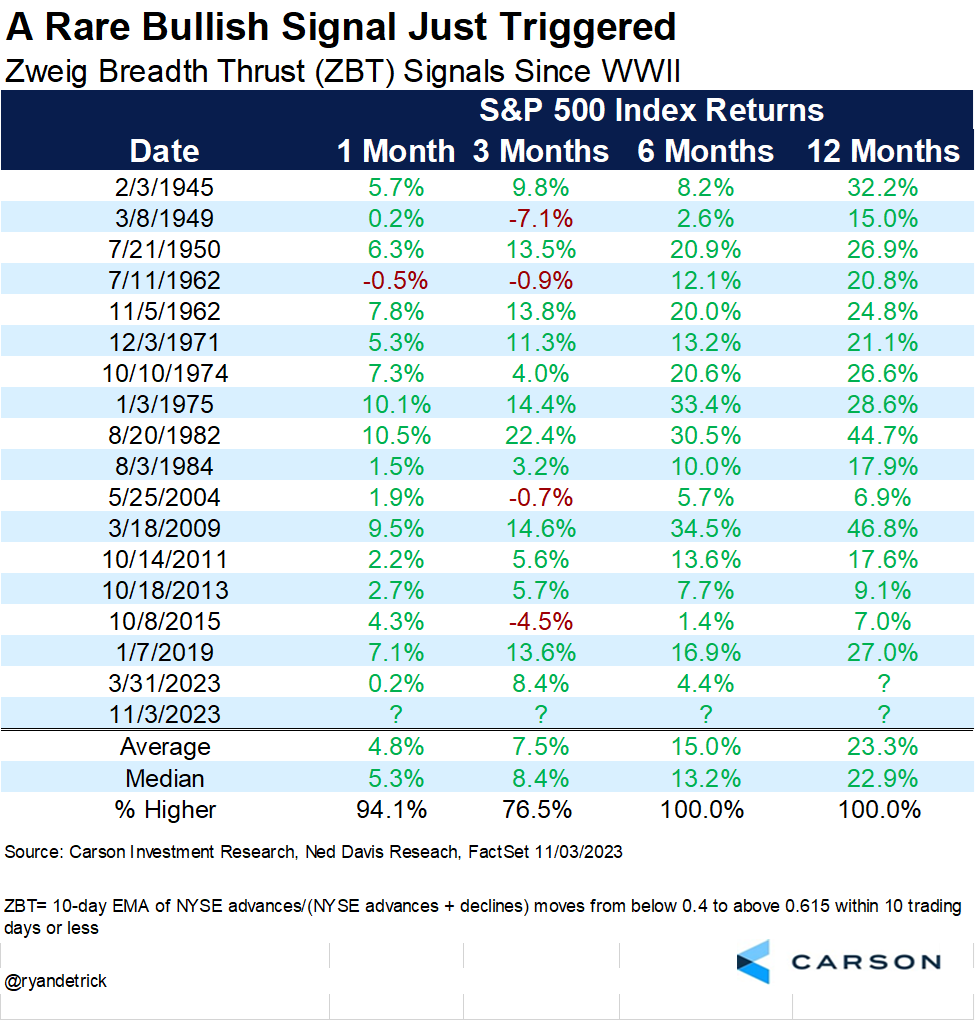
Did we know for sure that the S&P 500 would travel all the way down to the former ZBT level of 4,109 (intraday on 10/27/2023)? Of course we didn’t, but we did not have to know. All we had to do was have a game plan for allocating capital. That is the job of an investor, to invest smartly and with a plan! (table below from Carson Research’s Ryan Detrick)
At this point, we hope Finom Group investors realize how valuable it can be to have a game plan, and that Finom Group knows what to look for in order to define critical market levels of support and/or resistance.
Research Report Excerpt #7
With our Large-cap/Growth bias in mind, we cannot overlook the compelling Small-cap value proposition, which was posted to X earlier this past trading week.
Small-caps have only been this inexpensive 3 other times since the Great Financial Crisis, including 2022’s bear market.
Research Report Excerpt #8
With 82% of companies beating EPS estimates as of this past Friday, Q3 2023’s Y/Y earnings growth rate for the S&P 500 is now +3.7%.
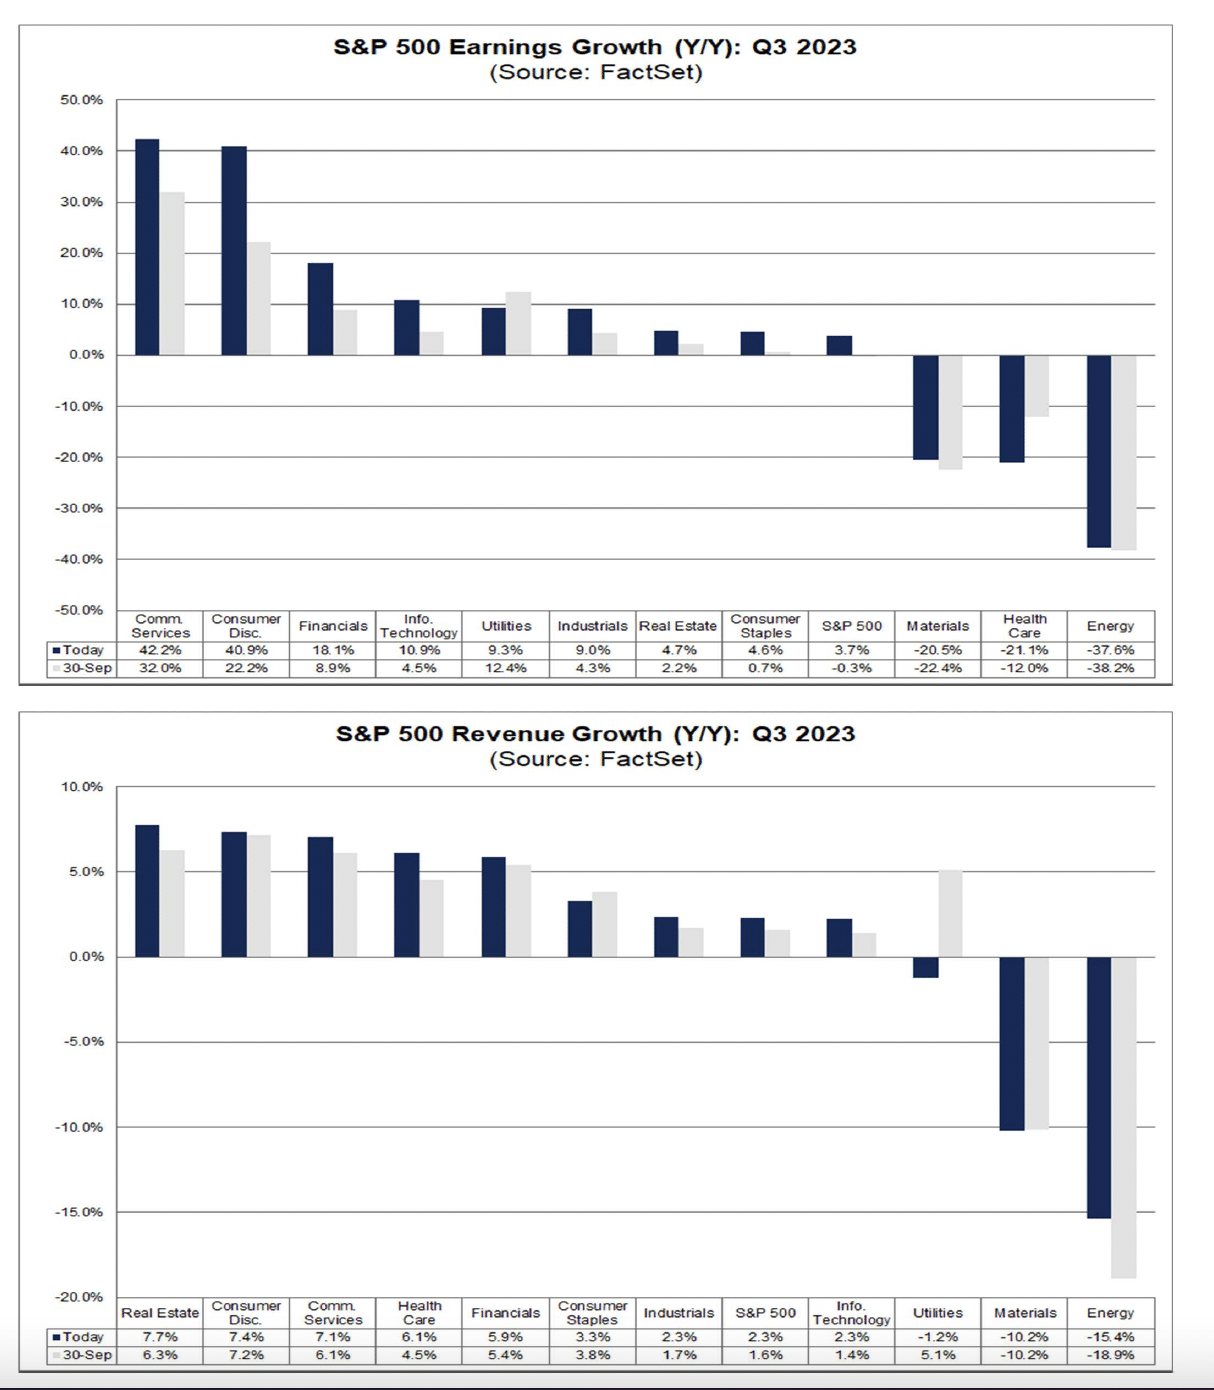
What I find particularly promising about Q3 earnings season is that in the face of one of the steepest disinflationary environments in history, companies have been able to produce upside revenue growth alongside increasing profit margins. This has not been the expected demonstration for S&P 500 companies in 2023, by the analyst community.
Research Report Excerpt #9
I have used the following chart of household assets vs. liabilities and their growth to demonstrate this hypothesis:
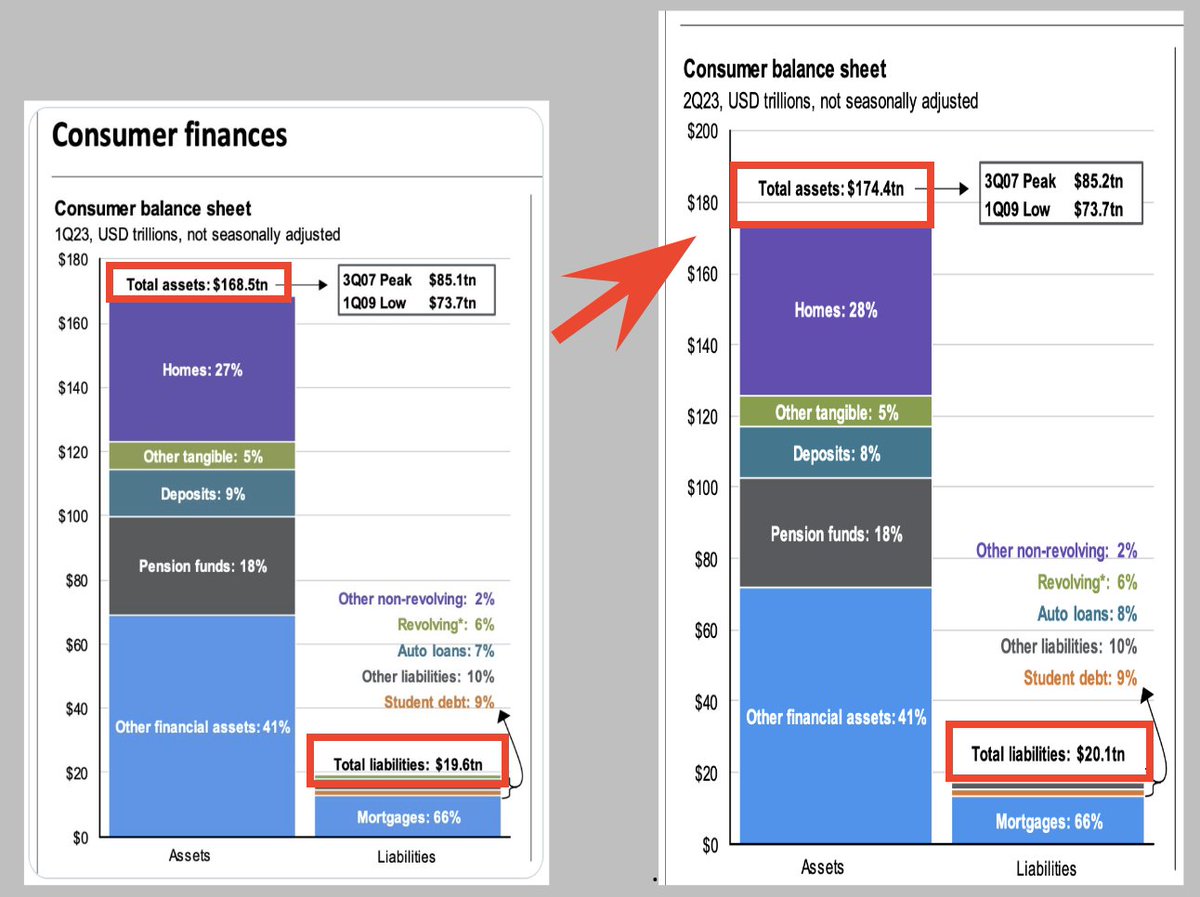
People still don’t understand or accept just how stimulative rate hikes have been From Q1 to Q2 and likely (when the tally is reported) through Q3. Total household assets rose by ~$6trlln from Q1 through Q2, BUT liabilities only rose ~$500bn over the stated time period. Household balance sheets have only strengthened. Yet for the most part, the financial media reports and hyperbolizes with great error how the consumer and households have/are weakening. It’s a gross mis-assessment of what is really taking shape with households, and one the Federal Reserve also expressed.
In the latest FOMC press conference by the chairman Jerome Powell, he expressed the following:
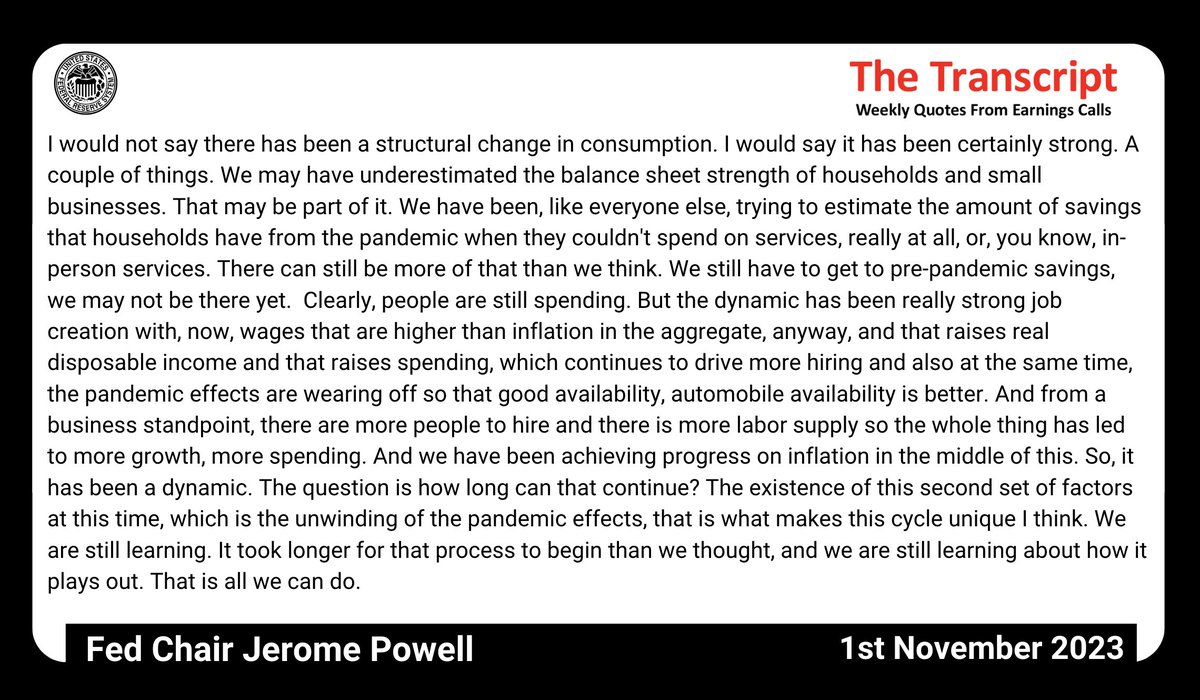
Powell: “We may have underestimated the balance sheet strength of households and small businesses…..We still have to get to pre-pandemic savings, we may not be there yet. Clearly, people are still spending…”


