
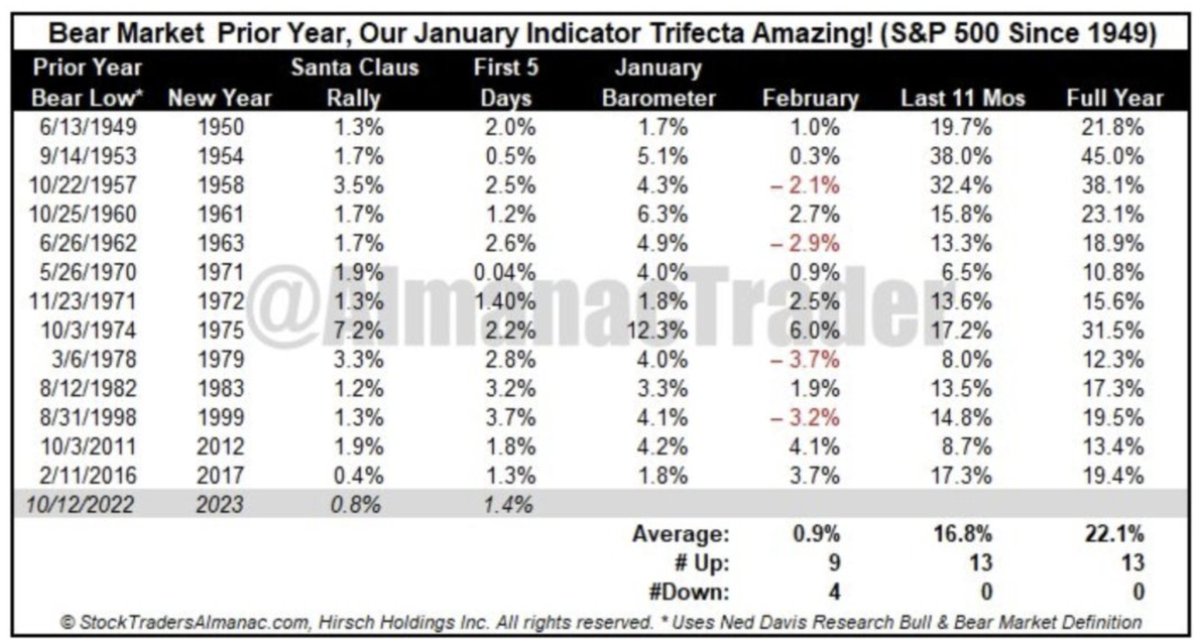
2023 and how it started: After a bear market in the prior year and January Indicator Trifecta is 3-for-3 positive, it’s UBER bullish for the year. Next 11 months and full year have ALWAYS been higher for the S&P 500. The average return is 22% for the full year. (Almanac Trader)
To watch the weekly video analysis with Seth Golden, please click the provided link!
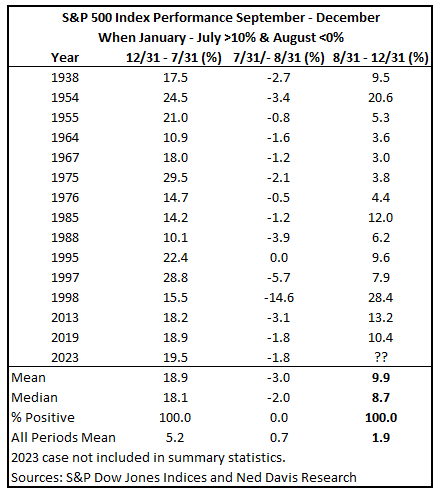
The S&P 500 fell 1.8% in August after surging 19.5% YTD thru July. The 13 previous times that the benchmark index was positive 10% or greater through July and down in August, it rose every time September – December by an average of 9.9 percent. Just one data point, but it supports the case that the August – October decline was a pullback within an ongoing uptrend (table of data set below).
So where was the S&P 500 at the end of August, producing a 1-month decline? On August 31st the index closed at 4,507. This past Friday, and since diving to a corrective low of 4,103 in late October, the index is now at 4,514. So here is how we use the data above and going forward. Now we turn to the median returns from August 31 – December 31.
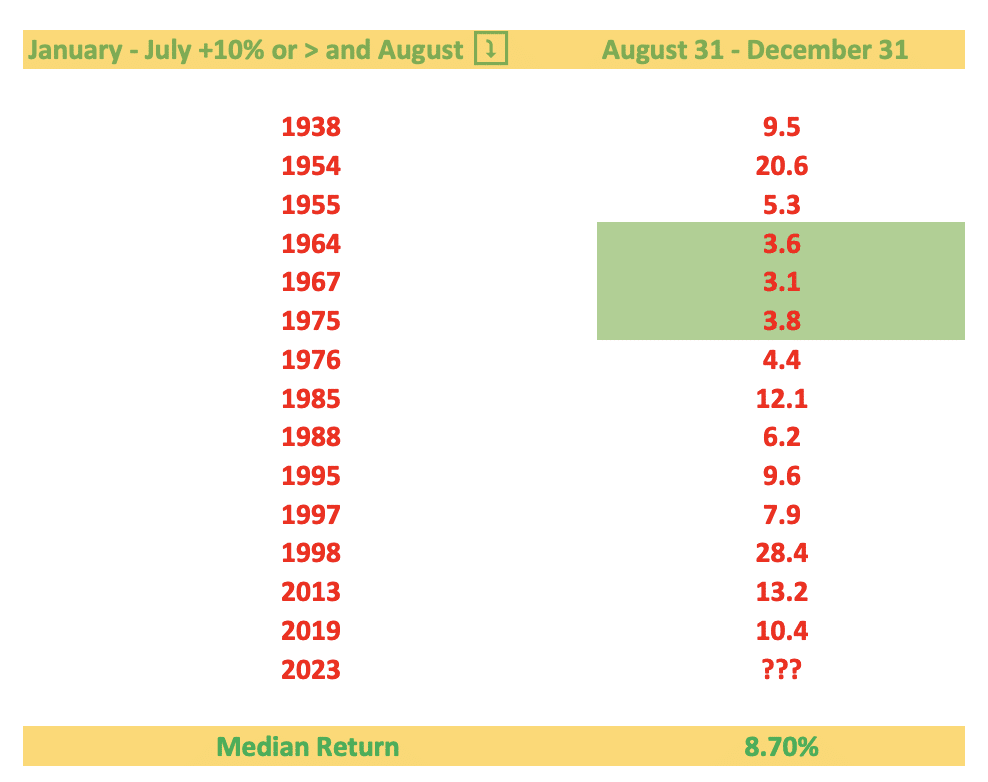
Even though the index is thus far up only 7 measly points, the worst return from August 31 – December 31, based on the stated criterion in the study, has been 3+ percent. Therefore, investors should anticipate at least another 3% upside into year-end and at most… well you see the data in that last column folks! Based on the last bullet point and table above, investors might anticipate at least another 3% upside into year-end. With this in mind, we should then also anticipate a strong start to the TOY Barometer period.
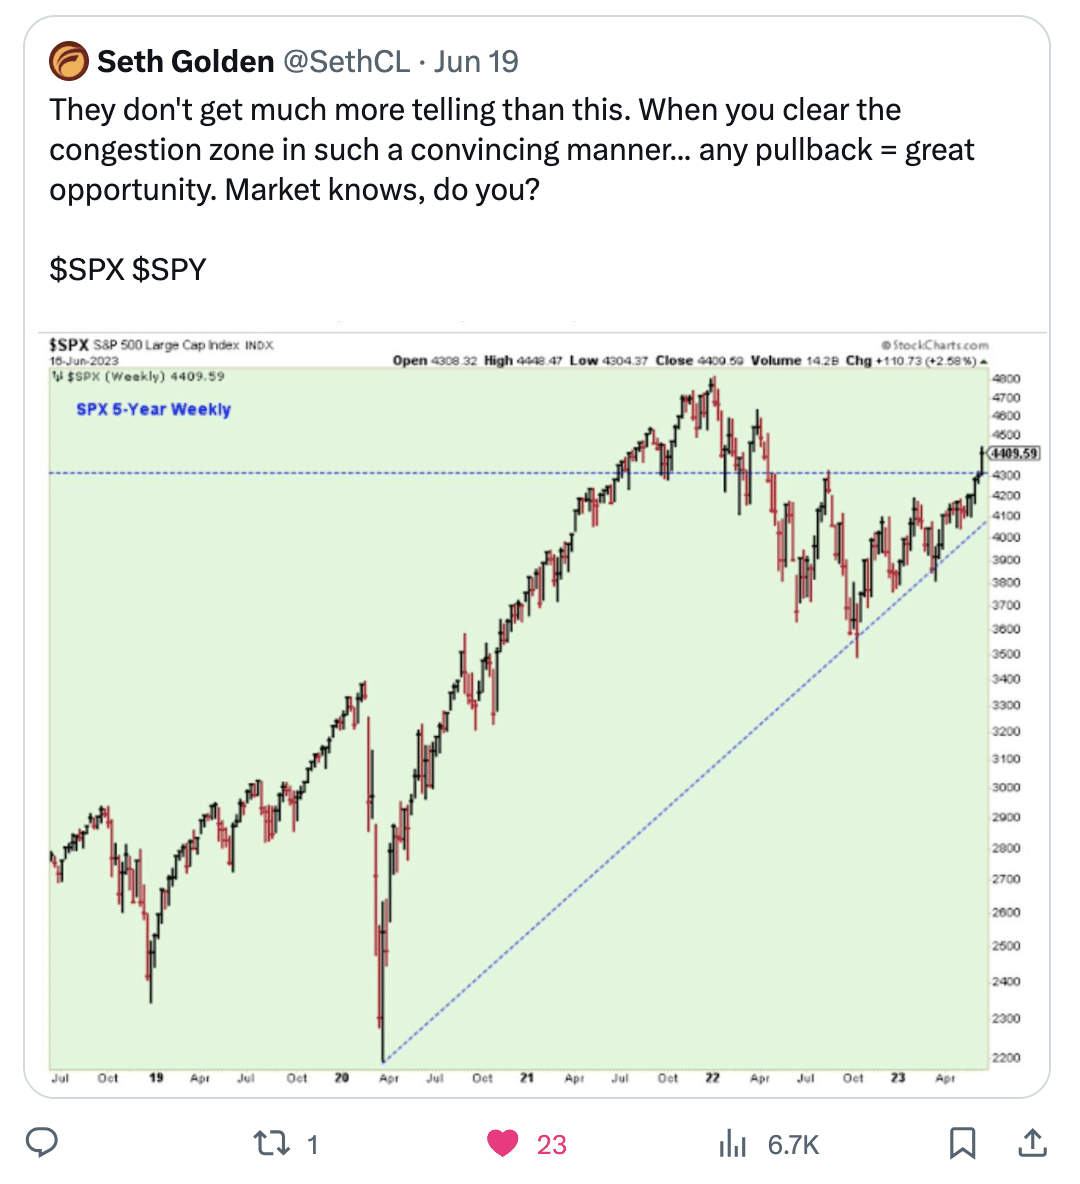
How amazing! Since this post, look at where the market eventually checked back to on the 5-year weekly chart? Trend line support was ~4,100 and the intra-week pullback closing basis low was 4,117 on October 27, 2023. The market knew, but did you trust?
TOY Time
Wayne Whaley was a quant before quants existed. He has a math background and has been managing money since the late 1980’s. One of Whaley’s goals was to identify what he called the “kingpin of seasonal barometers.” He stated:
“I implored my computer to take a few seconds to exhaustively study S&P performance over every time period of the year and determine which time frame’s behavior was proprietor of the highest correlation coefficient relative to the following year’s performance.”
What he found was there was a high correlation between the S&P 500’s returns between November 19th and the following January 19th and the S&P’s performance the 12 months following January 19. And since the 2-month period straddled the turn of the year (TOY) and the gift giving season, he called it the TOY Barometer.
Specifically, the period studied is November 20 – January 19 (if Nov 20 is on a weekend, use the Monday after the weekend, and if Jan 19 is on a weekend, use the Friday before).
If the return during this 2-month period was greater than 3%, a bullish signal was given, and the market was very likely to do well over the following 12 months. If the return was 0-3%, the signal was considered neutral, and results were somewhat random and in line with what is considered average. And if the return was negative, a bearish signal was given, and returns tended to be very poor.
Since 1950, there have been 37 bullish signals (including 2020), 19 neutral signals and 17 bearish signals. Let’s look at each signal group. (table below does not include bearish 2022 signal)
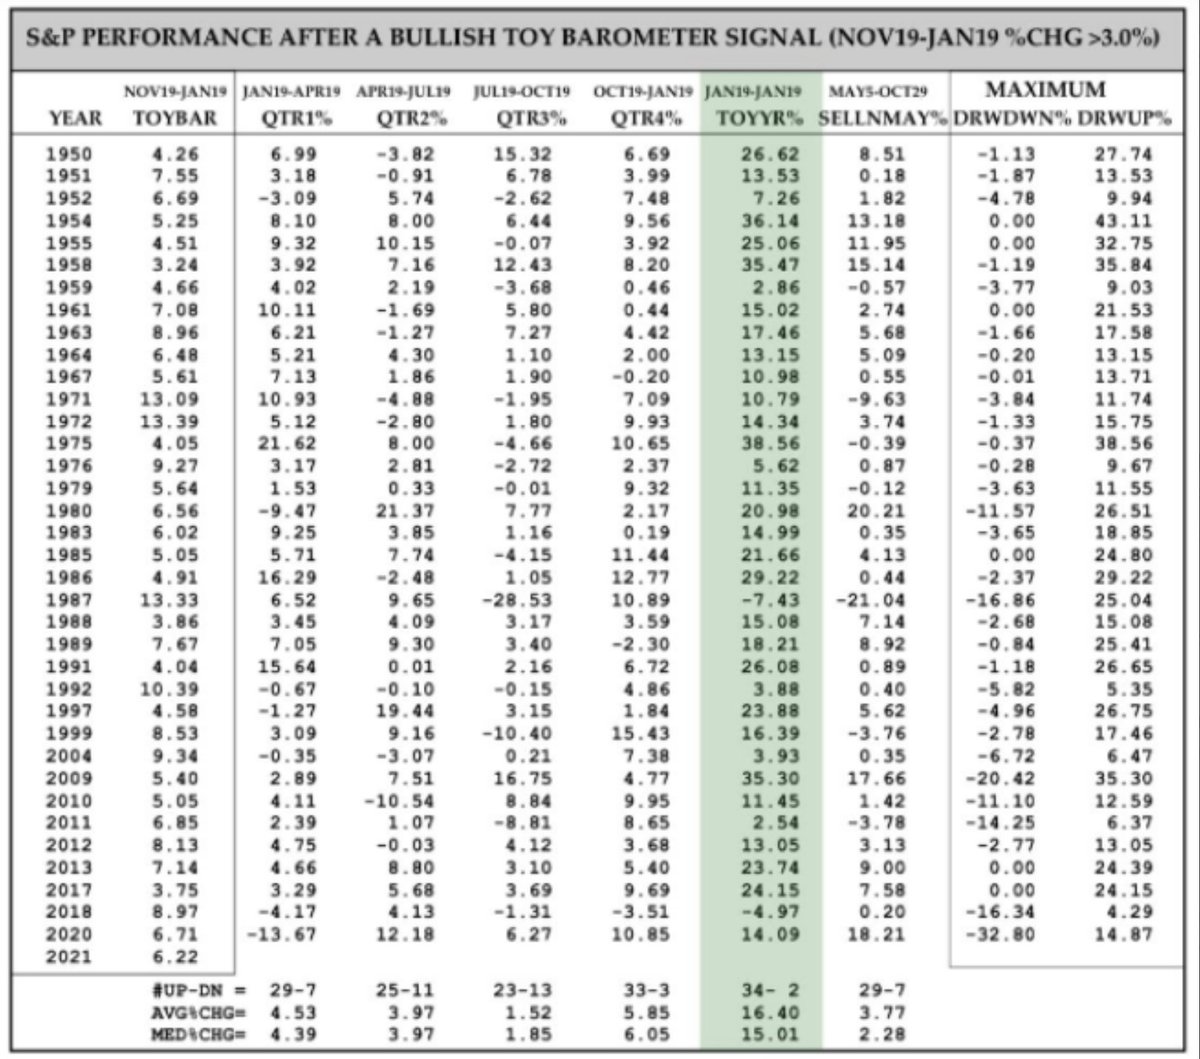
The 37 completed bullish signals have led to gains 33 times the following 12 months. The losses were in 1987, the year of one of the biggest single-day crashes in history, and 2018, that year that included a 20% drop during the fourth quarter.
But what about the post New Year portion of the TOY period that begins January 1 and concludes on January 19, 2024? Good question! So let’s look at January data below:
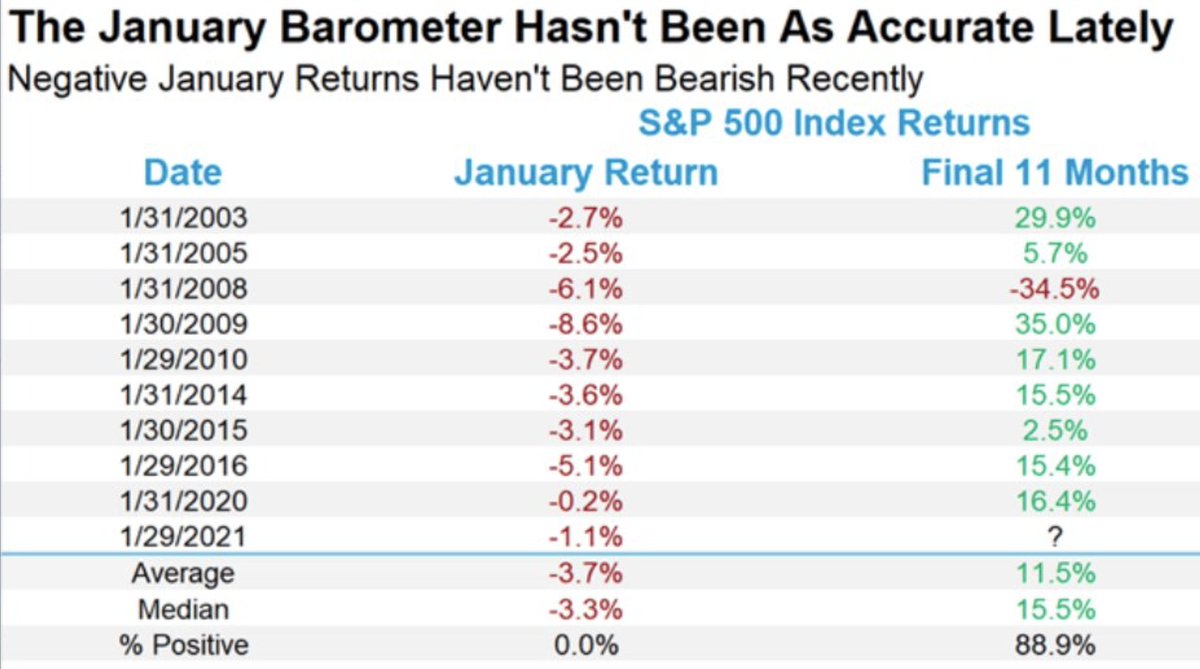
Did you know that based on the table above, I had determined it displayed that there was a 100% probability January would deliver a positive return in 2023? Do you know how I drew this conclusion from the table? Look at it closely and think about the years that are not shown vs. the years that are shown, and start only with 2008. If we perform this exercise here is what we discover about the monthly return for January:
- 08, 09, 10 ⤵️
- 11, 12, 13 ⤴️
- 14, 15, 16 ⤵️
- 17, 18, 19 ⤴️
- 20, 21, 22 ⤵️
- 3 DOWN, then 3 UP Januarys.
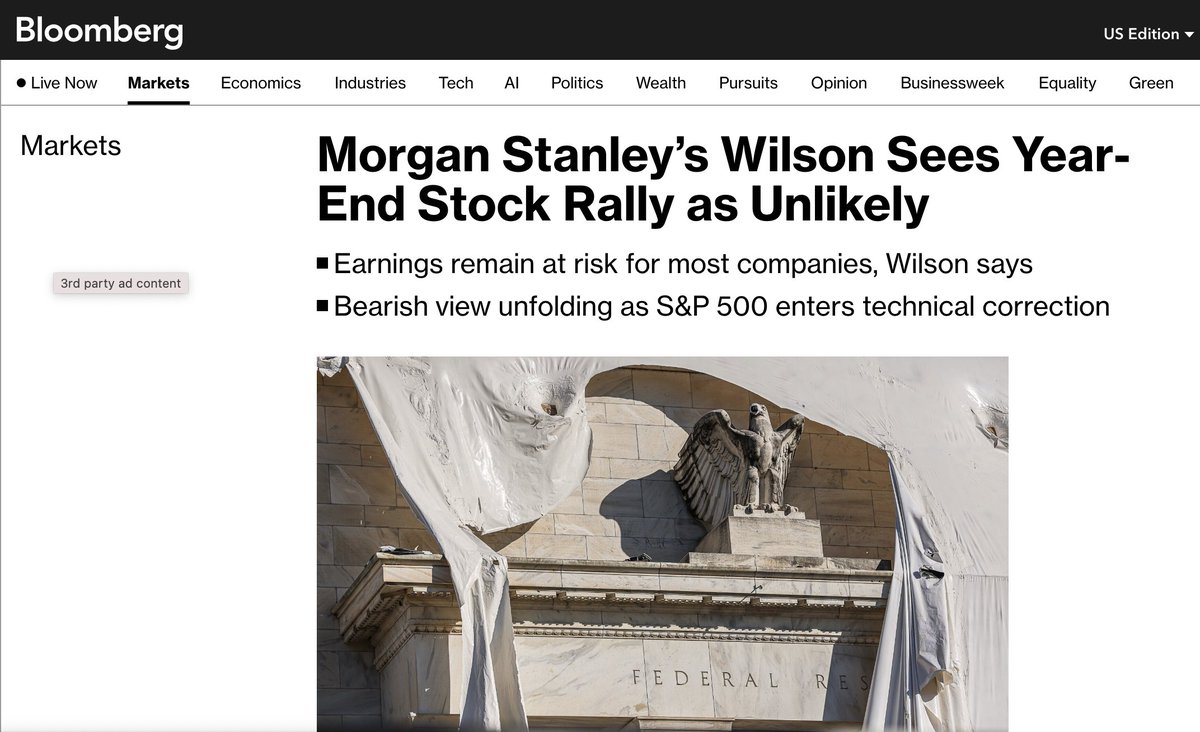
They are just people with titles, maybe a little more industry experience than you or me, and maybe articulate their thoughts and analysis in a compelling manner, but let there be no mistake about it, “NoBettaThanYouOrMe!” And this has been evidenced yet again with the infamous short-seller Jim Chanos. I’ve warned many an investor over the years that Chanos was a poorly disciplined investor, despite being heralded as the worlds greatest short-seller (see insights below). While Chanos may have done a good job relative to other short sellers, that does not mean it is a job worth doing!
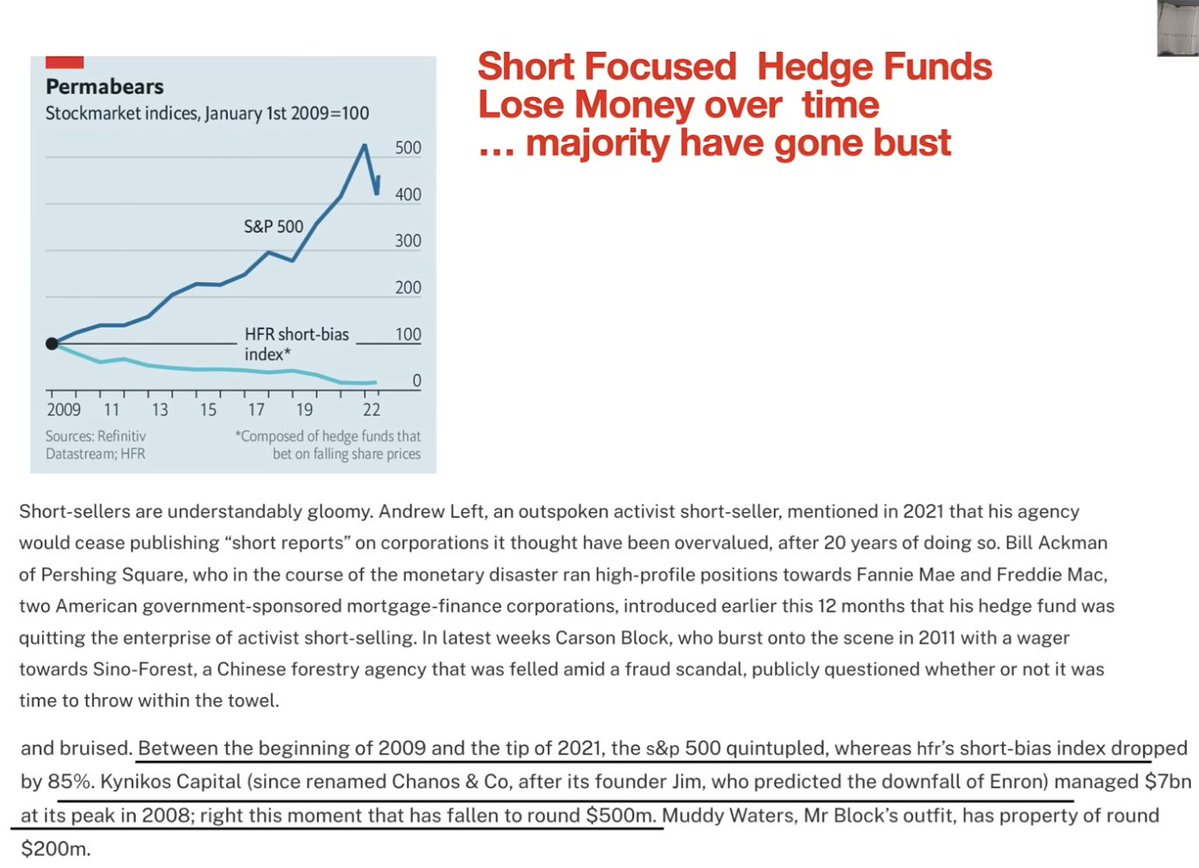
Jim Chanos is shutting down his hedge fund. He manages less than $200 million today, down from $6 billion in 2008. The funds are down some 4% this year while the S&P is up 18 percent. The biggest flaw for Chanos on the short side or the average fund manager from the long sided is that they are trying to be the next Peter Lynch, regarded as the world’s greatest stock picker of all-time. Stock picking has proven a dangerous game historically, but even more so since the invent of ETFs.
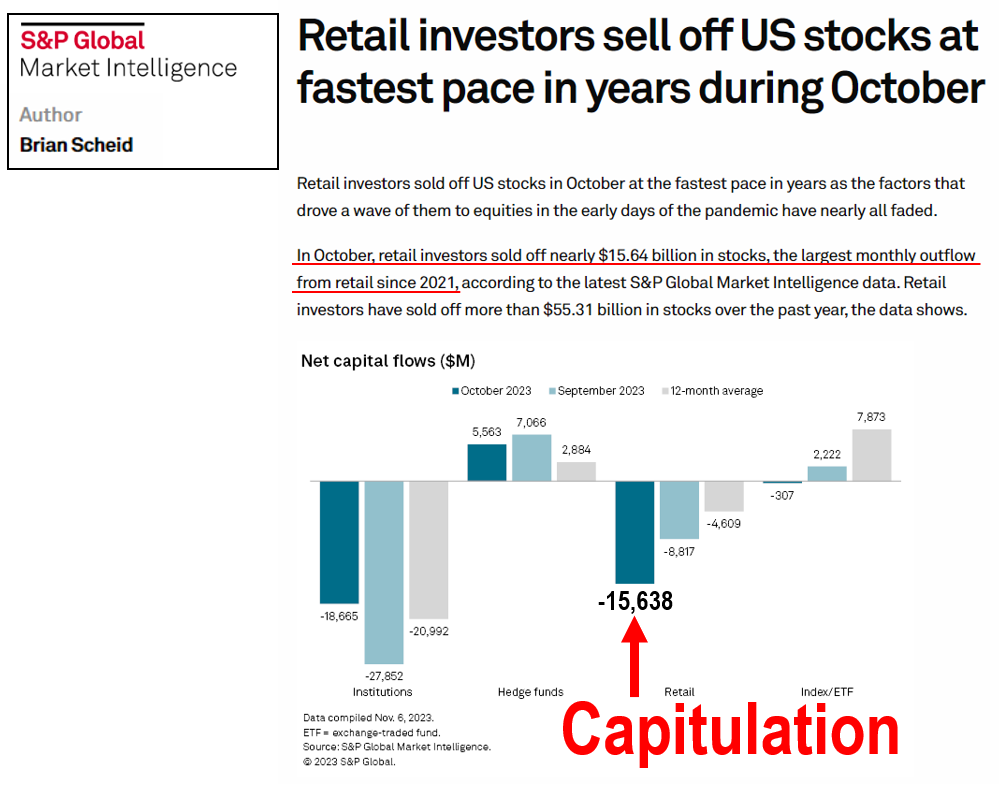
And if you desire to understand why so many investors and traders remain pessimistic about the market going forward, and angry about the recent 3-week rally through Op/EX week…? S&P Global noted (link here) that in October, retail investors sold U.S. stocks at the fastest pace in 2023 and the highest pace in 2.5 years. To me, that really speaks to the capitulation event that reached its maximum levels on 10/27. And we know that when investors capitulate, this allows stocks more headroom to rise even if the incoming data does not seem as supportive. ~Tom Lee
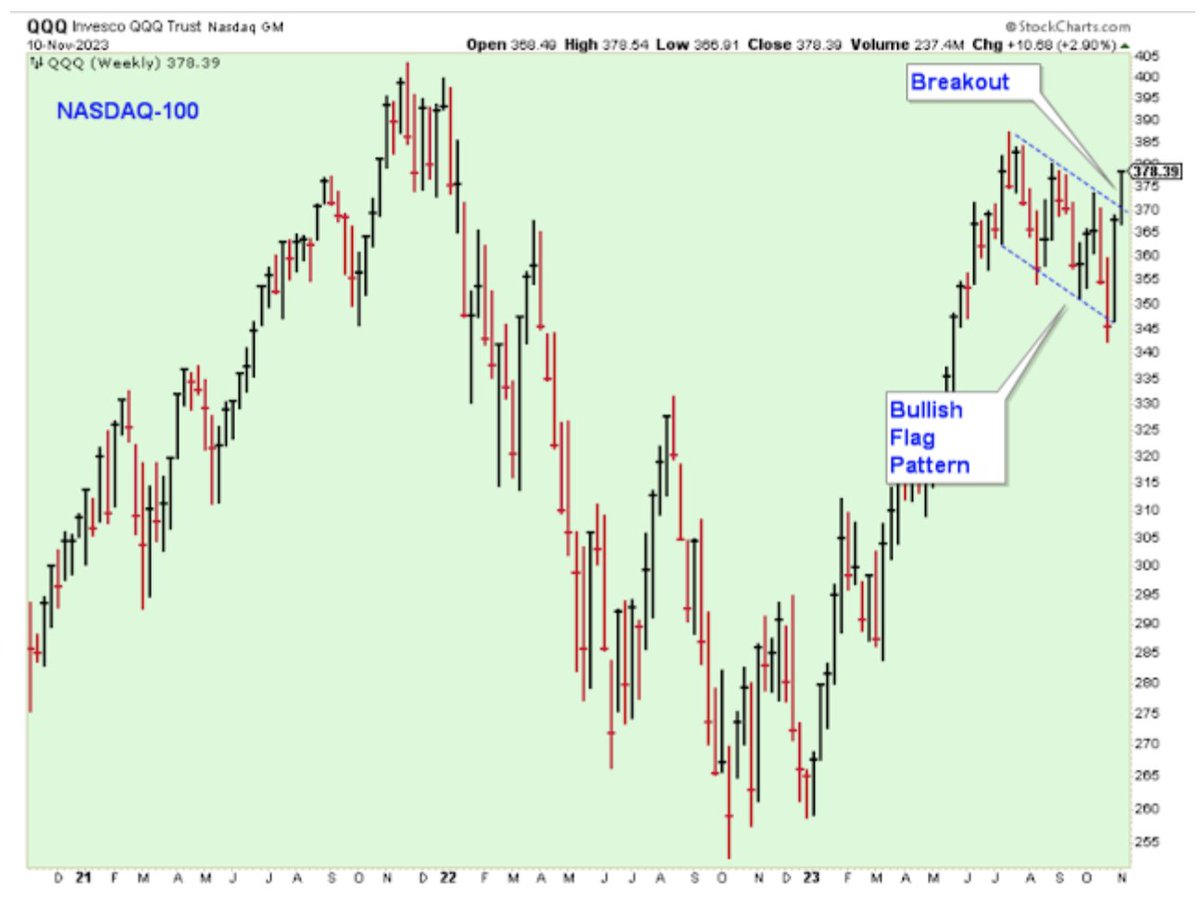
Seth Golden: Per Twitter/X post on November 10, 2023: “It is pretty. If you think otherwise, that is how wrong is done right!” The breakout is clear and present. Follow through was needed and follow through took place with another 4%+ upside.
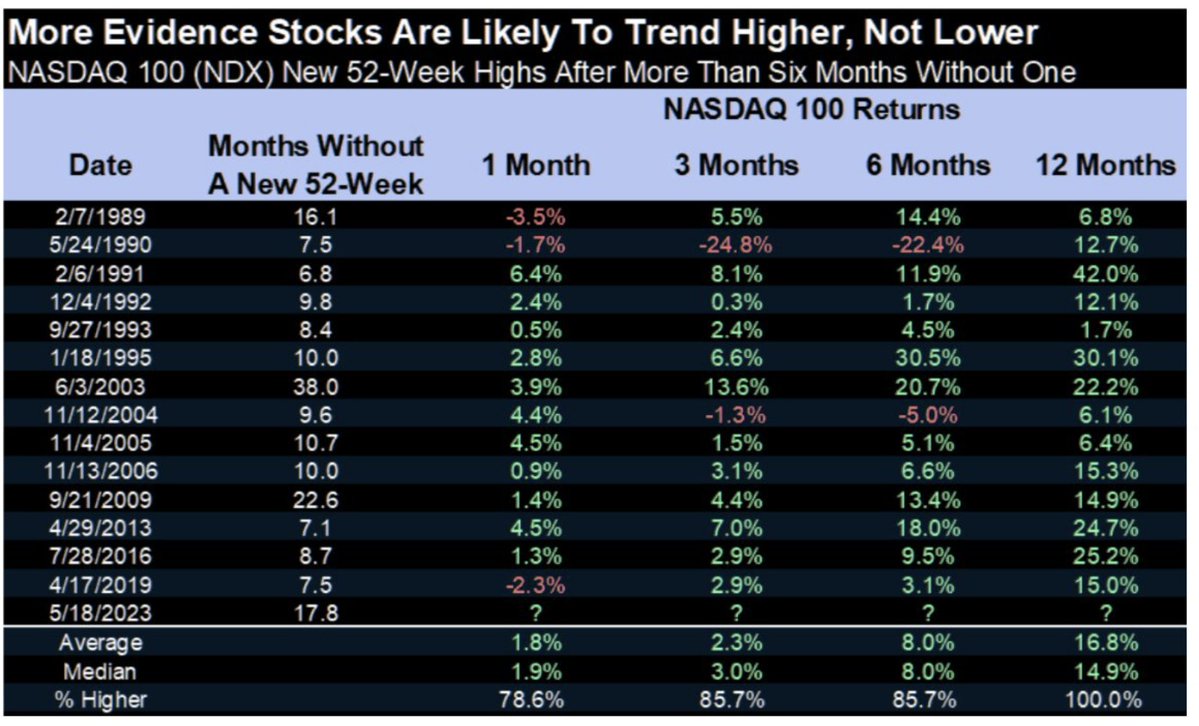
The Nasdaq 100 made a 52-week high (13,834) for the 1st time in more than 6 months on May 18, 2023. The forward positivity rate since 1989:
- 3mnth = 85%
- 6mnth = 85%
- 12-mnth =100%
- Median gain 6mnth =8%
- Median gain 12mnth = 15%
- So far, so good!
While the Nasdaq is considerably higher than the date of the 52-week high 6 months later, we now shift our attention to the 12-month forward positivity rate of 100% and median return rate of ~15 percent. Jut a heads-up: The Nasdaq 100 has already gained 16.5% since the May 18, 2023 achievement, and so investors should anticipate some volatility and/or multiple compression of the coming 6-month period.
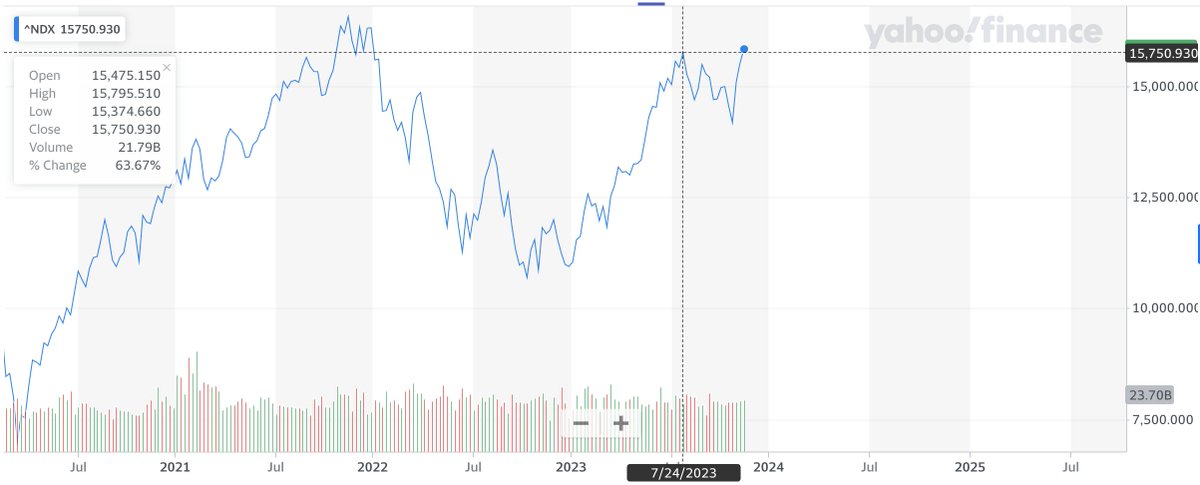
The Nasdaq 100 is within 4.5% of all-time high. Historically, the Growth-heavy index has never been within 5% of an all-time high, after a bear market, and failed to achieve a new all-time high within 8 months. Signal date 7/24/2023.
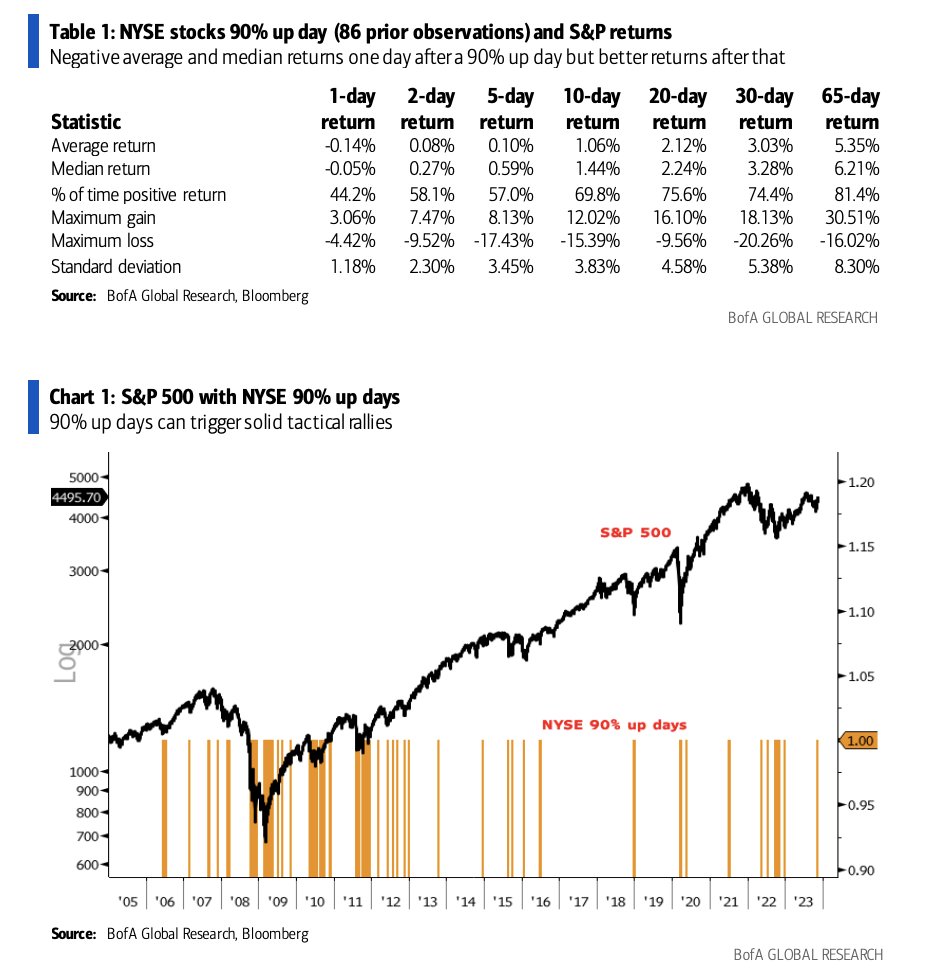
Bank of America Global Research: 93.6% of NYSE stocks advancing on 91.6% of volume (11/14) marked a 90% up day for stocks last week. Occurs when percentage of both advancing stocks and UVOL exceed 90%. This breadth day is a sign that the 4Q rally from late October can continue. Probabilities for higher prices is above average, as shown in the table above, going out 65 days.


