
A tortured heart does not sleep altogether well, and so I spent most of my waking hours publishing the following macro-market thoughts. Why a tortured heart, which will not be detailed here to any great extent, but to suggest that one need but not to look much further than their monitors and/or screens to see that which our fellow man has and continues to commit to action, as a justification for the action of others. There is no greater or lesser sin in the eyes of God; there is only love and forgiveness exampled and demanded. Let that be the final word from a tortured heart that knows the example has not found obedience for the assuaging of secular justifications. For those of you who know your boy, you know he’s a Christ follower, but know this does not suggest I am without sin or stand in judgement of others. Please read the following macro-market considerations, and have a great trading week all!
A note from within this past weekend’s macr0-market Research Report by Finom Group:
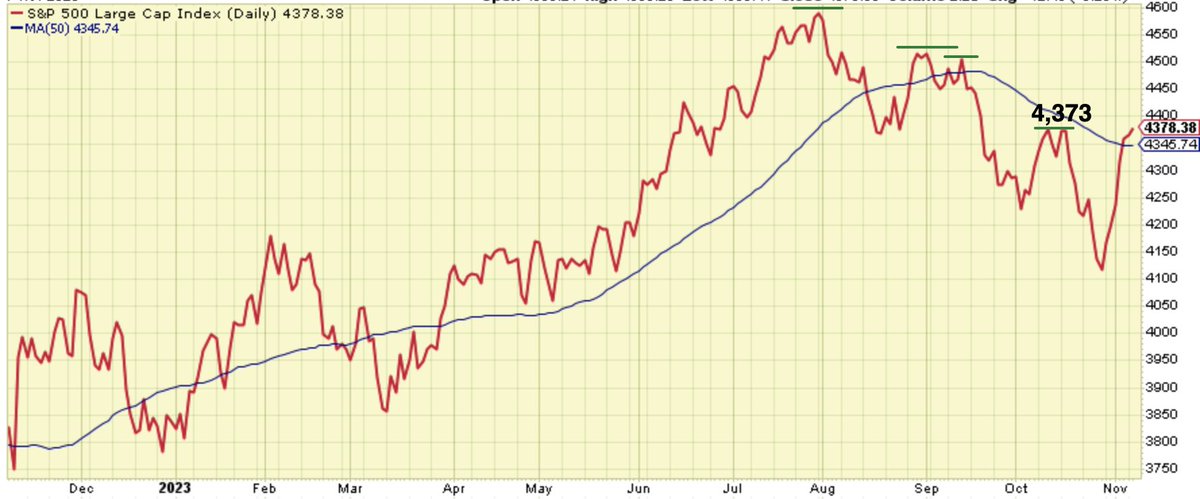
“The 1-year chart of the S&P 500 below depicts the rise of the benchmark index back above the 200-DMA (also 50-DMA), alongside the recent downtrend. Dashed lines depict a series of lower-highs. The pivotal closing value at 4,373 was the most recent peak value. It should come as no surprise that this past Friday, 4,373 is exactly where the S&P 500 found a ceiling and fell, but finished the day nicely higher at 4,358. The market knows where resistance is folks; the market knows! A close above this level in the coming days/weeks would supplant the renewed uptrend and higher probability of recapturing the 4,600 level and/or 2023 closing high of 4,588.”
With a broad year-to-date and more recent overview of the S&P 500’s performance, investors have been given an opportunity to allocate capital during the 3-month long corrective phase. Some took advantage of this opportunity while others pervaded their capital allocation decisions with notions of valuations, yield-curve inversions, a multi-decade low Equity Risk Premium, the S&P 500’s meager dividend yield when compared to bonds, and likely a litany of other variables. None of these variables, historically, have a reasonable correlation coefficient with forward 12-month S&P 500 returns, but most investors will convince themselves that these variables are “smart considerations” because they see and hear others use such market timing indicators.
In reality, and as the data from Bank of America Global Research proves (table below), none of the variables named or unnamed have a correlation coefficient that proves reasonable or practical. The closest variable for predicting forward 12-month S&P 500 returns is the Bank of America Sell Side Indicator.
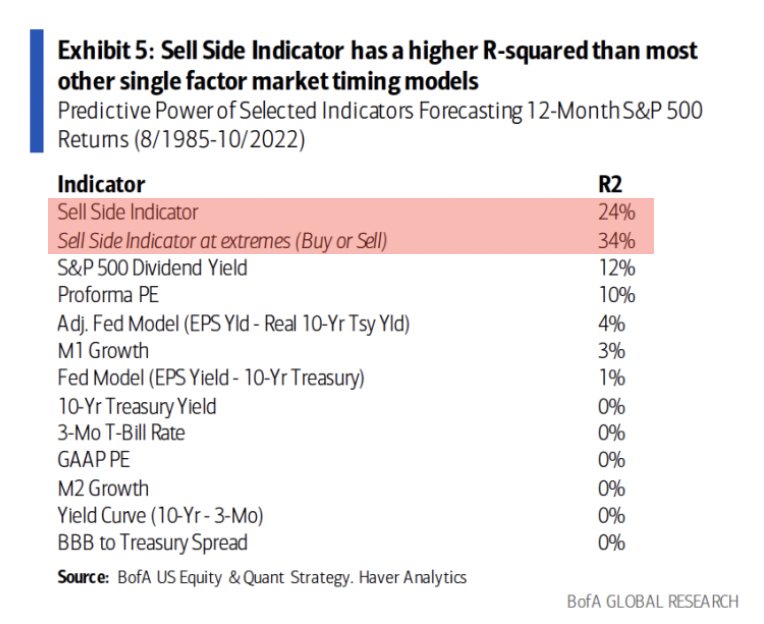
At extremes, the Sell Side Indicator has an R2 of 34 percent, a statistically insignificant correlation coefficient itself, but the greatest of all the outlined market timing tools noted. The bottom line: If an investor is looking for a reason to buy stocks/ETFs, cheaper prices should be the primary reason. Know that the market doesn’t like to deliver such an opportunity. As such, when the train leaves the station, it would behoove the investor to be on board, as the train doesn’t often reverse.
Moreover and throughout the corrective phase, Finom Group has encouraged investors to take advantage of “cheaper prices/valuations” when they present themselves. As the firm’s chief equity strategist, I’ve publicly outlined my rationale, which is backed-up by some 23+ years of equity market experience, 7-years of sell-side analytical experience, and the historical market data itself. In a tweet just a few weeks ago, and with obedience to a long-standing discipline…
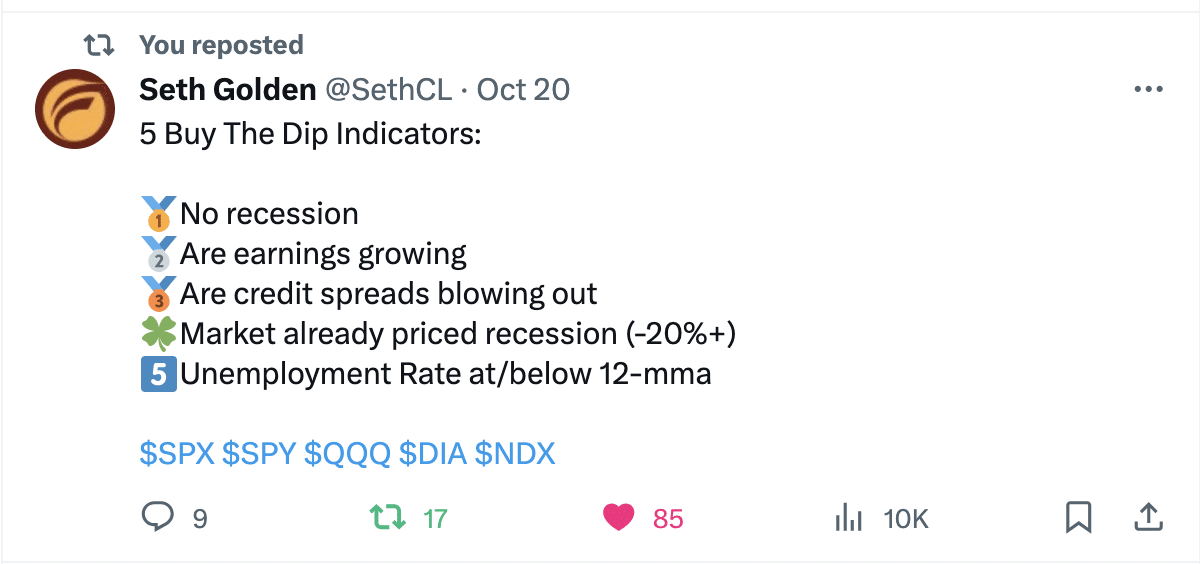
My “5 Buy The Dip Indicators” were all suggesting that any near-term correction/pullback should be deemed an opportunity to act, to allocate capital if not re-leverage one’s portfolio exposure to the equity market. If one had heeded the indicators… well, you get it! Are these the only reasons to have formerly suggested one should take advantage of the corrective market pricing? Of course not, and we all come to the markets humbly and with our own set of experiences and indicators that have proven of value, but these are mine 😉!
One such “buy the dip” addition or consideration we offered to Finom Group subscribers within our October 22, 2023 Research Report is as follows:
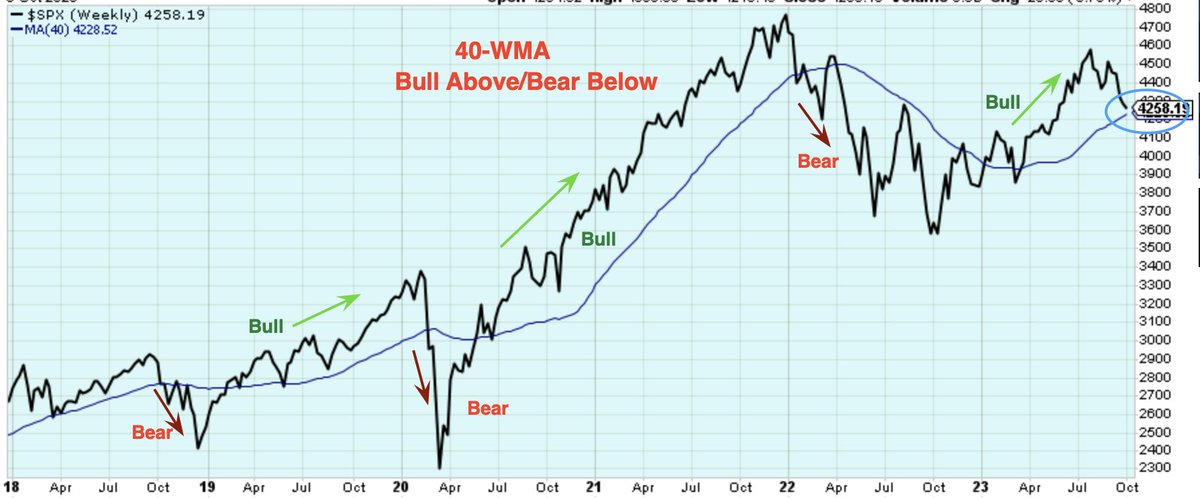
“During that period of early October, the market successfully tested the 40-WMA, then rallied nearly 4% into this past week’s peak, and before settling lower by week’s end. Two steps forward, 1-step 🥾 back.
As I highlighted in past Research Notes and reports, these 1-step 🥾 back moments in price action are likely buying opportunities when the key moving average is still sloping upward/higher.”
For the savvy technician and/or investor, the suggestion regarding upward-sloping, major moving averages (40-WMA and/or 200-DMA) is better understood with experience, and heeded with action/s. We hope you took action, if not only for the sake of possibly improving one’s cost average over the corrective period being discussed This is where the active portfolio manager finds advantage beyond the passive portfolio manager.
Another key consideration for investors during from Q3 to the current Q4 period is having an understanding of the key seasonal patterns, approaching the year-end period. While this may seem redundant, here is a look at some of the key data sets and seasonal conditions we utilized within our “buy the dip” framework… and within the same October Research Report:
“While breadth has continued to weaken, you can imagine that oversold conditions are likely forming, and have the potential to compound early this coming week. In fact, that would be my expectation by October 25th and not to sound too pessimistic. At this point in the year and correction, I maintain a few specific points of data that still prove highly relevant and with respect to forward S&P 500 performance. The first data point relates to the existing Zweig Breadth Thrust (ZBT) that fired on March 31, 2023. That remains a key point of emphasis for the bull market and bull market thesis over a 1-year period.
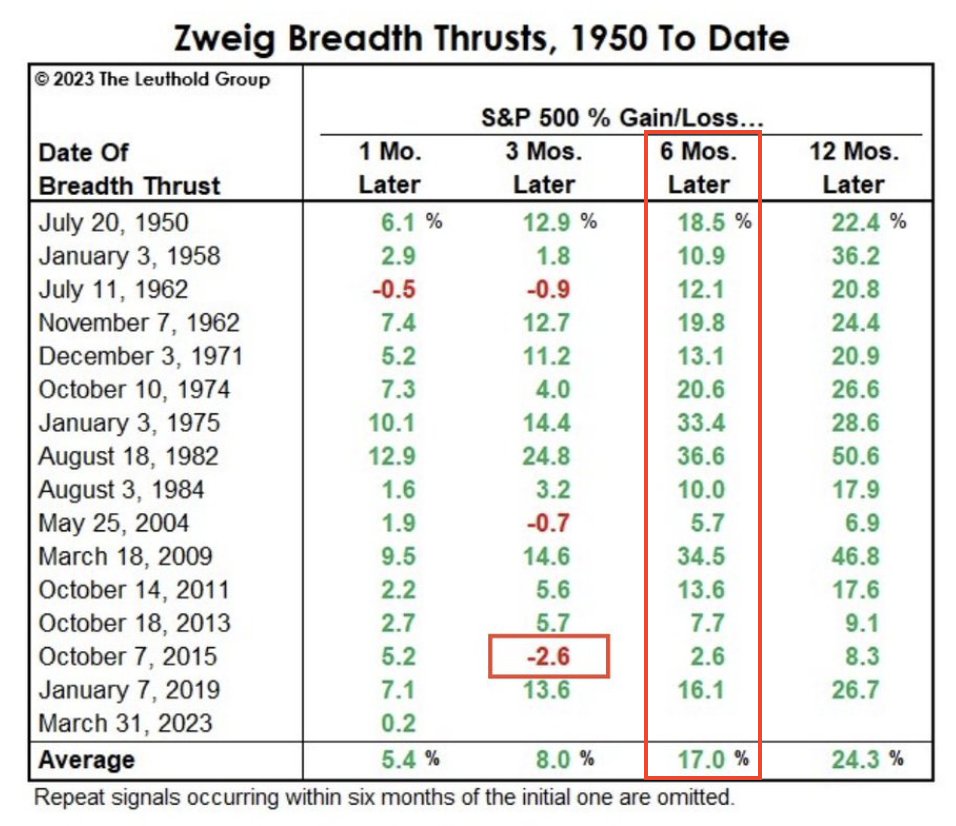
The bottom line here is that the S&P 500 has never been lower than the signal date price 6 and 12 months later. That has been true for the current signal staying above 4,109 to-date, the price on March 31, 2023. Should the market test this price in the coming weeks/month, the data suggests this is a BUY zone, as price should travel back above this level by March 31, 2024. If support is tested, but a more material breach below support is found, we would suggest there is likely some type of “credit event” in the works, and a “risk-off” environment has been established.
The second data set that remains in play and suggests investors accept the corrective wave for likely positive returns ahead identifies a clear seasonal pattern of returns in the Q4 period.
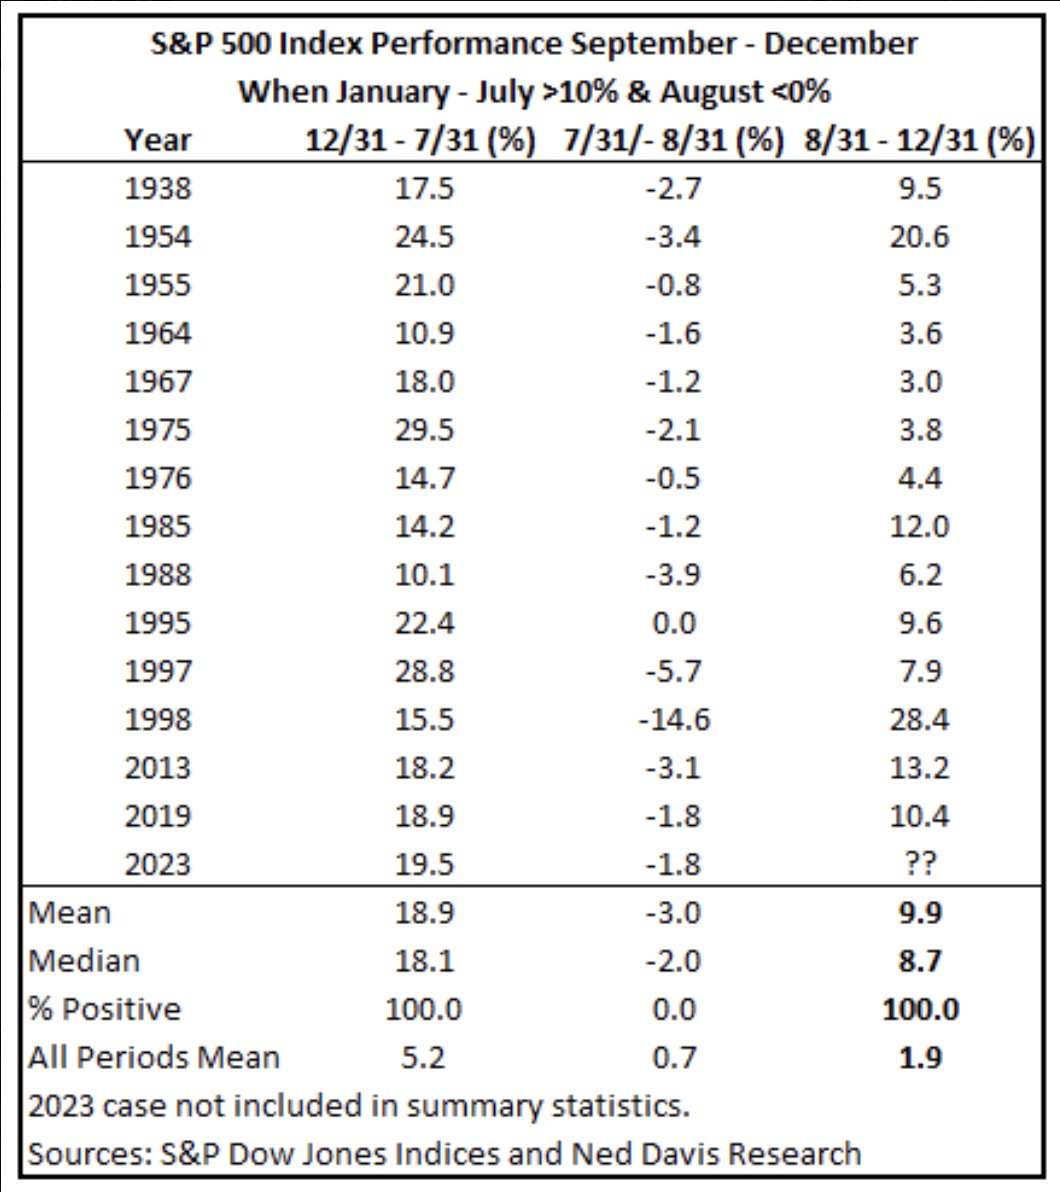
As outlined in the table from Ned Davis Research, when January through July returns are greater than 10%, and August produced a negative return, September through December was positive every single time since 1938. Look, it’s easy during a market corrective phase, where certain other studies have failed their near-term probable, forward returns, to dismiss such data/studies. Having said that, I encourage investors/traders to remember that Quantitative analysis (like this) is an investor discipline not unlike Fundamental and Technical analysis. Like any other form of analysis, sometimes Quantitative analysis will fail to produce the greater probabilities. That does not mean we should dismiss the discipline any more than we would dismiss Fundamental or Technical analysis.”
First (and no, firstly is not a word), the Zweig Breadth Signal proved the ultimate support zone for the S&P 500 during the corrective period under review (4,109 signal value on March 31, 2023). This was disseminated as a buy zone to Finom Group members, as part of our game plan outlined on October 26th.

If you took advantage of this buy zone, great! If not, why are you not a Finom Group member, with access to these insights, game plans and disciplines?
As for the seasonal quant study from Ned Davis Research also displayed above, let’s keep in mind that the S&P 500 closed the month of August at 4,507. The study indicates that “when January through July returns are greater than 10%, and August produced a negative return, September through December was positive every single time since 1938.” With this in mind, juxtaposed with the current S&P 500 price of 4,378, history suggests an extremely strong probability that the current market uptrend has “legs” to run. Or are you in the “there’s a first time for everything” camp? Gotta tell ya, pessimists often get “played”, and rarely get paid… based on the data of course.
This early in the morning (3:10 am ET), are we really going to talk macro-fundamentals… UUUUGGggghhhh! We get it, many think price action is often detached from macro-fundamentals, and they should. We are delivered backward-looking economic data in real-time, if that makes sense to you? What an investor learns over time, however, is that the stock market is not pricing that backward-looking, real-time data, it is pricing the forward 12-month EPS probabilities. So, one can see why more often than not most investors find investing confusing, as the headlines are often “out of step” with price action, quite often.
As the economy has proven more resilient than most anticipated at the onset of 2023 and since, as well as recession-defiant”…
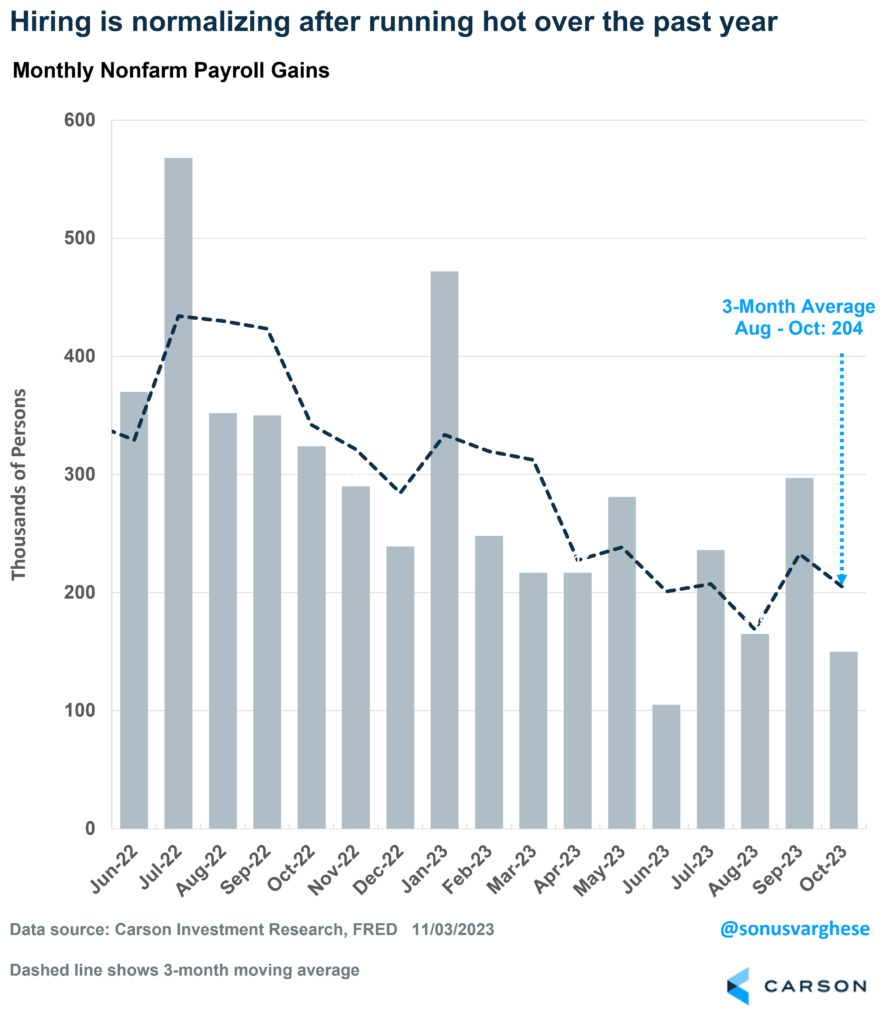
If we harken back to last week’s employment data (chart above from Carson Research), we recognize that the number of jobs created was among the lowest in the last couple of years at ~150,000 jobs created in the month of October. The Unemployment Rate also climbed to its highest level of the expansion cycle, and subsequent its cyclical trough. Certainly, such extremes will be hyperbolized in the financial media and by the macr0-punditry and/or equity bears, so let us examine the situation afoot within the labor market.
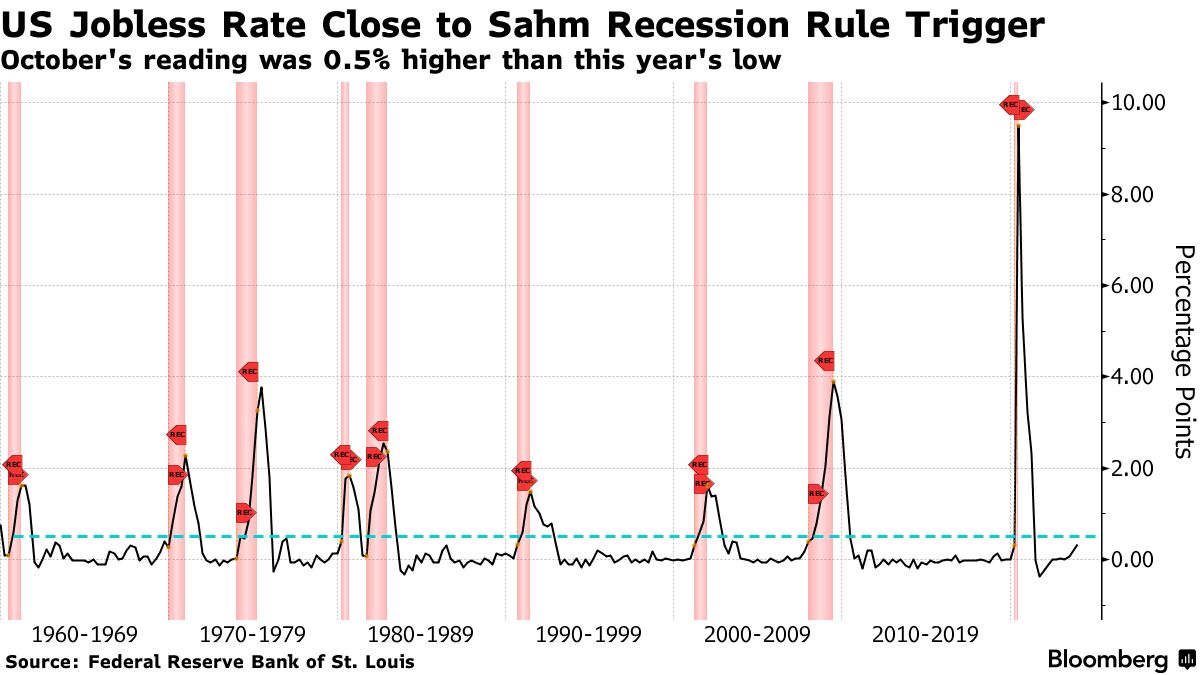
I want to start by looking at the Unemployment Rate. The rise from the lowest level of 3.4% to 3.9% is roughly .50bps. There is a longstanding recession signal surrounding the Unemployment Rate known as the Sahm rule. And it goes a little something like this… (tag, tag, tag team back again… no, too early?) Please see the chart and annotations below from Mark Ungewitter:
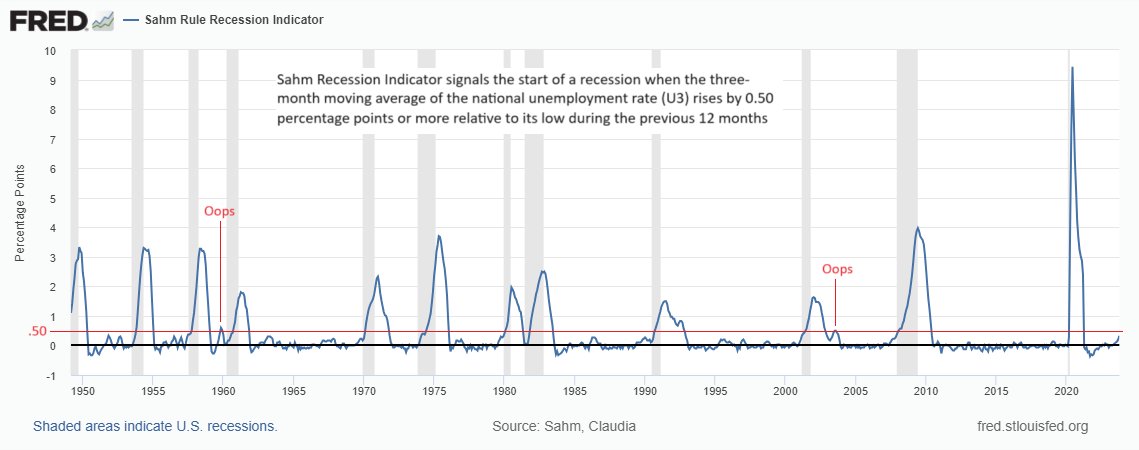
The Sahm rule has signaled a recession ahead of every recession in the post-WWII era. The rise in U.S. Unemployment Rate to 3.9% last month means joblessness is on the verge of triggering the Sahm rule, according to a recent Bloomberg piece, but necessarily the author and historian of the Sahm rule, Claudia Sahm.
“The Sahm rule–now 0.33 percentage points–did NOT trigger, nor is it right on the edge. Also, it has triggered *within* 3 months of prior recessions.” ~Claudia Sahm
To trigger the Sahm rule, it would need to reach 4.3% in November, or an average of 4.1% for November and December. It’s important when reviewing historical, economic data that we accept the following principle outlined by Ms. Sahm herself: “…a recession is not inevitable. Indicators of economic downturns like the Sahm rule are empirical regularities from the past, not laws of nature.”
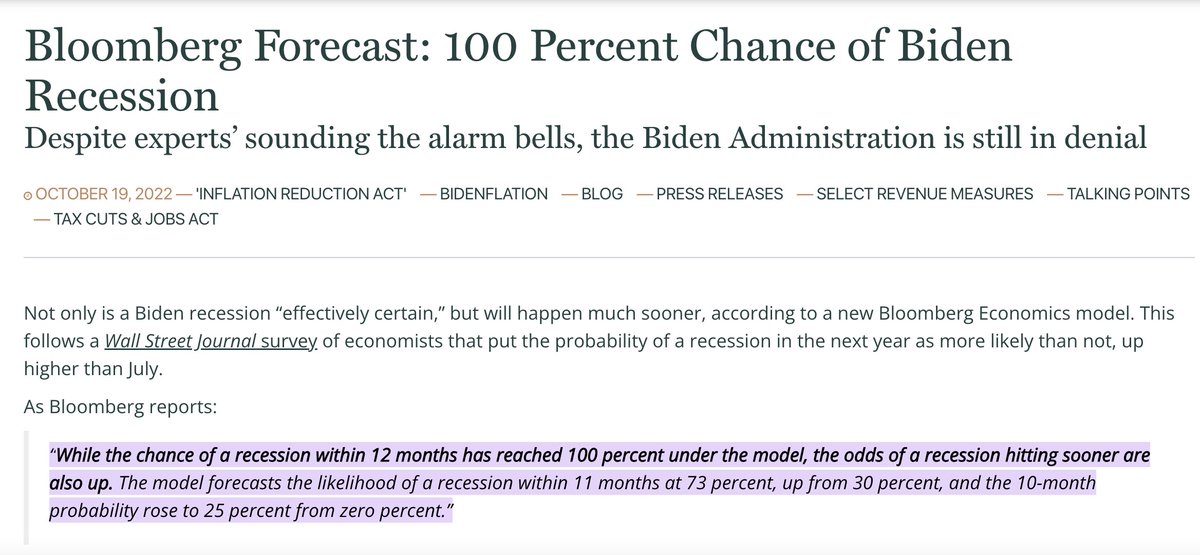
You might recall that in January 2023, the Father of the yield-curve inversion recession signal, Campbell Harvey, suggested that the current expansion cycle’s yield-curve inversion MAY NOT result in a recession, unlike the previous 8 inversion signals.
“My yield-curve indicator has gone code red, and it’s 8 for 8 in forecasting recessions since 1968 — with no false alarms,” Harvey, now a professor at Duke University’s Fuqua School of Business, said in a interview. “I have reasons to believe, however, that it is flashing a false signal.”
Back in January, one of the reasons Harvey gave for his potential first failed signal call is the fact the yield curve-growth relation has become so well-known and widely covered in popular media that now it impacts behavior, he said. The awareness induces companies and consumers to take risk-mitigating actions, such as increasing savings and avoiding major investment projects, which bode well for the economy. Another boost to the economy is coming from the job markets, where the current excess demand for labor means laid-off workers will likely find new positions more quickly than usual. In addition, he said, given the largest job cuts so far have been in the tech sector, those highly skilled recently fired workers are also not apt to be unemployed for very long.
Fast-forward to the present day, and a recession still has not formed, but we also recognize that the noted economists has since flipped his thesis in favor of a recession over the coming 12 months. We are only reviewing the yield-curve economists’ considerations for a recession, as a juxtaposition with the Sahm rule, because Claudia Sahm’s initial sentiment regarding the Sahm rule is akin to Mr. Campbell’s initial sentiment regarding the inverted yield-curve:
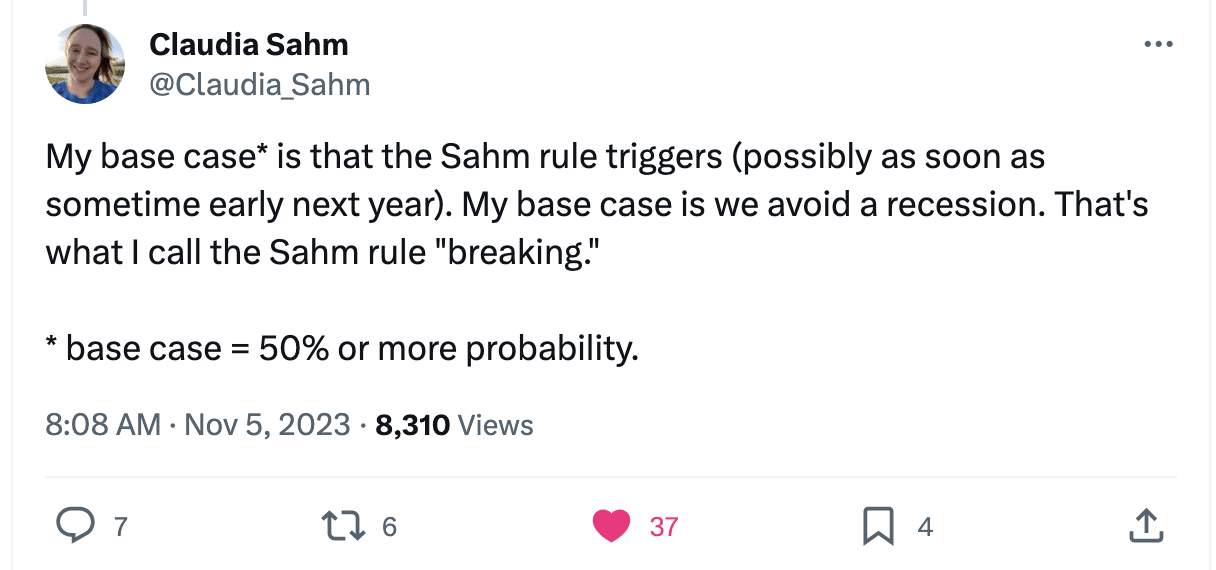
As shown in Ms. Sahm’s post above, like Mr. Campbell, her initial sentiment is that the Sahm rule will trigger, but prove a false recession signal. It would prove wise for a market participant to leave room for a flip-flop here as well. When the data changes, sentiment often changes, akin to the change in market price changing market sentiment.
While I loathe when folks say, “At the end of the day”, let’s consider my key “at the end of the day” economic fundamental, but also recognize that the labor market is still quite strong despite the softening within the most recent data. The U.S. economy is based on consumption, making up ~70% of GDP. As the consumer goes, so goes the economy! If the consumer or household is strong, the economy is likely strong or at least able to demonstrate positive growth. That has been the case since the economic reopening in late 2020 to-date. Rather than go on some long-winded rant about the median household balance sheet in the United States, which undeniably demonstrates how much better off the median household has proven relative to the pre-Covid era, I’ll replicate the most recent analysis from the team at J.P. Morgan, as follows:
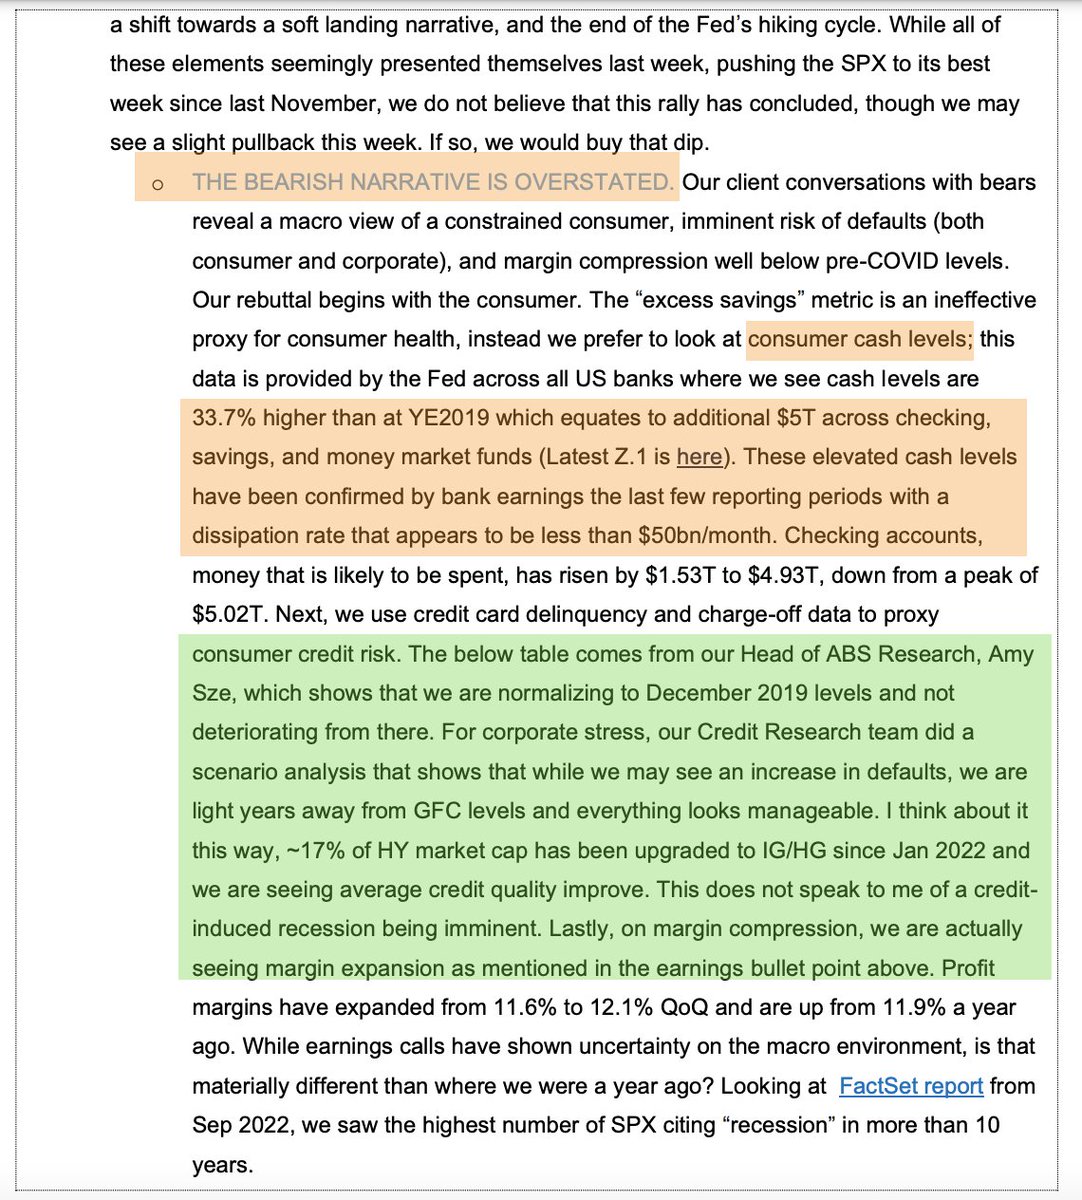
The note above covers the gambit, from the economy to the corporate trending fundamentals, ultimately what has the markets’ attention. And while the punditry will “yea but” the trends and facts to their own detriment, as measured by portfolio underperformance or with opportunity cost, even the concerns about credit rates and absolute levels of credit/debt may prove, in the words of J.P. Morgan, OVERSTATED!
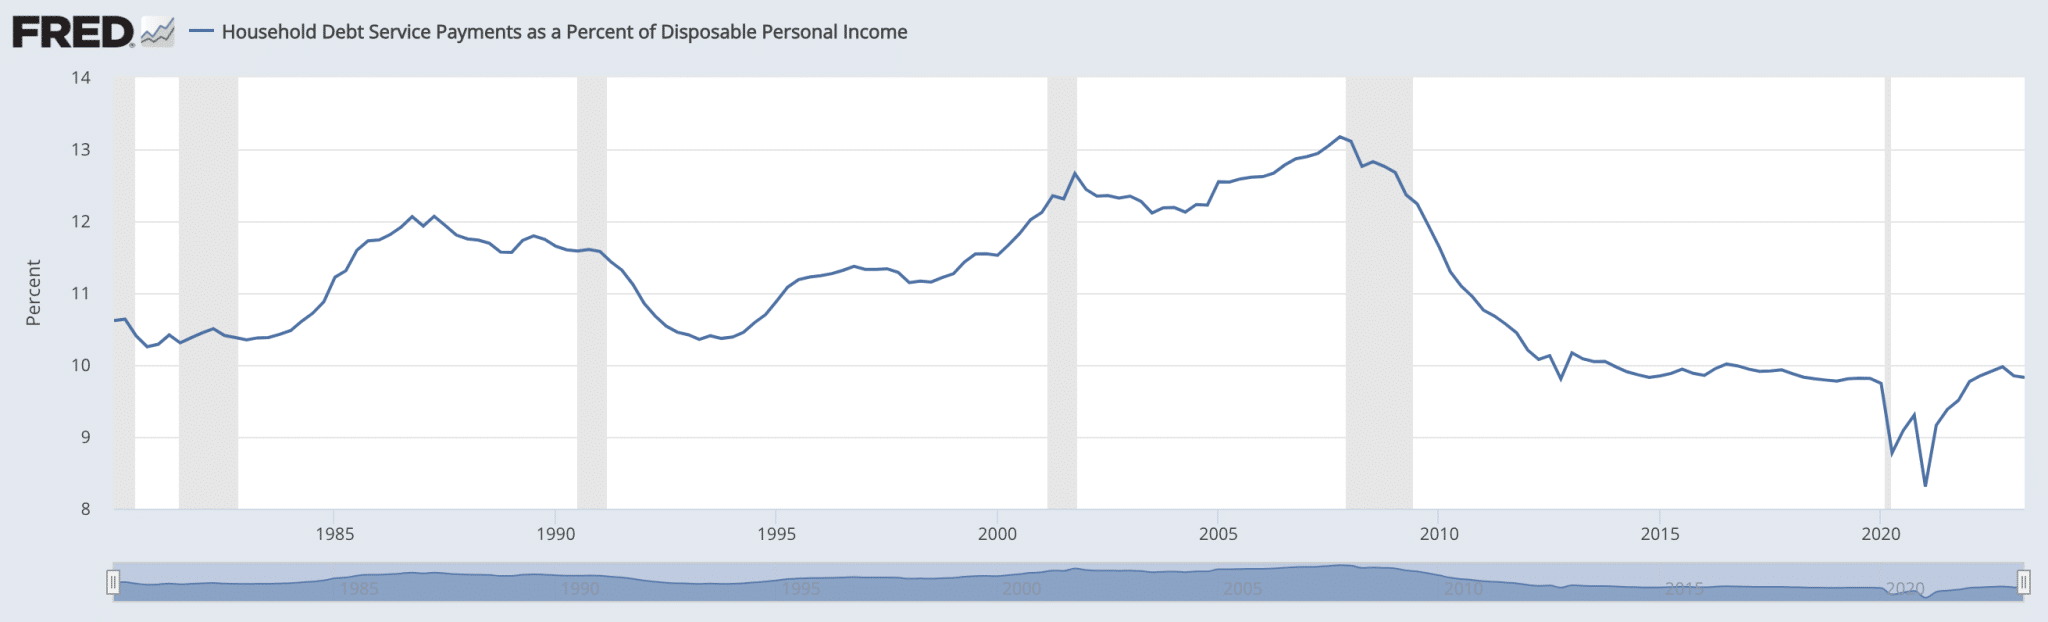
The following government data is what I’ve long-since understood to be the most basic, yet broad-based measure of the household balance sheet’s strength and/or weakness, The lower the Household Debt Service Payments as a Percent of Disposable Personal Income ratio, the better the household balance sheet. If we extract the 2020-Covid anomalistic plunge, we can recognize that despite the record level credit card debt and rising delinquency rates, the household balance sheet is still on trend with the pre-Covid economy, which proved the longest expansion cycle in U.S. history (post-WWII).
Last, but certainly not least and for those prone to headline fear, when we look at both bank and retail credit card delinquency rates (table below), the only thing we actually have to fear is the hyperbole that resides within the headlines. Either we have the appropriate information and/or insights or we don’t. I would suggest one study the business model of the media to better understand the probabilities of said media for outlining the appropriate information and/or insights, as it pertains to the practical needs of investors.
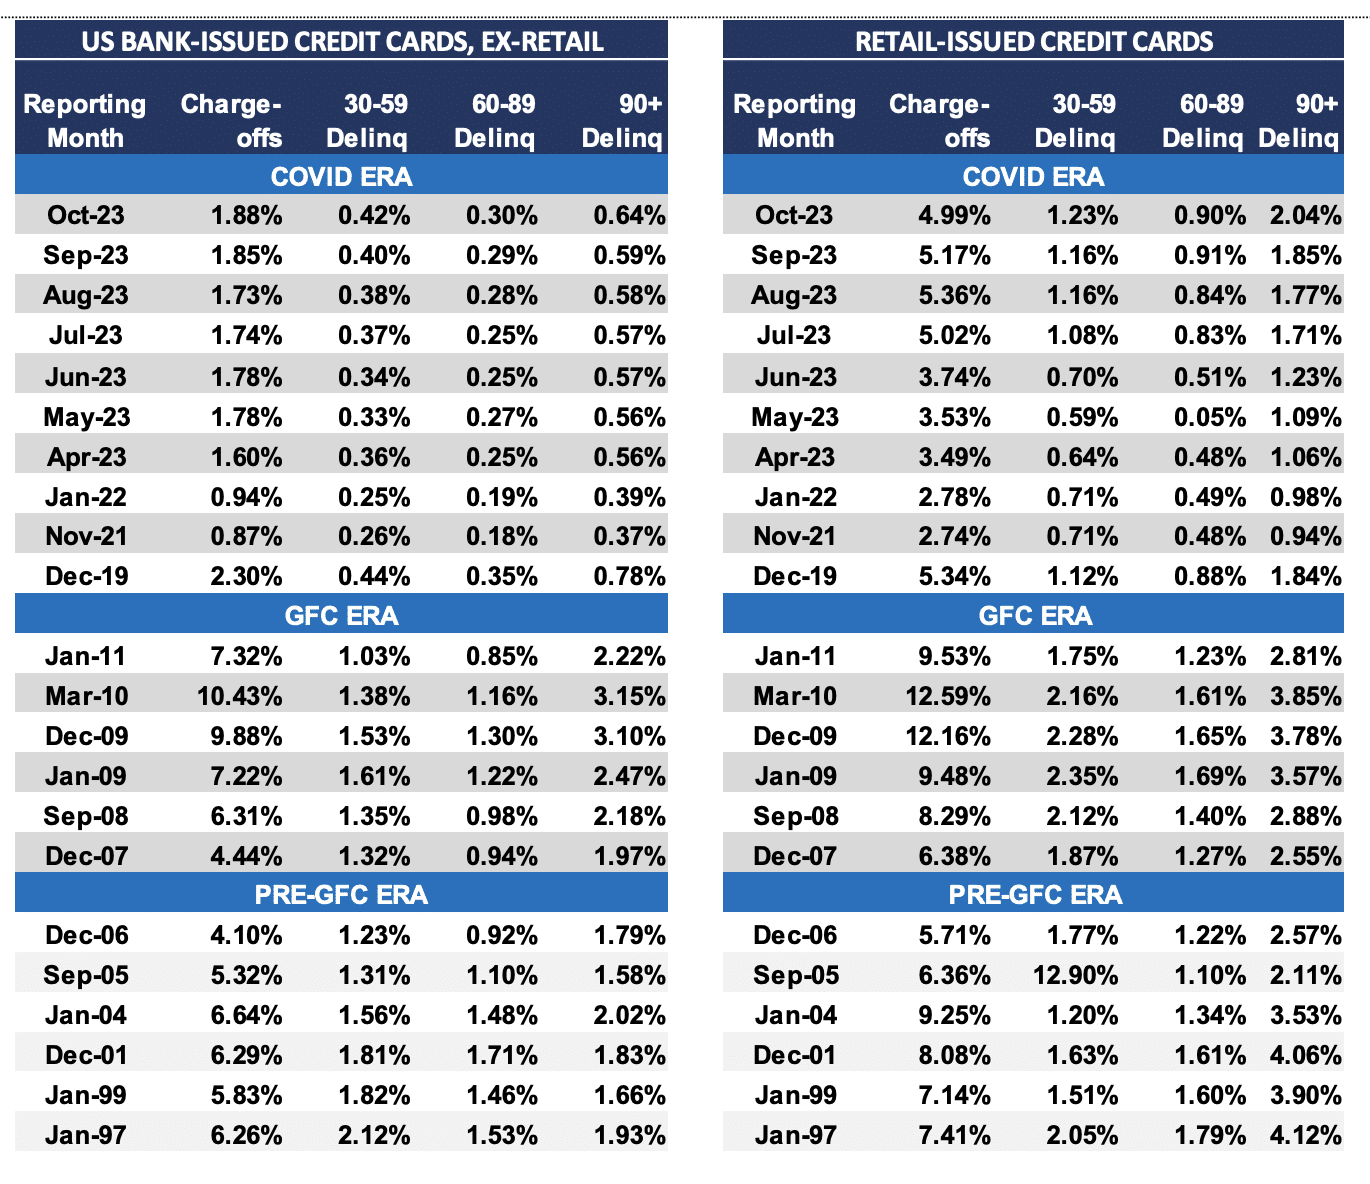
If we look at the Covid-Era left and right-side of the table for Bank-Issued and Retail-Issued credit card delinquency rates, we can recognize that delinquency rates are absolutely rising, and for both categories. Having said that, the absolute levels found leading up to or during previous recession were far higher than that of the present day. Do you like apples Mr. Punditry (Good Will Hunting)? Asking for a friend!
Here is where I ask macro-market participants to consider the following. The Fed just hiked rates at the fastest pace in history, inverting yield-curve to deepest point since 1980s, with Leading Economic Index negative ~16 consecutive months… and yet a recession was still not found. Think about it like an old man taking a bath. Policy went from trying to push the economy into a recession like forcing an old man into a bathtub, to macro-economists opining the potential for the economy to ease naturally into a recession like an old man easing into a bathtub? The last time we eased into this economic bathtub was 34 years ago, and not since. We’re opining over the least probable outcome based on already failed efforts to amplify and forcibly bring forth a recession, after the market has likely already priced a recession in 2022 via large-caps and in 2023 via small-caps. How much logic are really using when considering capital allocation and fielding the daily headlines and litany of data.
Signed,
💔
A Tortured Heart


