
Welcome to another trading week. In appreciation for all of our Basic Membership level participants and daily readers of finomgroup.com content, we offer the following excerpts from within our weekly Research Report. Our weekly Research Report is extremely detailed and has proven to help guide investors and traders during all types of market conditions with thoughtful insights and analysis, graphs, studies, and historical data. We encourage our readers to upgrade to our Contributor Membership level ($14.99/monthly, cancel anytime) to receive our weekly Research Report and State of the Market videos. Have a great trading week and take a look at some of the materials from within this week’s Research Report…
Research Report Excerpt #1
Will it be different this time; after an already seasonally weak period for markets, considering yet another geopolitical conflict/war was likely not on the average investor’s list of significant considerations in the usually strong Q4 period?
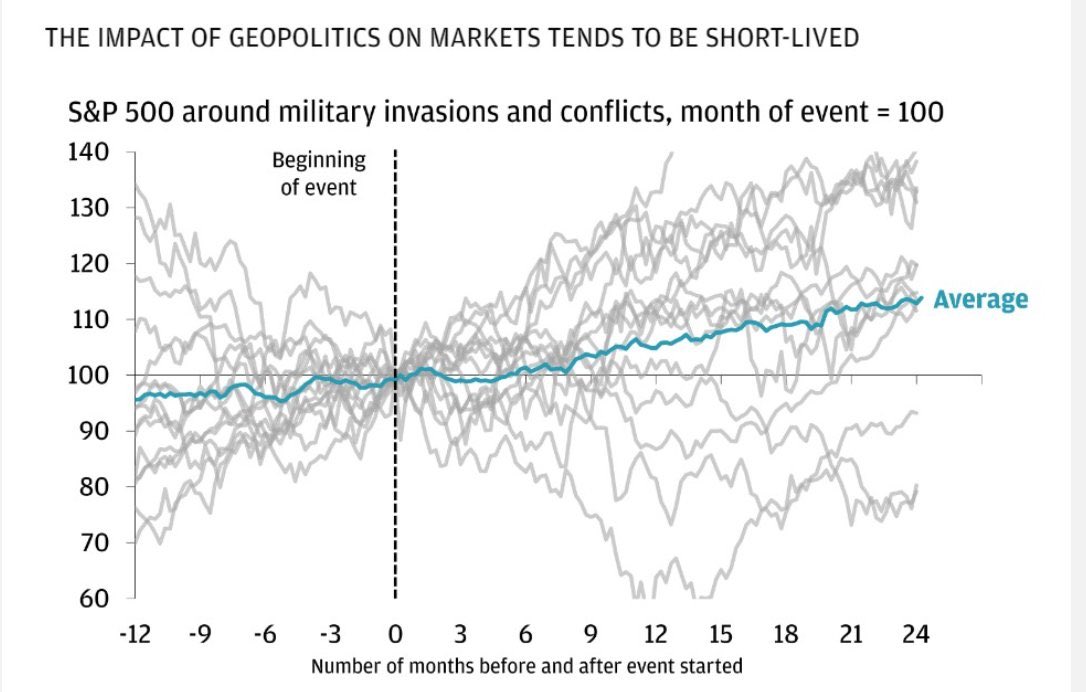
Moreover, it is important to keep in mind that headlines typically have more impact than the actual War events on markets and investor psyche. Declines are usually short and shallow, if at all; recoveries are rapid if needed at all.
Research Report Excerpt #2
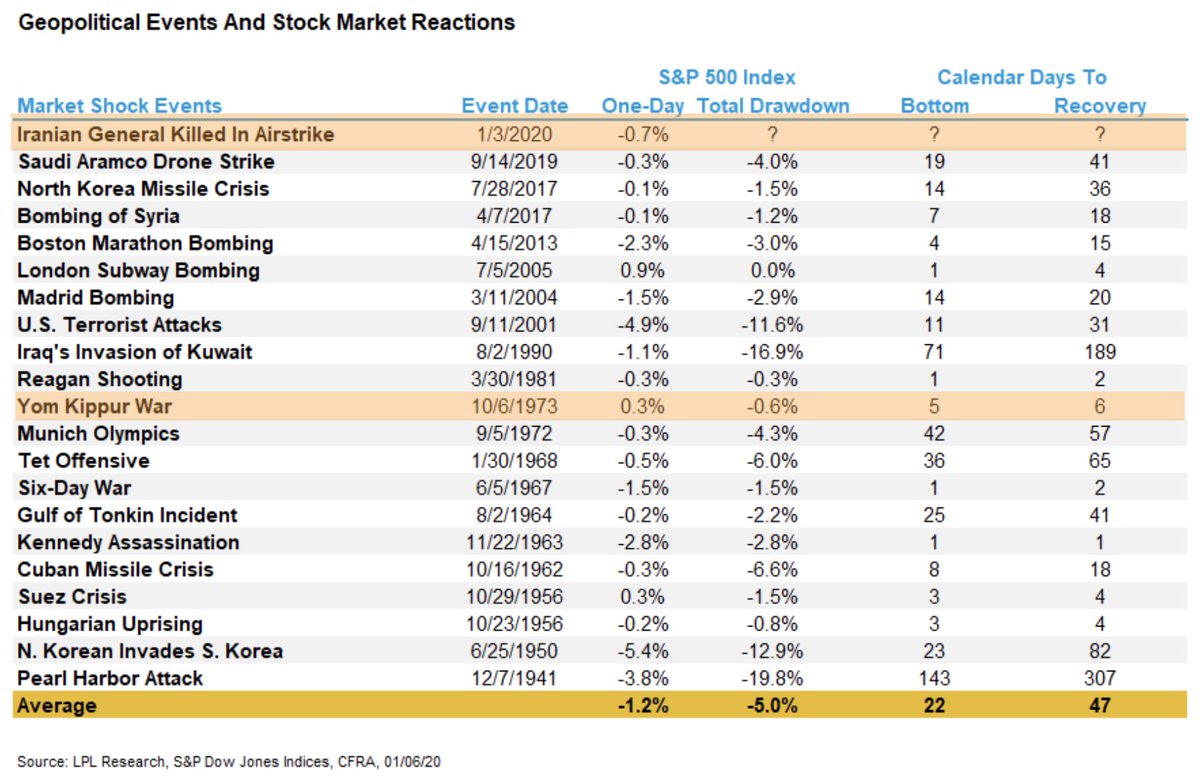
Even though the S&P 500 has grown about 8% per year since 1950, there have been 33 drops of 10% or more, and 11 drops of 20% or more.
Research Report Excerpt #3

Initial conditions” surrounding last October’s bottom (including a fully-employed economy, Fed tightening, and historically high valuations) all argued against the launch of a sustainable bull market. We therefore shouldn’t be surprised to see that “Year One” gains in many key indexes have been the weakest ever observed in the first year off a major low. New records for futility were set by the Russell 2000, NYSE Composite, Value Line Arithmetic, Value Line Geometric, S&P Financials, and KBW Bank Index. All but the NYSE Composite are indexes we’d expect to trounce the S&P 500 during the first year of a new bull market.
Research Report Excerpt #4
To embellish and elaborate on Mark Newton’s succinct technical notes, I would reinforce that there has been limited index damage this past week, and some follow through to the downside in the early portion of the coming trading week may be in the works as investors seek to insulate their portfolios by raising cash levels. If this is to occur, I remain of the view that the 40-WMA is strong support for the S&P 500, as it was proven to be so 2 weeks ago.
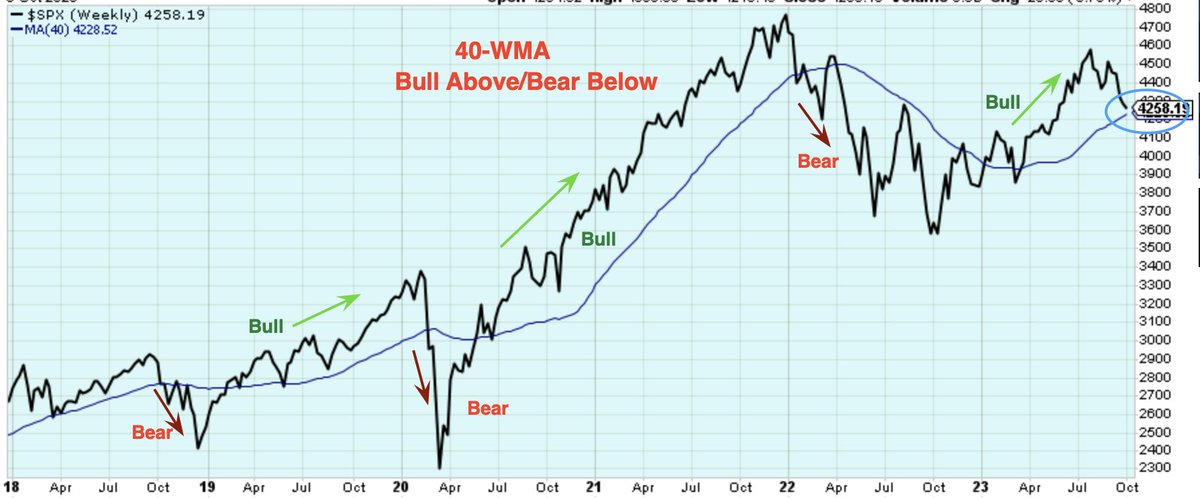
During that period of early October, the market successfully tested the 40-WMA, then rallied nearly 4% into this past week’s peak, and before settling lower by week’s end. Two steps forward, 1-step 🥾 back.
Research Report Excerpt #5
While this past week’s rise in the VIX may spell yet still additional downside in the major averages in the coming week, a recent VIX signal suggests the decline in the S&P 500 should prove limited, unless there is real “spillover effects” from the developing Israel/Hamas conflict.

The VIX rose to its highest level in 84 trading sessions on October 3rd. Subsequently, it reversed lower, triggering a BUY signal for the S&P 500. The previous alert in March 2023 led to a 12% gain over the subsequent six months. “Similar alerts produced excellent outcomes for the S&P 500 over medium and long-term horizons. Results were slightly more favorable when precedents occurred in October or within a long-term uptrend like now. Expected volatility across several asset classes suggests broad-based fear, typically a bullish sign for stocks.” ~SentimenTrader
Research Report Excerpt #6
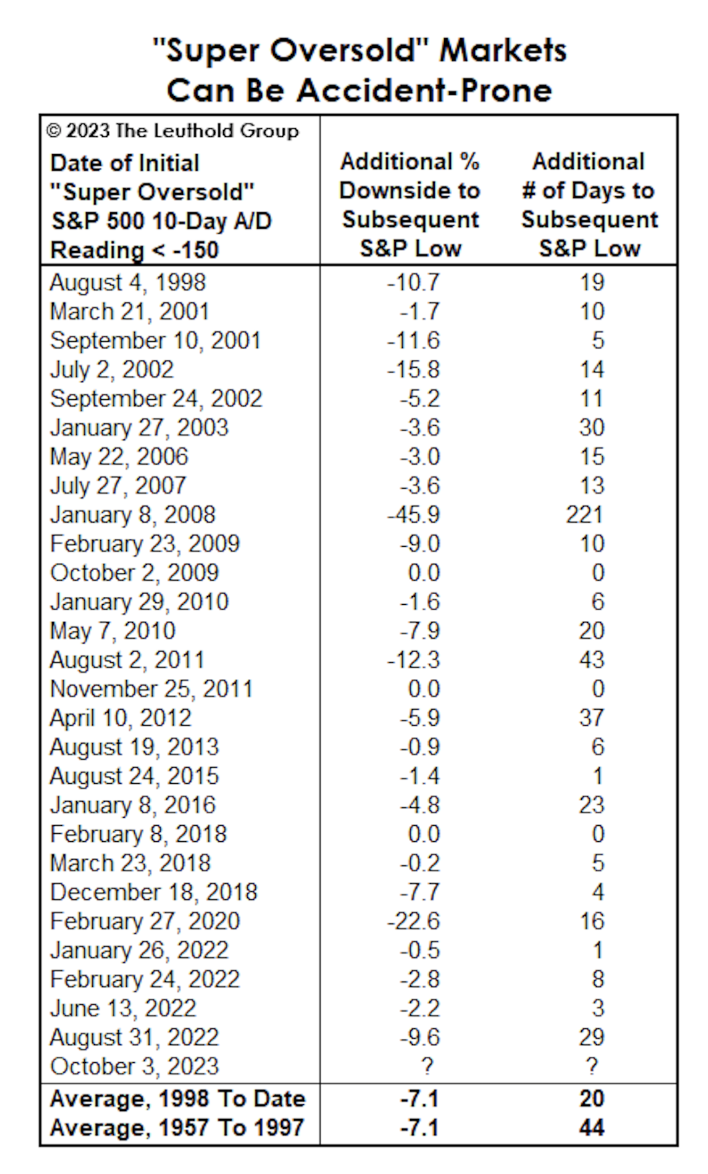
Technically, the market remains in a vulnerable state, as long-term breadth has deteriorated in past months. This demands a more sustained period of repair in order to solidify the bricks within the foundation of the market. Adding a macro-conflict to the wall of worry that does not prove to broaden further, while earnings season delivers powerful beat rates could bring the needed remedy for a vulnerable market, which is still in the window period for undercutting the September low (chart below, from last weekend’s Research Note)
Research Report Excerpt #7
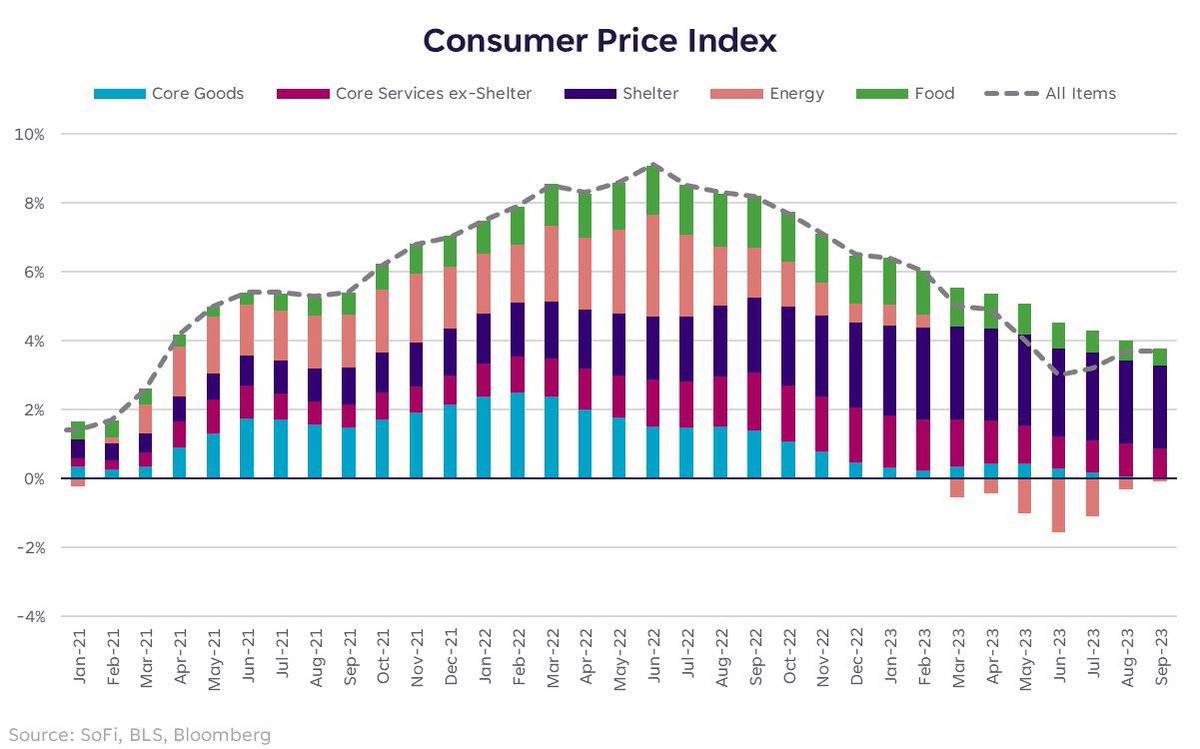
Within the CPI chart above, the Purple September bar (far right) represents the shelter component of CPI. Purple is almost the entire bar. As we all likely know by now, the shelter component of the CPI is the most lagged component. Within the September CPI, it also represented the greatest upside in the core inflation for the month. “The Fed looks on track to call off its final hike for 2023. Core CPI ex-shelter rose just 0.1 percent over the month, rising just under 2% against last year. That’ll be good enough for the Fed.” ~Neil Dutta of Renaissance Macro Research.
Research Report Excerpt #8
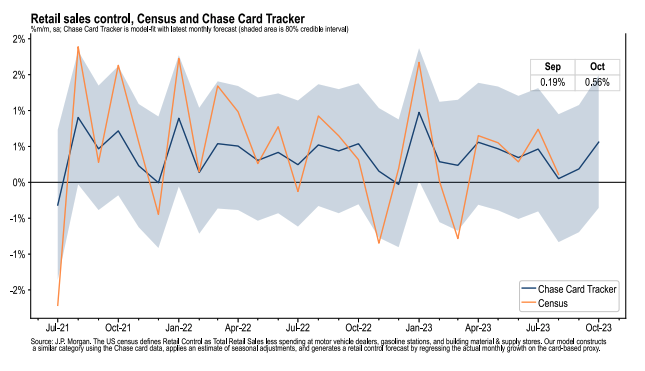
The latest card spending data from Chase Card Tracker (J.P. Morgan Chase) suggests that despite the recommencing of student loan repayment programs, spending remained positive entering and through the 1st week of the month of October.
Research Report Excerpt #9
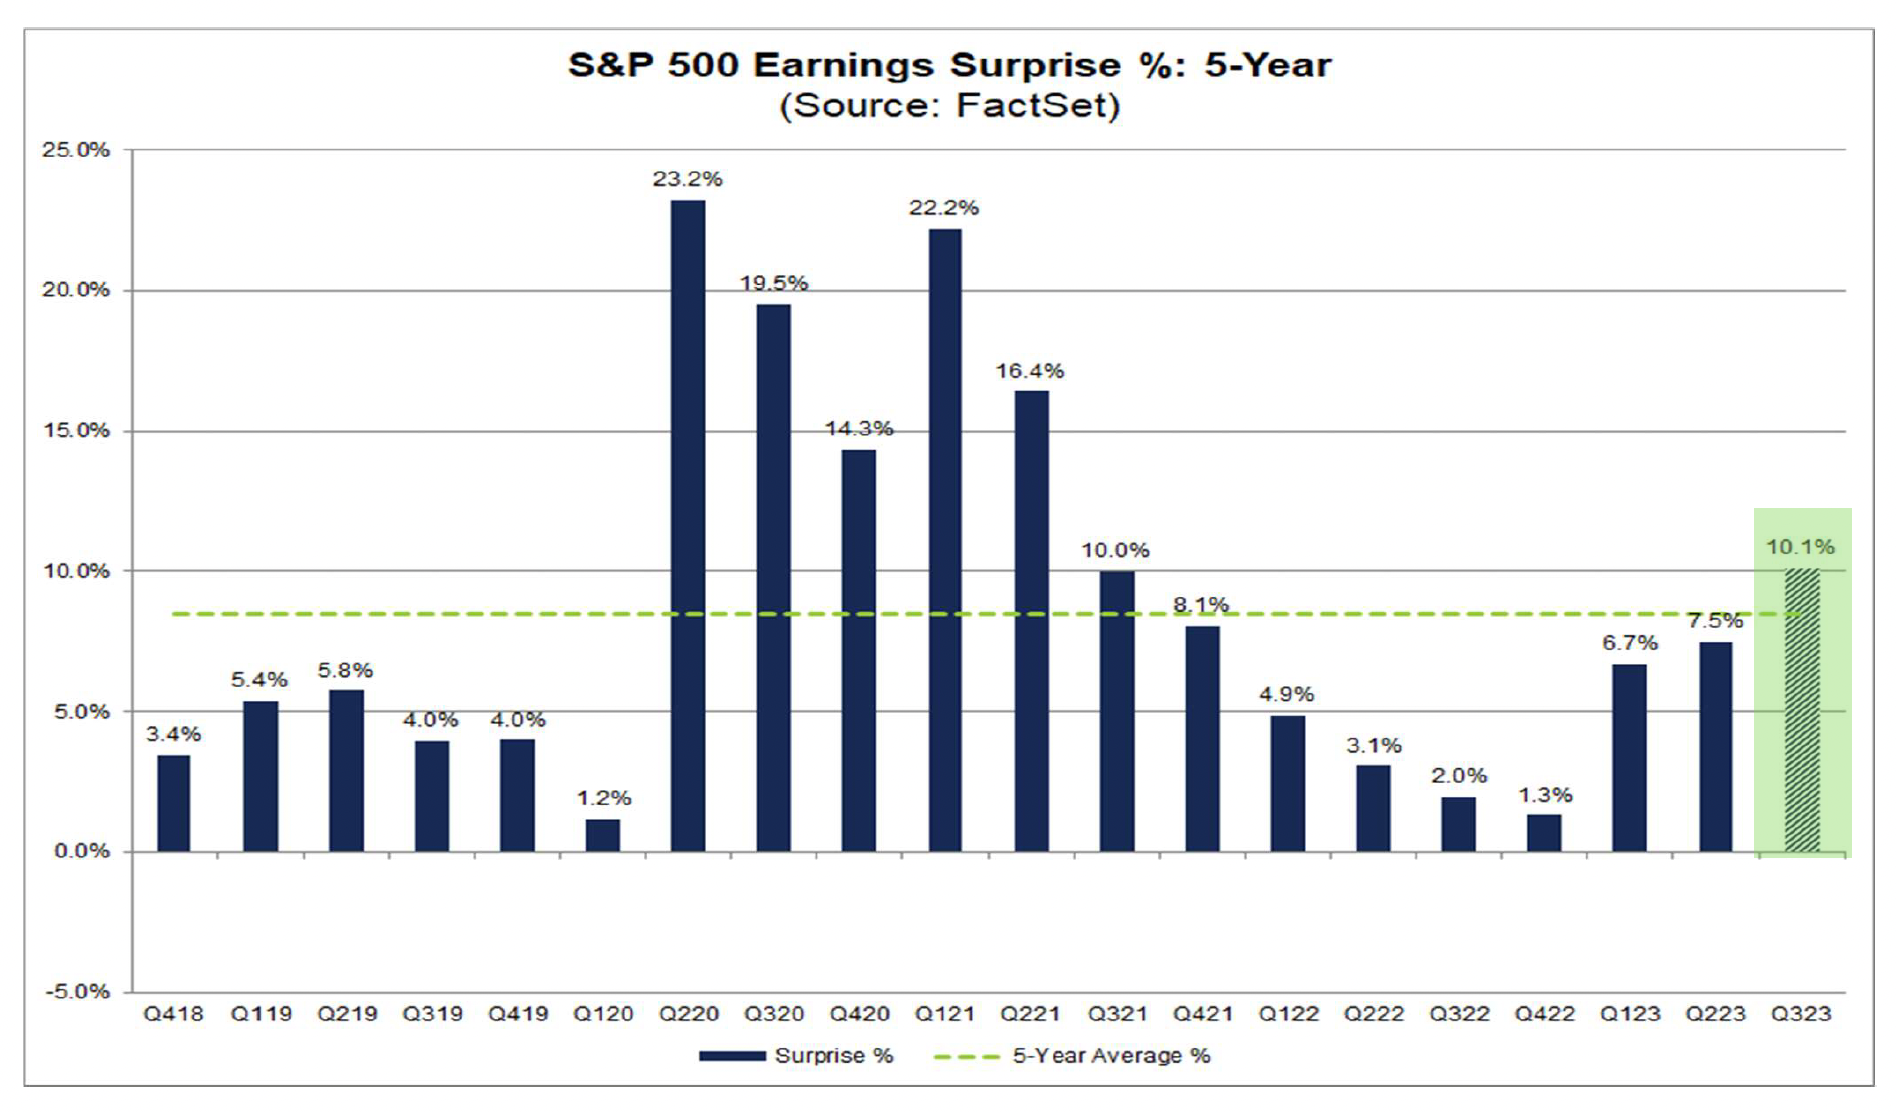
Actual earnings reported by 32 companies reporting have exceeded estimated earnings by 10.1%. Thus, at this very early stage of the earnings season for Q3, both the number of companies reporting positive EPS surprises and the magnitude of these EPS surprises are trending above the 5 and 10-year averages. Will this strong performance continue for the rest of the earnings season? Since September 30, the earnings growth rate for the S&P 500 has increased by 0.7 percentage points (to 0.4% from -0.3%).


