
Welcome to another trading week. In appreciation for all of our Basic Membership level participants and daily readers of finomgroup.com content, we offer the following excerpts from within our weekly Research Report. Our weekly Research Report is extremely detailed and has proven to help guide investors and traders during all types of market conditions with thoughtful insights and analysis, graphs, studies, and historical data. We encourage our readers to upgrade to our Contributor Membership level ($14.99/monthly, cancel anytime) to receive our weekly Research Report and State of the Market videos. Have a great trading week and take a look at some of the materials from within this week’s Research Report…
Research Report Excerpt #1
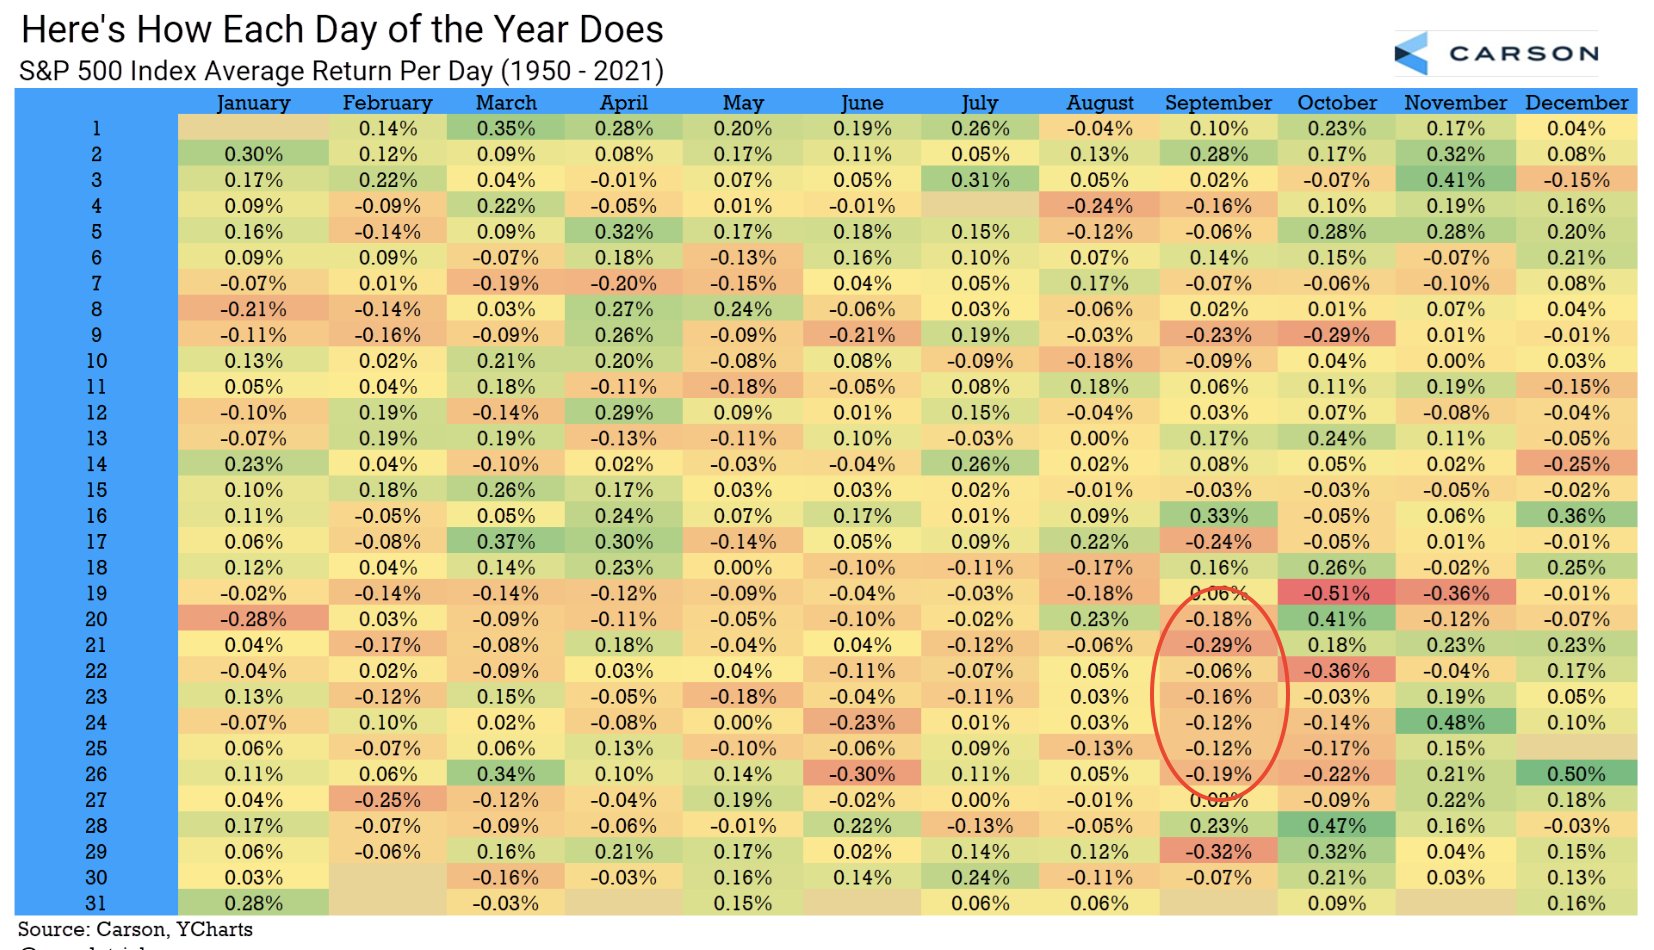
The absolute bulk of the September and total seasonal weakness occurs in the final 10 days of September, otherwise known as “THE WORST WEEKS” of the seasonal period, with the week after the 3rd Friday in September proving the worst week altogether. This year the market not only suffered through the WORST WEEKS, but through the whole of September, down each trading week.
Research Report Excerpt #2
Now, if we just look at the last 10 Pre-Election years in the chart below…PERFECT!
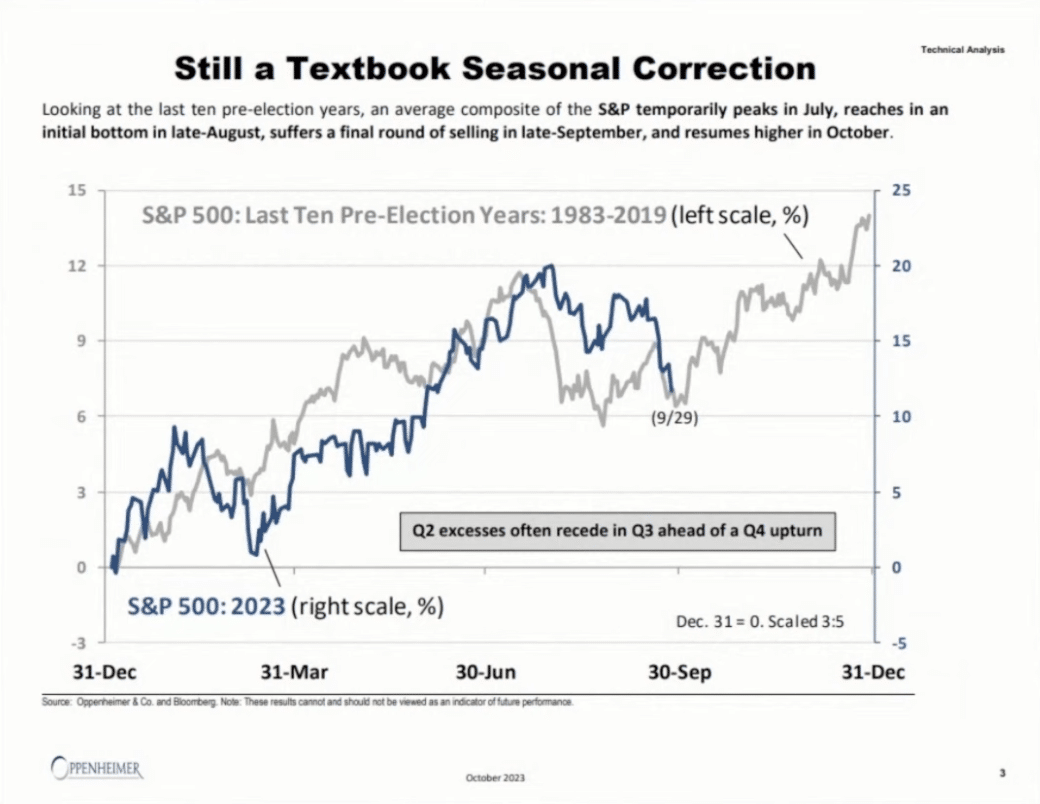
Whether we are reviewing seasonal or quantitative studies, the one thing we have been forced to acknowledge is the potential for persistently rising Treasury yields/rates to disrupt historical market patterns.
Research Report Excerpt #3
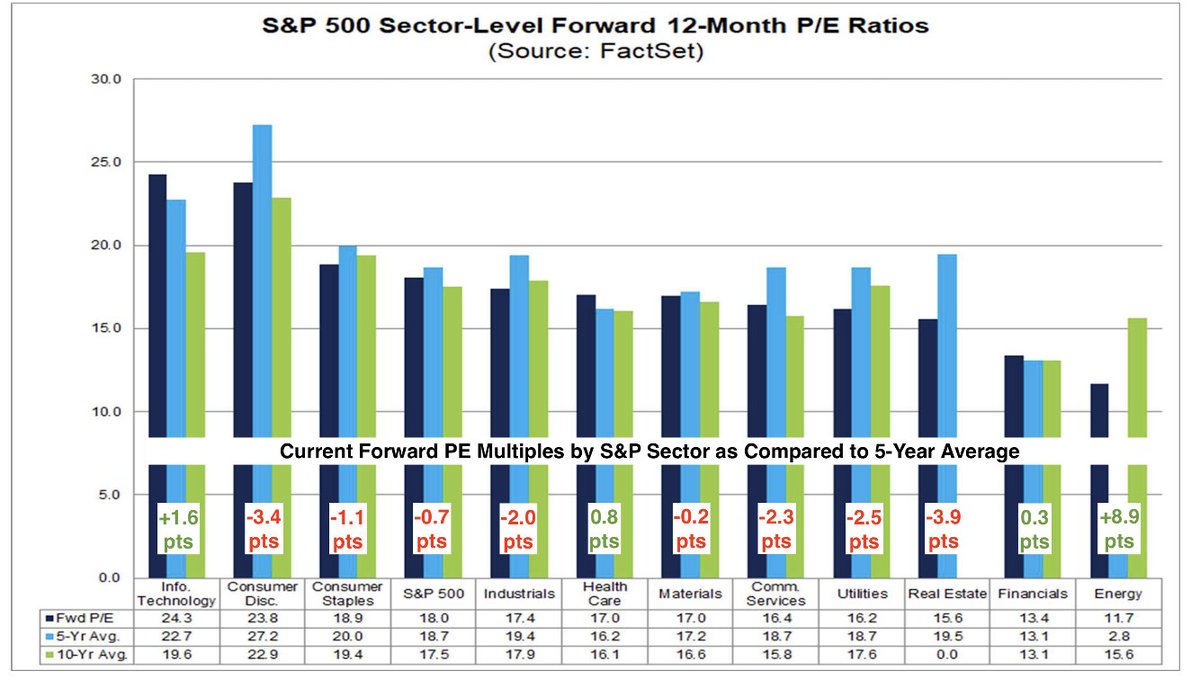
As such, I don’t view the trending and perceived headwinds (Govt. shutdown, China GDP, Excess Savings dwindling, Student loan repayments, rising yields/rates/dollar) as providing sustained headwinds for equities in the Q4 2023 period, as that may prove to be the sentimental price discounting that already took place. I don’t find valuations stretched on an individual or index level, currently 17.9X and below the 5-yr average. Most stocks and/or sectors are trading some 3X multiple points lower than the index’s forward P/E.
- “Most S&P 500 sectors trade at a discount to their 5-year average valuations.
- Only Information Technology carries a noticeable premium, which is understandable.
- Chart annotations via DataTrek
Research Report Excerpt #4
Septembers have been diabolically awful in the post-pandemic years, but thus far they have also led to significant Q4 returns each time. It’s a small sample size of course, but I would not ignore the data outlined below:”

Research Report Excerpt #5
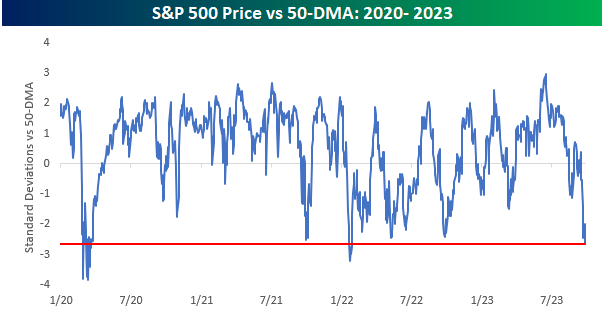
- There have only been 2 other periods since the start of 2002 when the S&P 500 was more oversold than it is now, (2020 and 2022) both in bear markets.
- Each of those occurrences was followed by very different outcomes.
Research Report Excerpt #6
It was not easy in October of 2022, within the throws of one of the most severe, non-recessionary bear markets in history to remain optimistic about the forward probable returns. In early October I offered the following Quantitative data/study to Finom Group investors/traders:
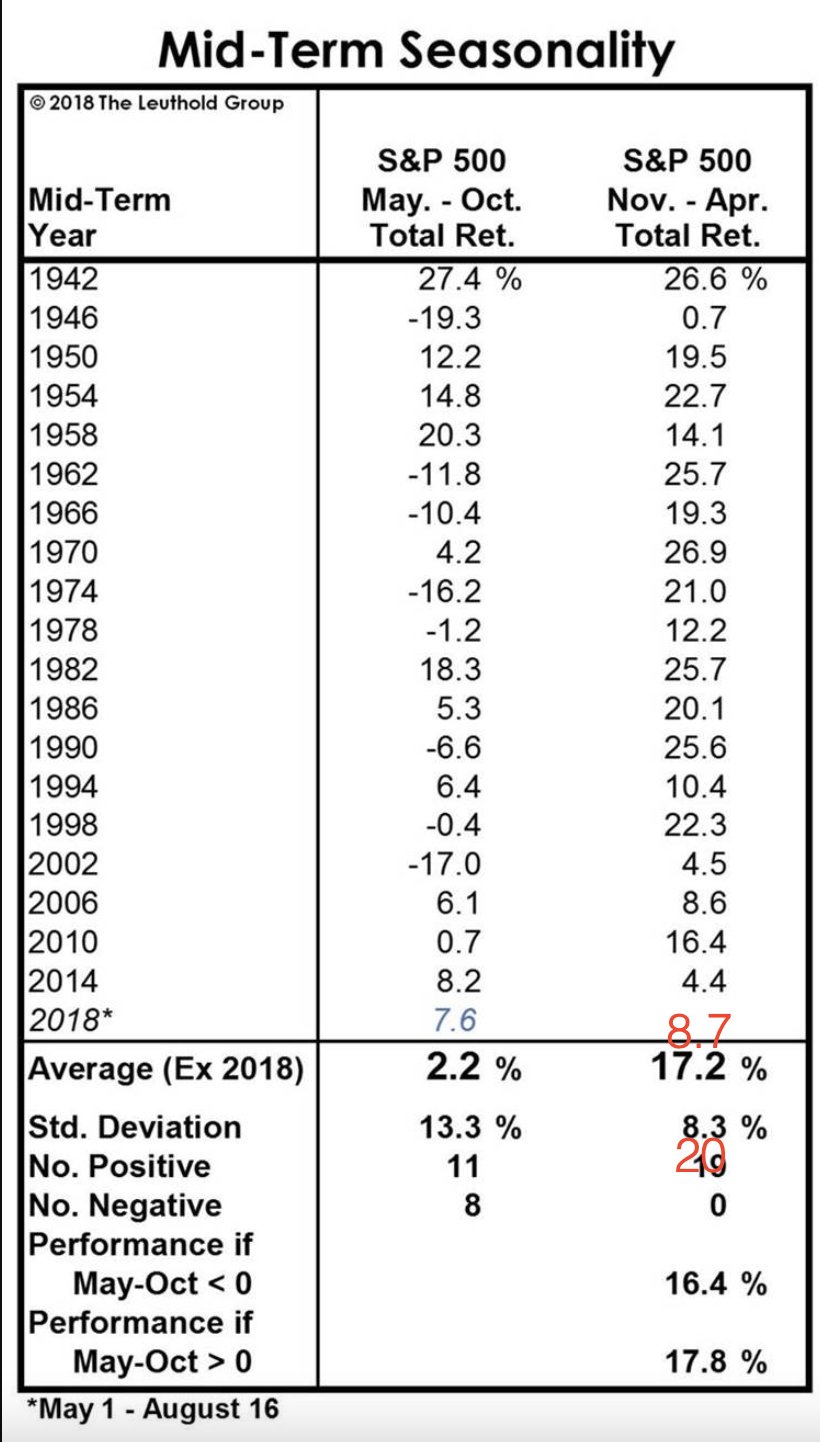
“Since 1942, the S&P 500 has NEVER delivered a negative return from November of a midterm election year through April of the following year. The average return was roughly 17%. The worst performance was a +.7% gain. And yes, the 70s and 80s inflation, rate hike cycles were included in this study.”
Research Report Excerpt #7
Another example of data that proved difficult to accept but was probably achievable from 2022…
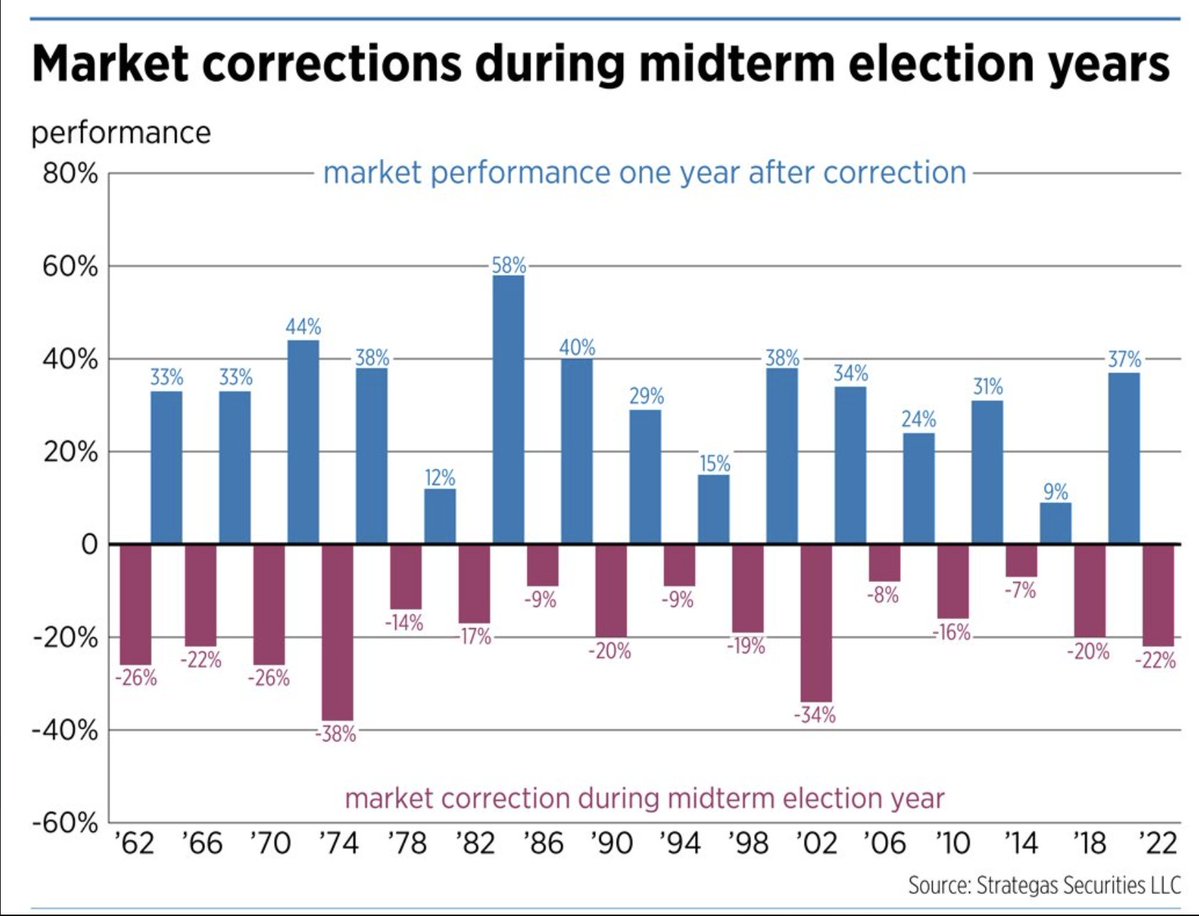
- Every time the S&P 500 had a 20%+ decline or greater in a Midterm Election year (like 2022), 1-year later the market rallied average ~30%. BIG sample, BIG cyclicality, BIG gains!
- I know many think strikes/shutdowns will upend bull markets, but all happened before, and none did!
Research Report Excerpt #8
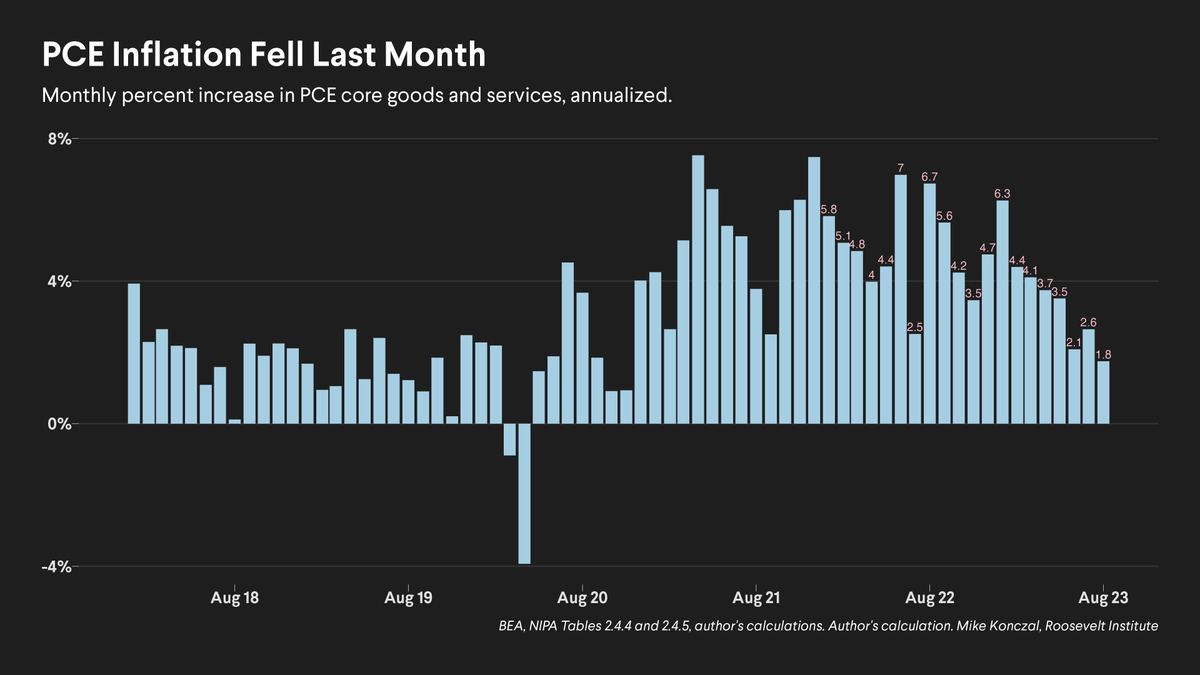
This past week’s Core PCE showed the best inflation print ever. Core PCE has a monthly value below 2% annualized (the Fed’s target) for the first time since the lockdowns. Underneath the hood it’s even better, it’s all heading in the right directions. Coupled with stronger than forecast retail sales and upticks in goods spending as services spending normalizes, and I continue to believe that ISM Manufacturing can achieve a 50 print by year-end.
Research Report Excerpt #9
Our next chart analyzes the trend in possibly the most important performance ratio of 2023. Semiconductors have dominated the market’s performance in 2023, even if comparing its performance to the more Growth-oriented index, the Nasdaq 100 (QQQ).
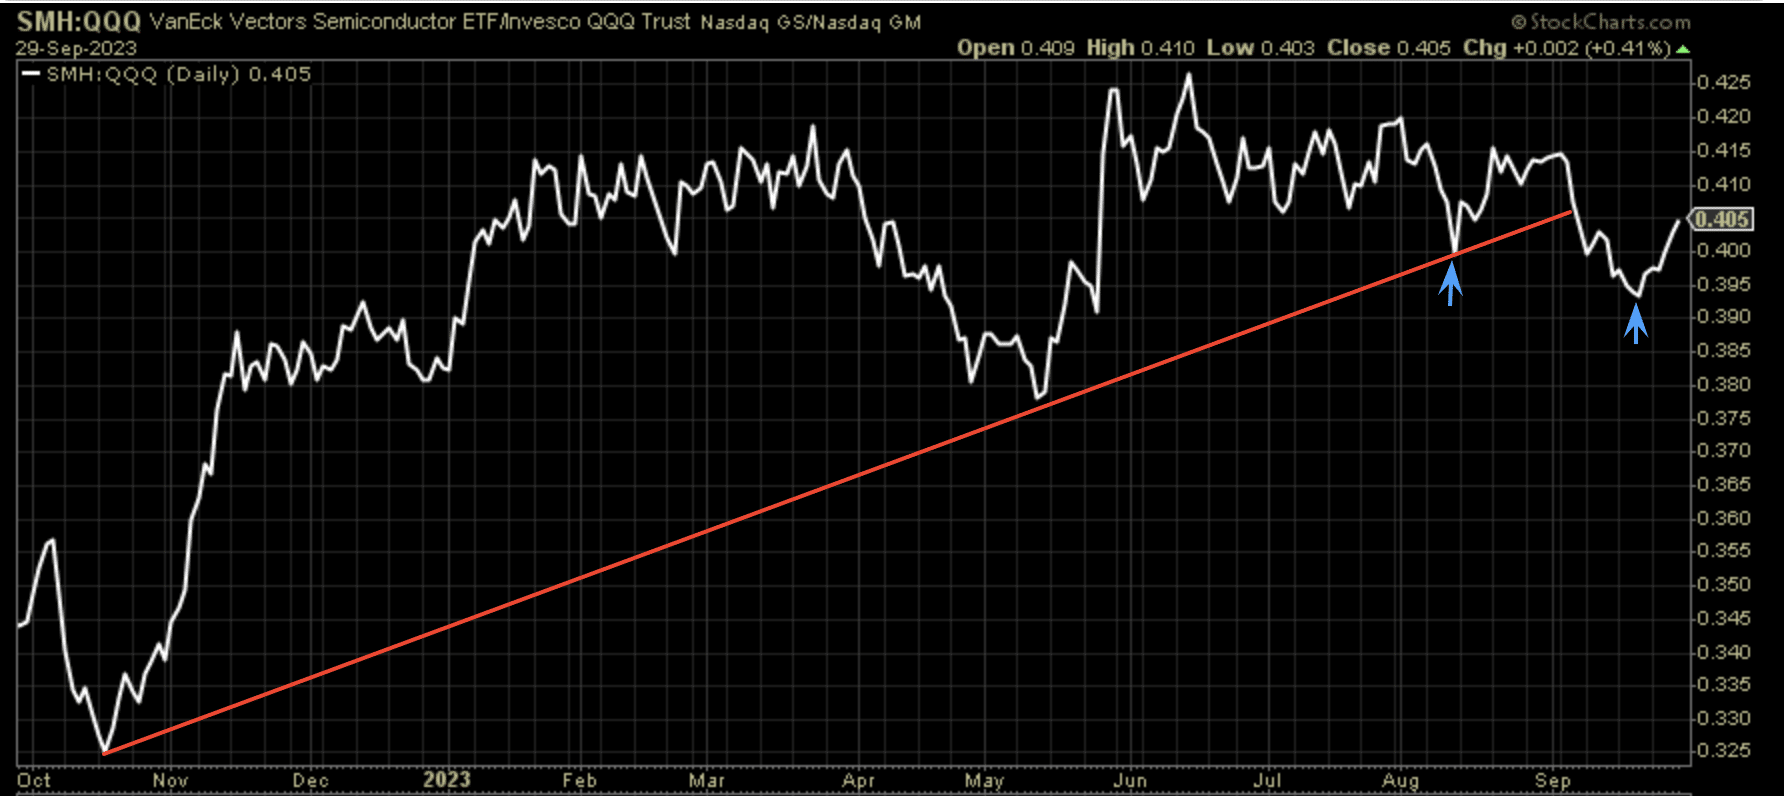
There’s been a bit more damage in this performance ratio chart than our former chart analysis, as defined by the “swing low” formation (arrows). The performance ratio bounced last week, led by Semiconductors (SMH) with a positive weekly performance, even as the Nasdaq 100 suffered another weekly decline. While Semiconductor leadership was clearly on display this past week, continuation of leadership would be ideal if not necessary for the overall markets to show strength. Speaking of Semiconductors going forward, I remain bullish on the industry, and have been adding trading positions inside the Golden Capital Portfolio during the consolidation phase.


