Welcome to another trading week. In appreciation for all of our Basic Membership level participants and daily readers of finomgroup.com content, we offer the following excerpts from within our weekly Research Report. Our weekly Research Report is extremely detailed and has proven to help guide investors and traders during all types of market conditions with thoughtful insights and analysis, graphs, studies, and historical data. We encourage our readers to upgrade to our Contributor Membership level ($14.99/monthly, cancel anytime) to receive our weekly Research Report and State of the Market videos. Have a great trading week and take a look at some of the materials from within this week’s Research Report…
Research Report Excerpt #1
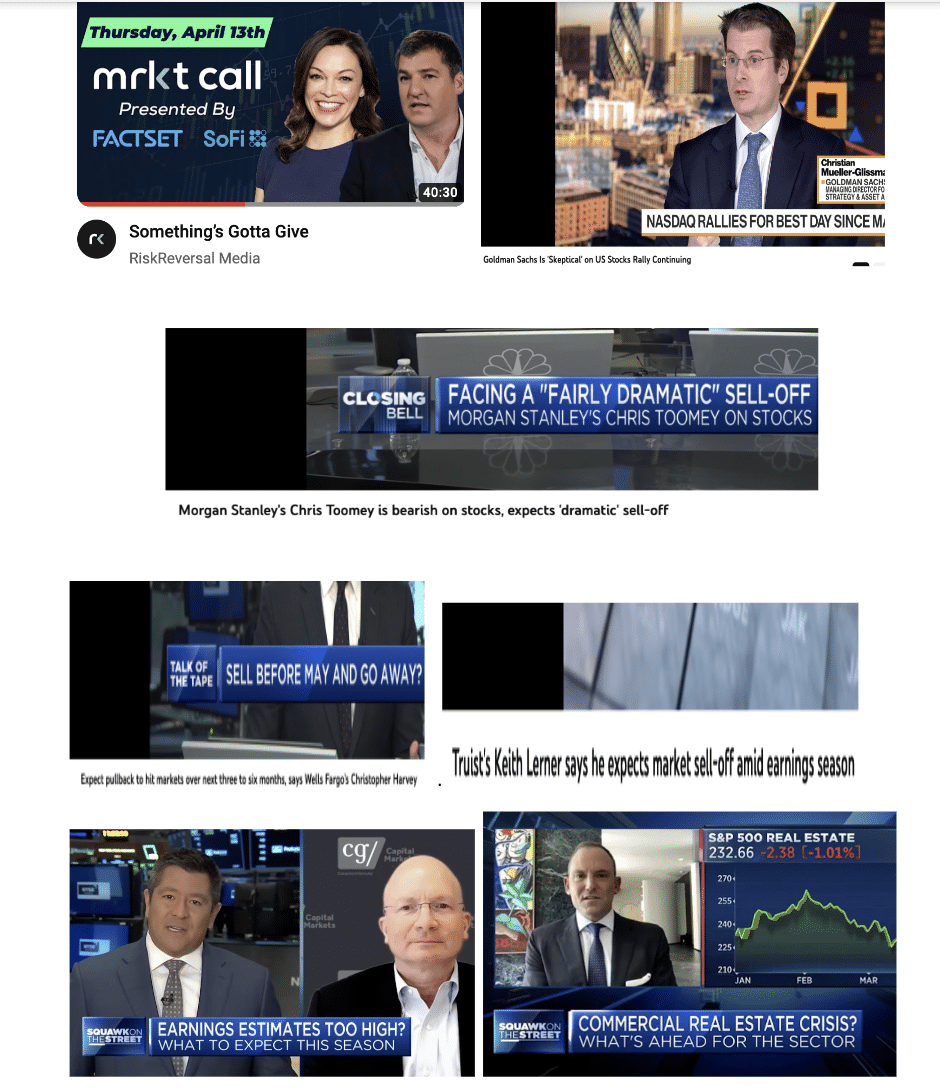
Based on the images above, Wall Street strategists and analysts seem to be in an ongoing battle in favor of the 2022 bear market, in much the same way they were continuing the bear market battle from 2009 and 2020 forwards. It’s easy to become affixed to the former market regime, be it bullish or bearish. What proves most difficult is the recognition, adjusting, and response to a new market regime.
Research Report Excerpt #2
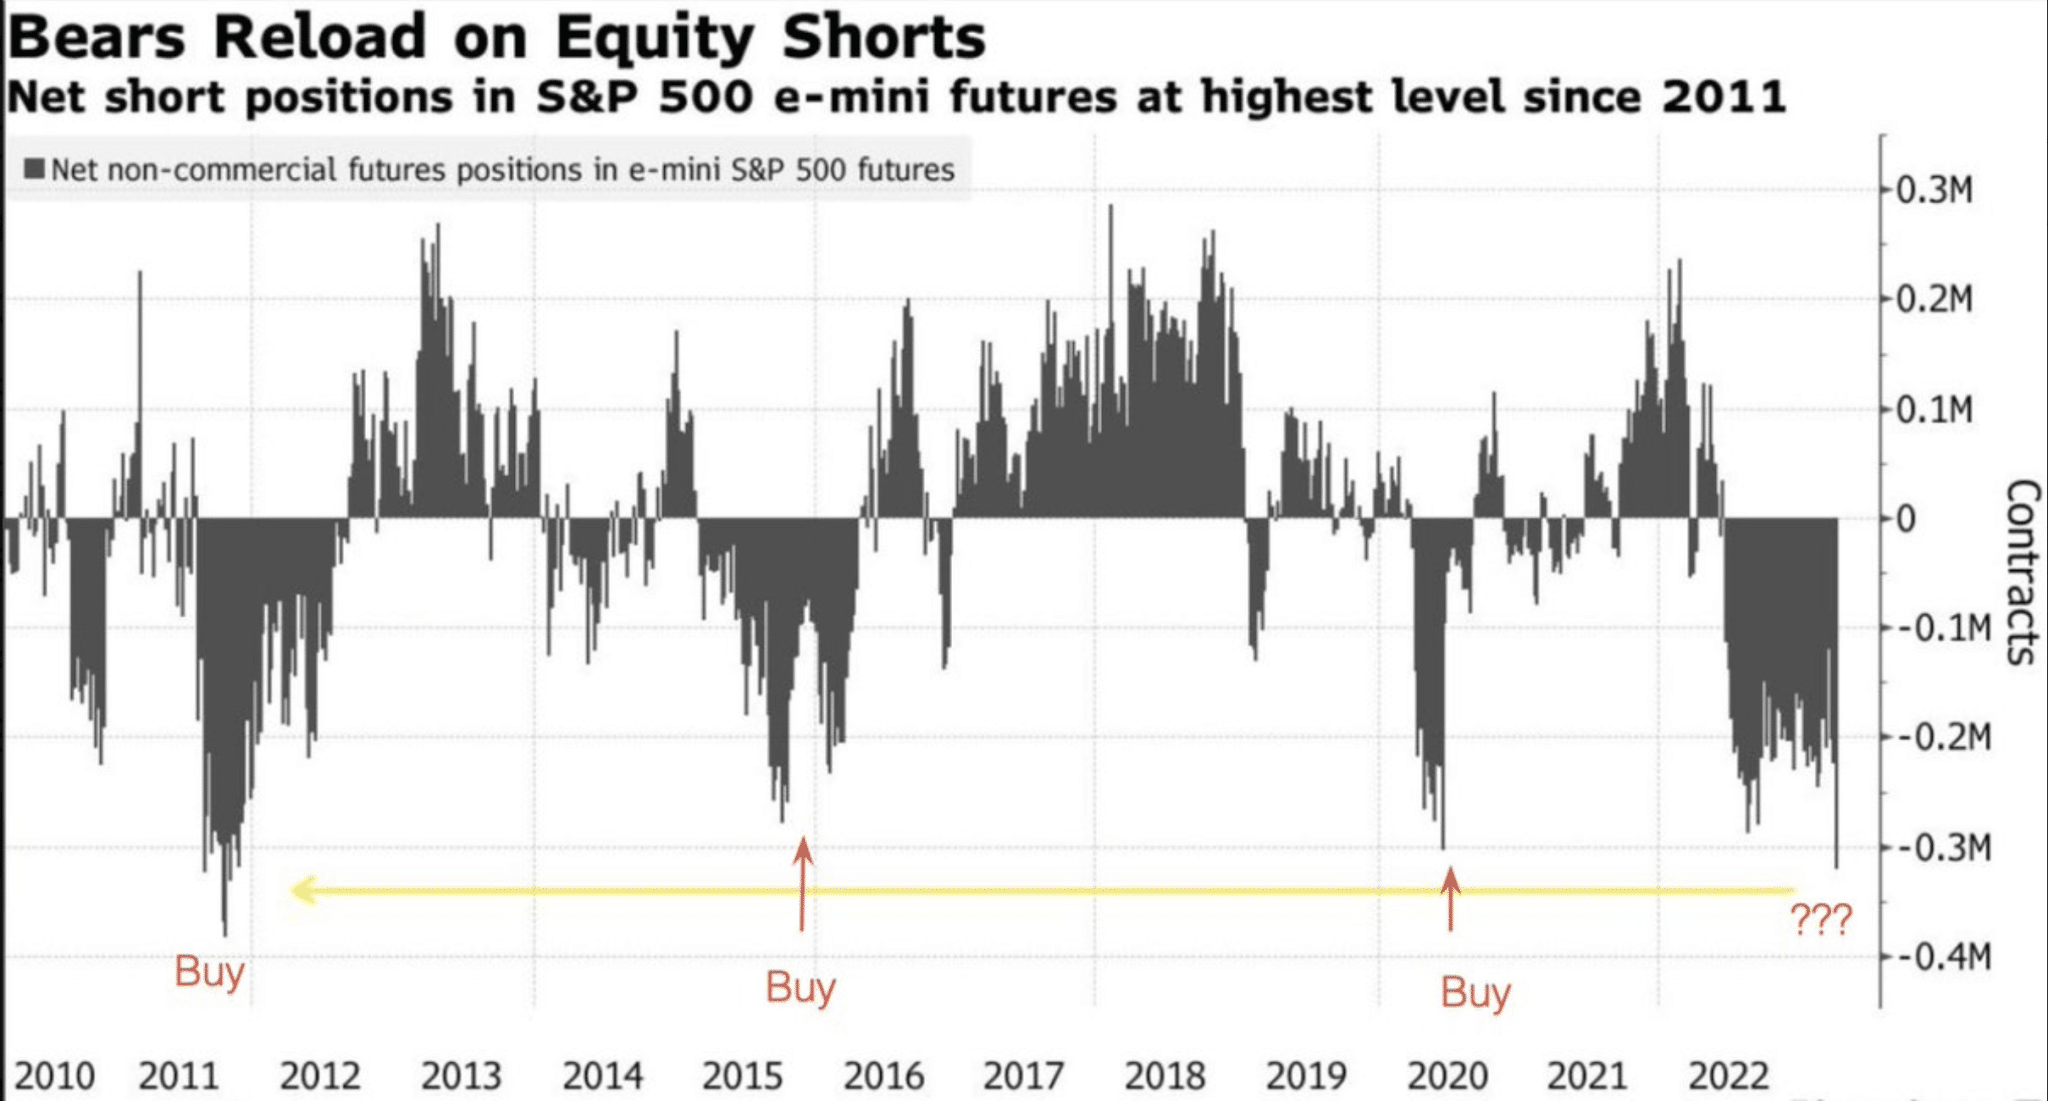

Question: How did this work out for the bears, those short S&P 500 futures? And this is just one example whereby it would have proven a better exercise to have bought the dip or remained in cash in order to buy a corrective market move than try to time a potential, corrective market move. “But I want to make money both ways, Seth.” WHO DOESN’T! Savvy investing is about leaning into the probabilities, and the probabilities that you will be able to make money both ways (up and down market) are limited, else everyone would be rich and you wouldn’t be reading this report.
Research Report Excerpt #3
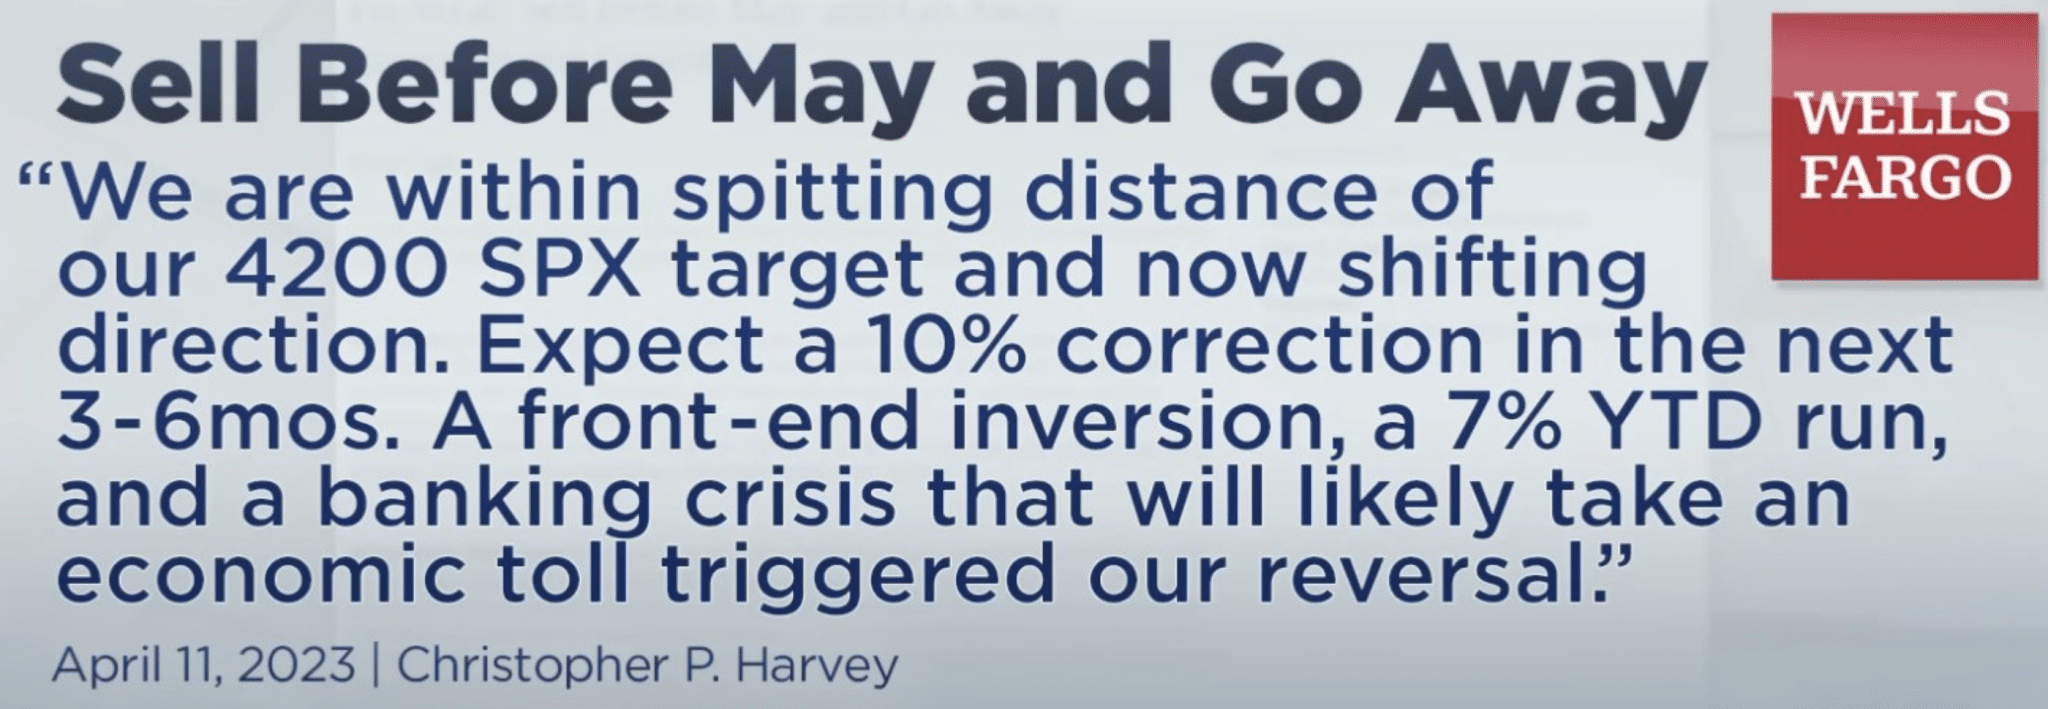
Most of the Wall Street strategists are of the opinion, and have expressed it loudly, that the market should be sold at current levels. I get it. There remain massive and unique crosscurrents between the technical and macro landscape. On the one hand; we have considerable components that define a highly probable recession i.e an already in-force manufacturing and housing transactional recession, a yield-curve inversion, Leading Economic Index (LEI) down 11 consecutive months (soon to be reported 12 consecutive months) and generally slowing economic growth trends. On the other hand; we have tremendous and numerous breadth thrusts w/technical feats of strength that occur during bull market phases.
Research Report Excerpt #4
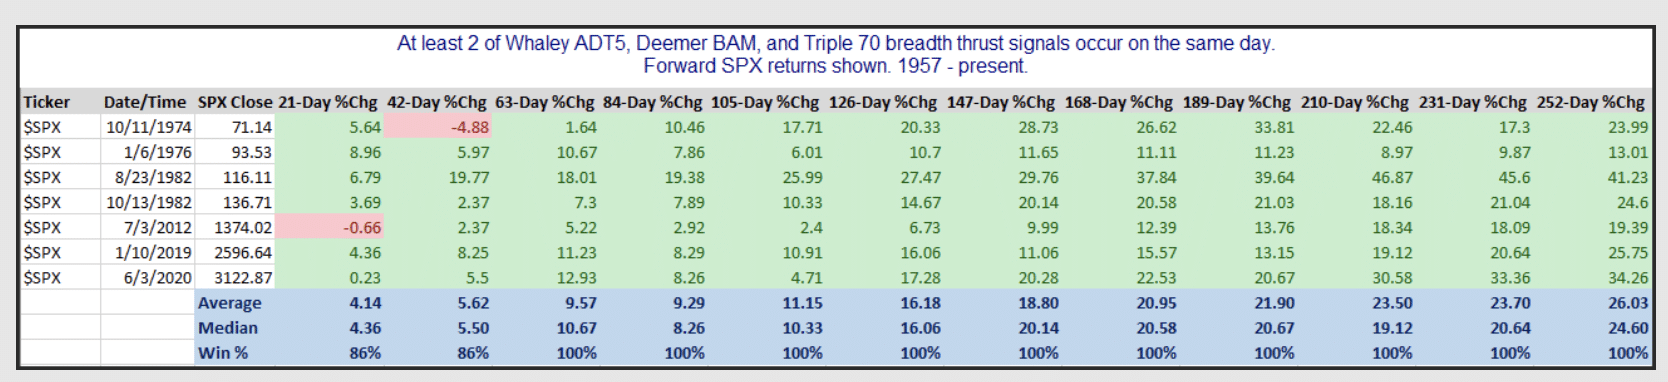
- As reported by Quantifiable Edges, the firm’s proprietary Triple 70, a BAM, and a Whaley thrust all happened on the same day for the first time in history, back on January 12, 2023.
- There have been 7 instances where 2 of the 3 triggered on the same day. They can all be found in the table above.
- The S&P 500 closed at 3,983 on that day.
- 42-days later, the market is higher than when the signal fired on January 12th.
- It has been a volatile road, but higher has proven the historical probability.
- The S&P 500 has never been lower 63-days or 3-months later post the signal firing, which would take us to April 12th, give or take a day. So far, so good once again.
As noted in the last bullet point above, the market’s performance is holding true to the higher probable outcomes, post breadth thrust achievements. Going forward, we move to recognize what happens 63-Days post the breadth thrusts and as outlined in the table above: S&P 500 has never been lower than the day the breadth thrusts were achieved. As a reminder, this simply suggests the market will be above 3,983 on May 12, 2023. It is not a guarantee!
Research Report Excerpt #5

- Since 1957, (when the S&P 500 genesis) there have been multiple crosses above 200-WMA
- But many failed and led to new lows
- The longest of these “fake recoveries” is 13 weeks
- Thus, Fundstrat looked at 15 weeks as the threshold
Research Report Excerpt #6
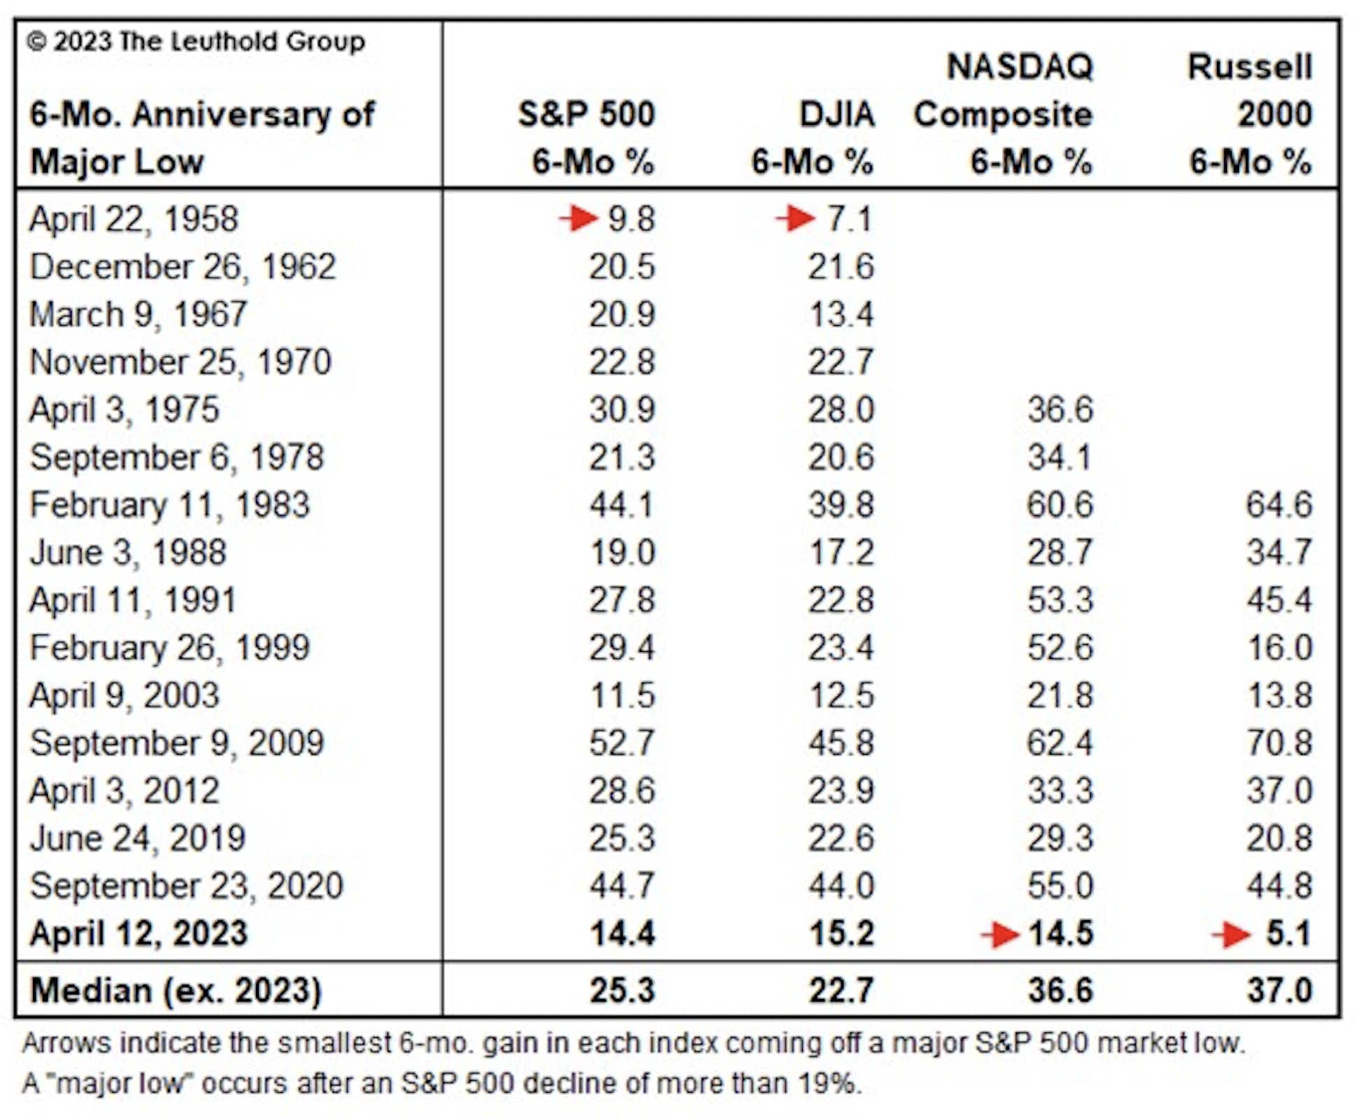
April 12, 2023 was the 6-month anniversary of the bear market low of 3,577.03 in the S&P 500 (closing basis). Measured from the S&P 500 low on October 12, 2022, the 6-month index return and that of its blue-chip cohort, the DJIA, are each near +15% versus median gains of 25.3% and 22.7%, respectively, at the 6-month point from prior lows, 1957 forward. However, when measured from the same October low, gains in the higher-beta NASDAQ Composite (14.5%) and Russell 2000 (5.1%) are below those seen at the same stage of any previous 6-month return of past upswings. In a new “major advance,” the median 6-month gain for both the higher-beta indexes was 37%. Does the weaker action in those indexes (especially the Russell 2000) suggest investors have continued reservations about the cyclical outlook that, in previous cycles, had mostly disappeared? I think we have to be honest and suggest that it does. (data from The Leuthold Group)
Research Report Excerpt #7
The greatest investors/traders I know all demonstrate the following traits:

The ability to move beyond the emotions typically associated with a market/portfolio drawdown is one of the greatest traits of a savvy/hardened investor. This is not 2022’s bear market, even if a still turbulent market.
Research Report Excerpt #8
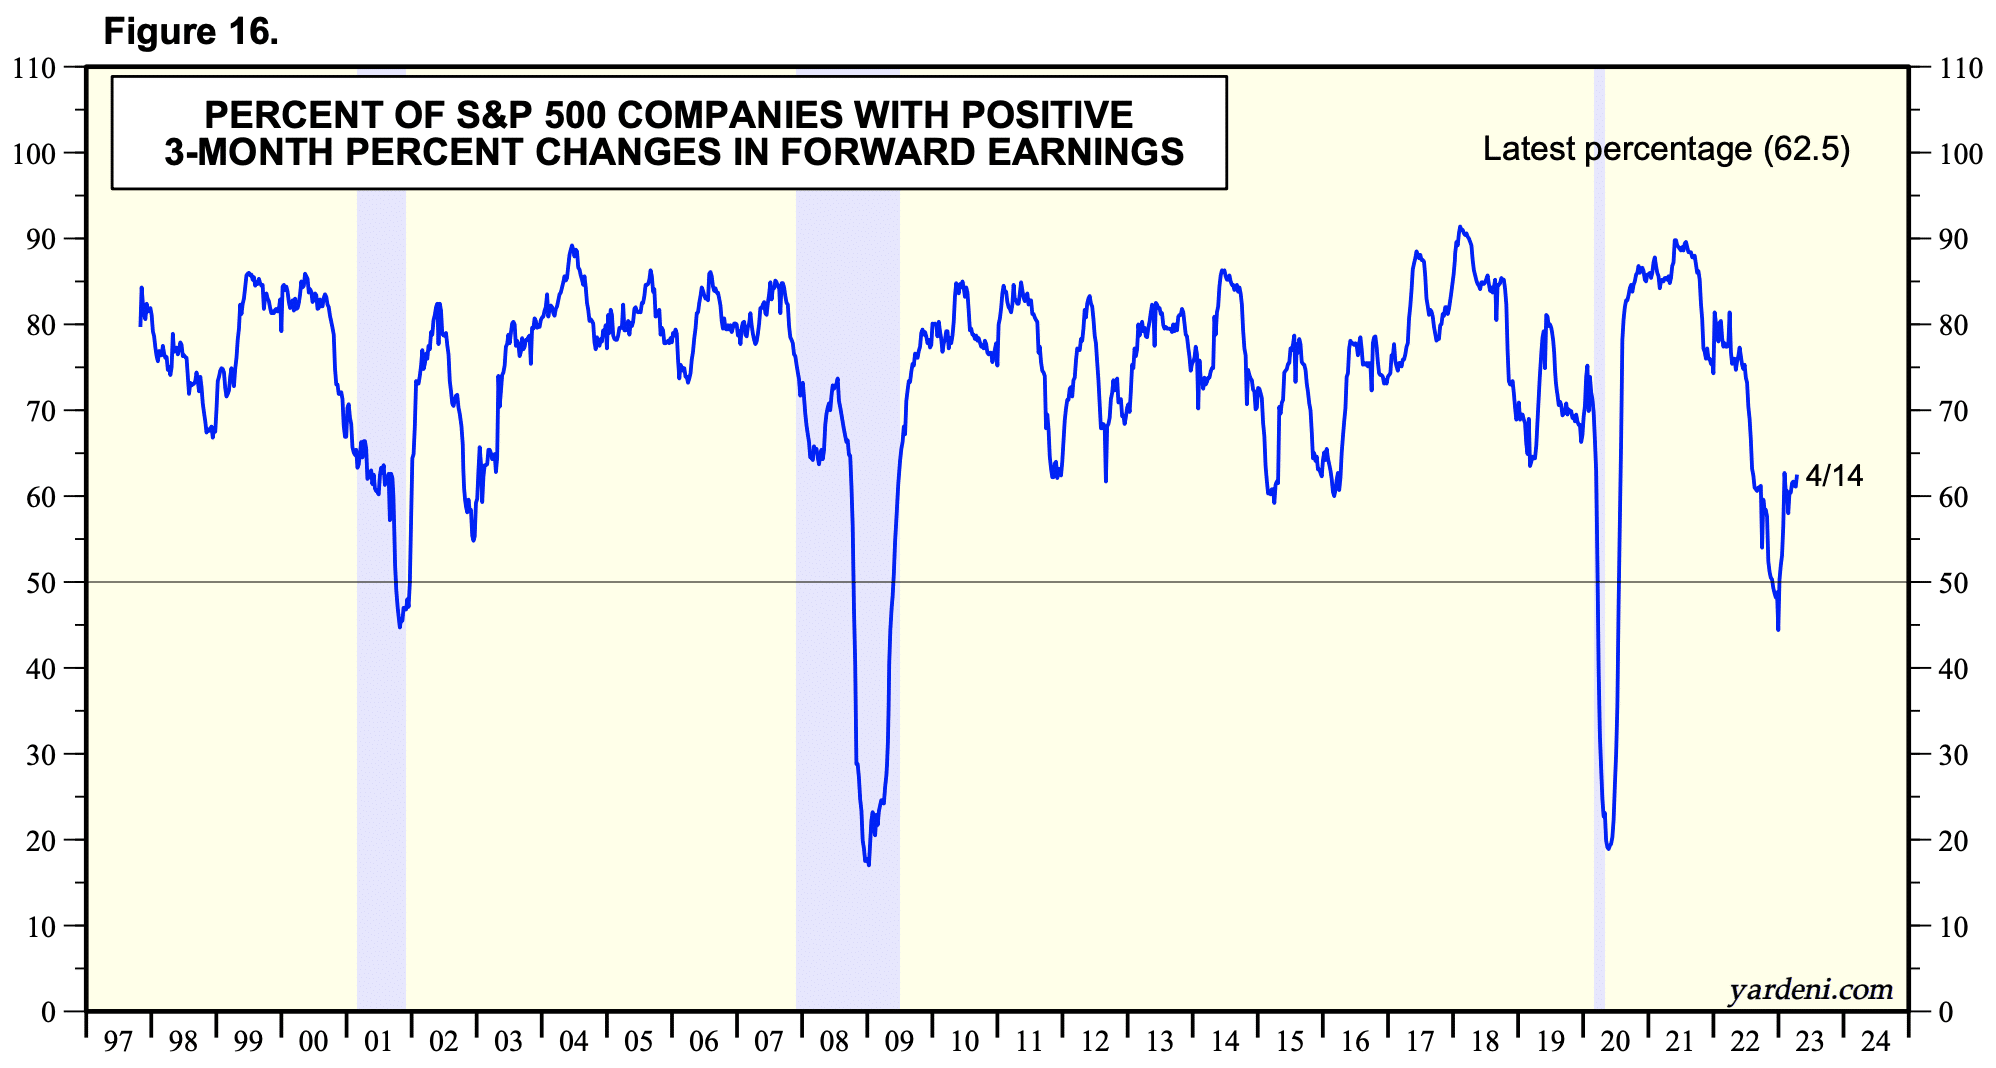
With this Friday’s results from JP Morgan (JPM), Wells Fargo (WFC), Citigroup (C), and Blackrock (BLK), the guidance has also resulted in the 2nd highest Positive 3-month Percent Change in Forward Earnings (62.5%) since the trough in this highly relevant metric late last year.
Research Report Excerpt #9
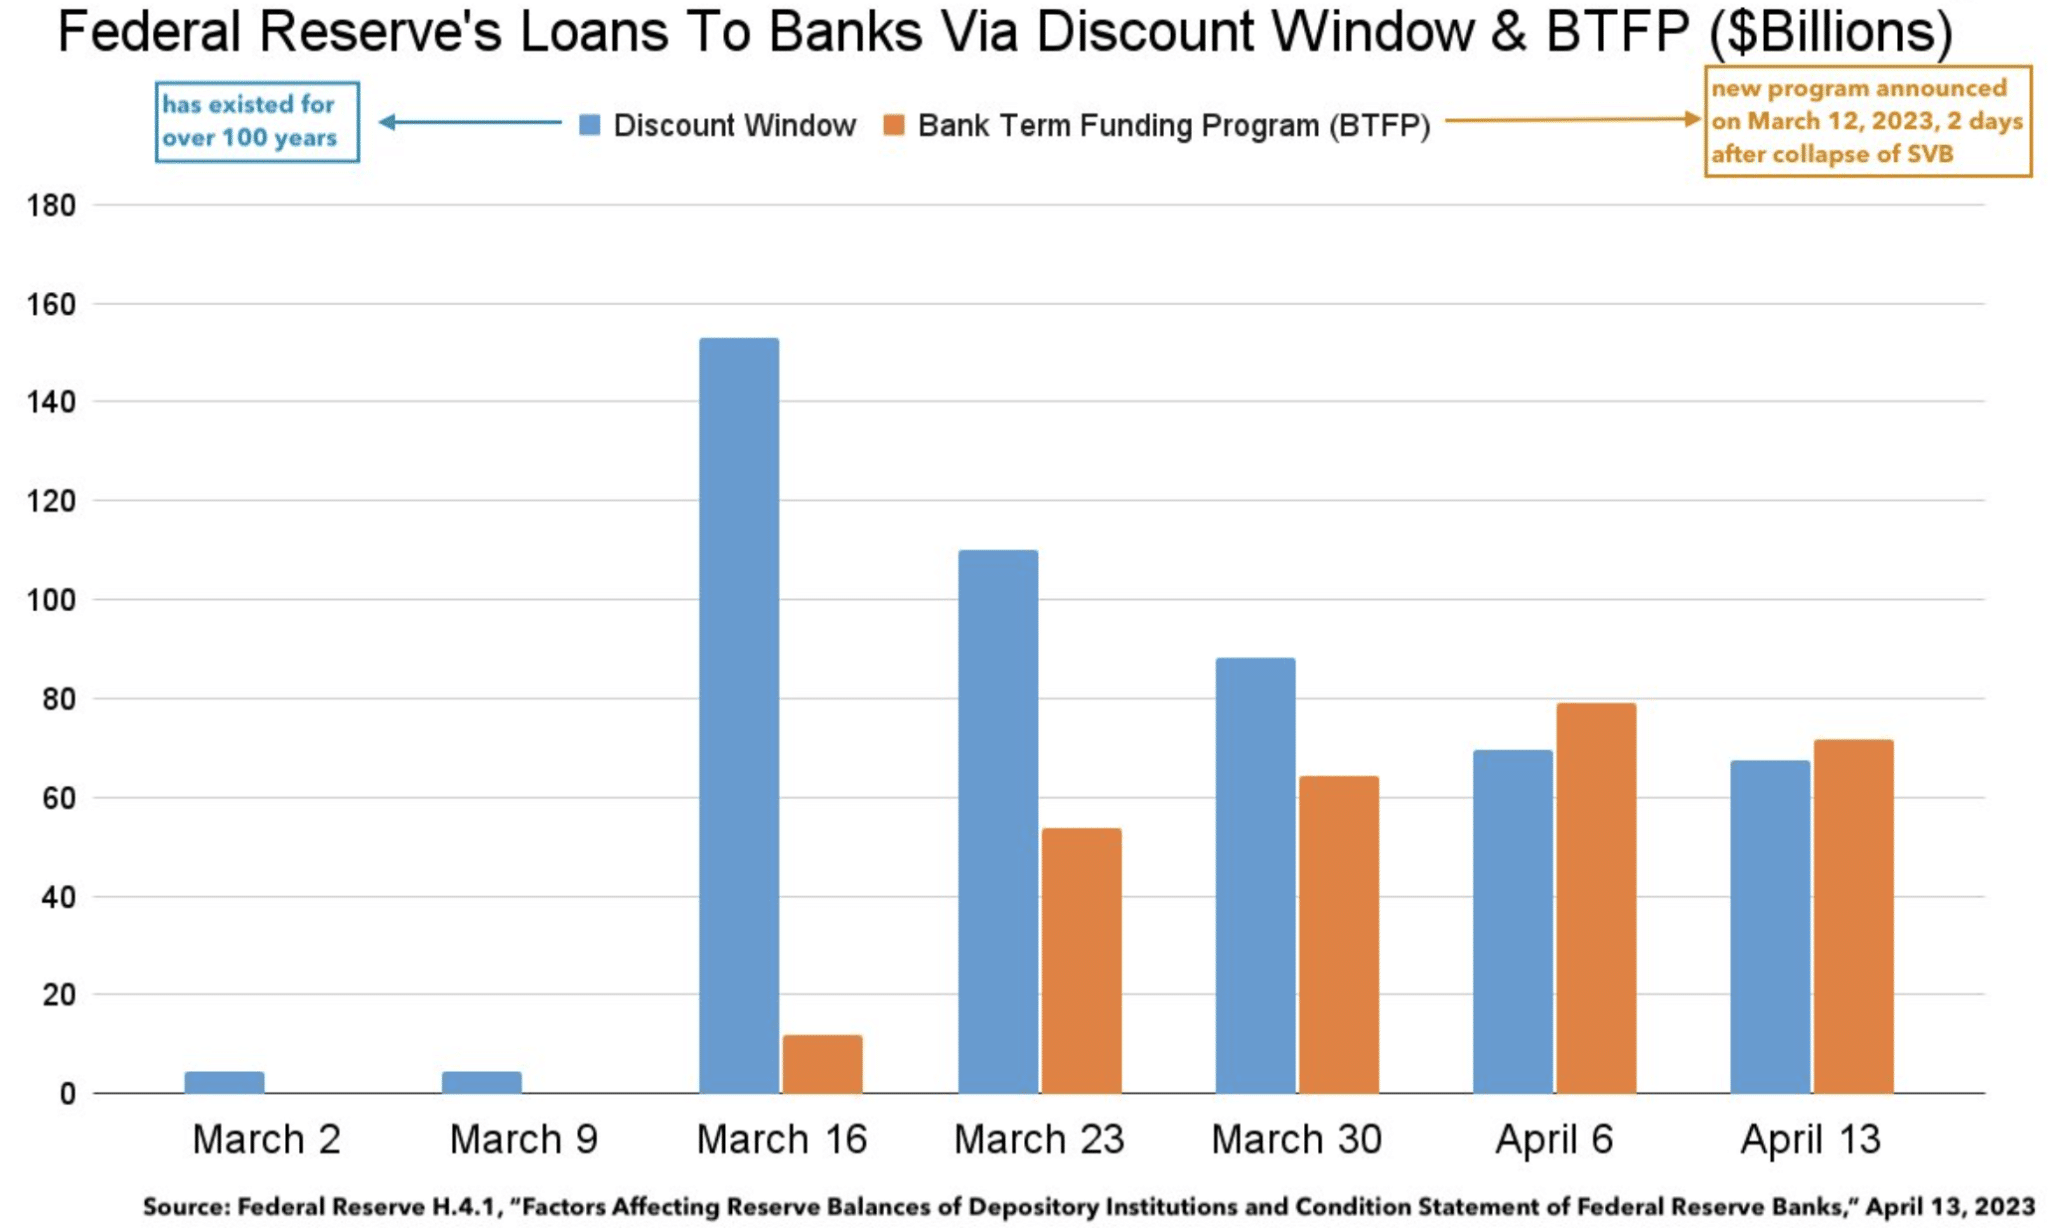
For the first time, banks’ reliance on the Fed’s new Bank Term Funding Program (BTFP, orange bar) has actually fallen. Discount window usage (blue bar) falls yet again. (Jack Farley)