

Research Report Excerpt #1
Given that in the lead up to “Volmageddon” in 2018 we got up to 9 days of VIX/SPX rising together, most investors who remember this automatically assign a like-outcome, even though there were a great many more issues that combined to produce Volmageddon. Additionally, while the recent positive relationship does raise cautionary flags, we did not achieve the correlation status that led up to Volmageddon. Seven of 25 days with a positive correlation is not 9 of 25 days of positive correlation As another reference to the commonly recognized likeness to the 1995 market year, the highest positive correlation achieved was 11 days out of 25 with a positive VIX/SPX correlation. So while the positive correlation recognized in the chart above is noteworthy and interesting, it’s very probable that it may just be noise. So let’s take this one-step further to find out, by referencing our former “performing as expected”.
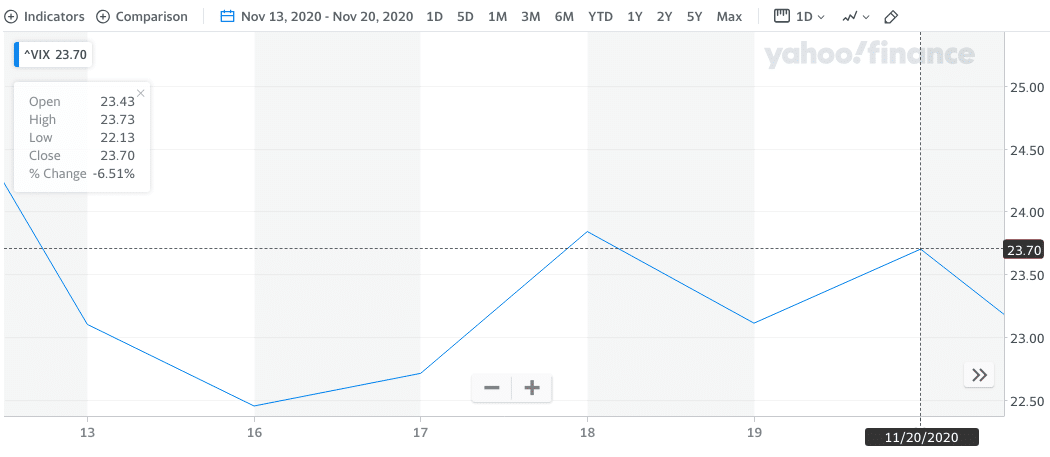
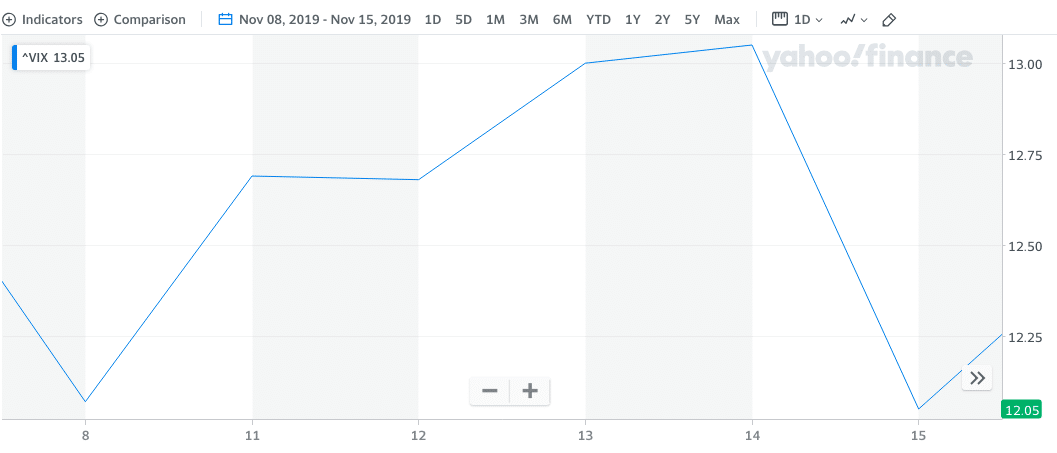
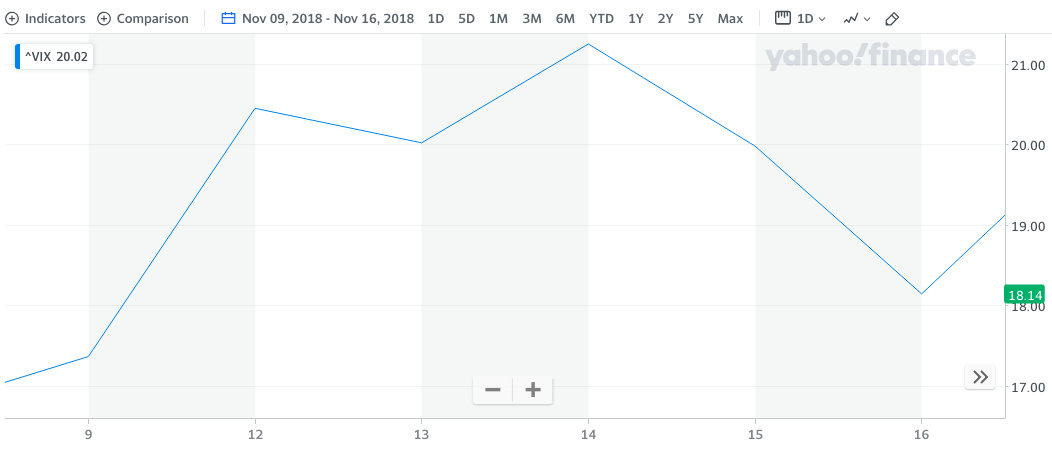
As we researched the S&P 500’s prior 3 years of November monthly Op/EX, we also examined the VIX for the same period, as shown in the 3 VIX charts above. In 2020 (top) and 2018 (bottom), the VIX was up for both November Op/EX weeks. In 2019 (middle), the VIX was almost perfectly flat for the week. This indicates what we largely expected, a higher probability of higher volatility during the November monthly Op/EX week.
Research Report Excerpt #2
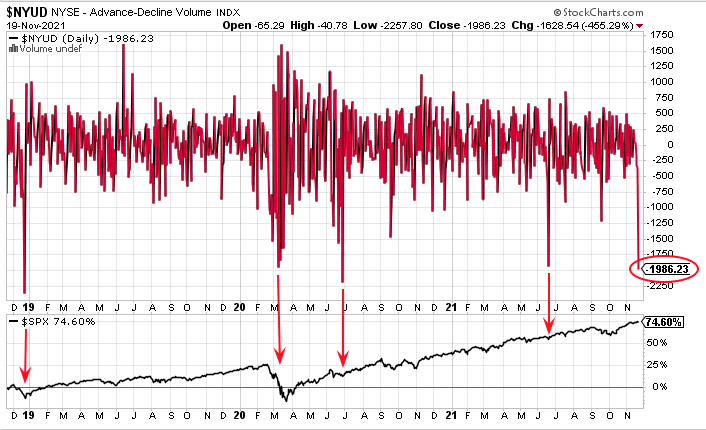
We are seeing some very depressed NYSE advancing volume here folks (top panel). We’re going to need some more information. Usually, a volume histogram this weak, coincides with a bigger pullback, as it did in late 2018, March 2020, and June 2020. Like the occurrence in June of 2021, however, this NYSE advancing volume weakness is happening around all-time highs in the S&P 500 (bottom panel).
Research Report Excerpt #3
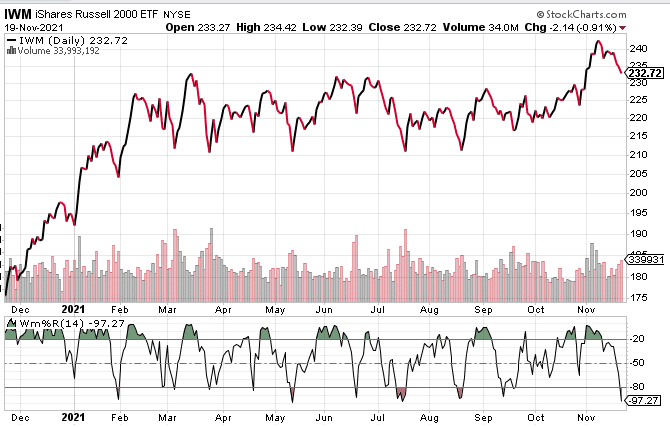
Uh Houston, Houston! Based on the Williams %R definition, it’s very, very clear to see that the IWM/small caps is oversold. These conditions have occurred several times in 2021, and each time they have proven a strong buying opportunity, as a bottom was forming/formed. It’s difficult to say that Monday we will see a turnaround for small caps, but the oversold conditions are not likely to be sustained for very long if history repeats or rhymes. As such, we can logically anticipate an improvement in overall market breadth when small-cap risk appetite improves.
Research Report Excerpt #4
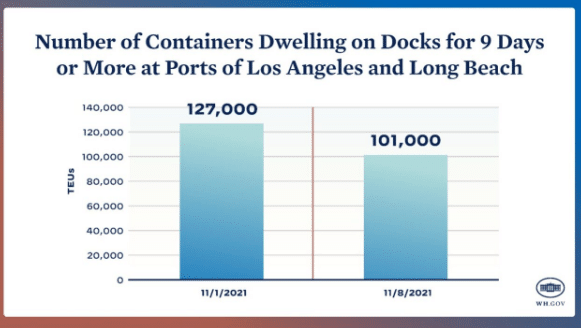
For those who label the headwinds of the day as being too big to solve, they often underestimate human beings’ ability to adapt, innovate, and change in the face of adversity. There are a lot of bright and talented people working on innovations to help address the current supply/demand imbalance, and many of the issues are presently finding resolution with abating headwinds.
Research Report Excerpt #5

Retail Sales aren’t adjusted for inflation, so higher prices are a factor, but the report was better than expected nonetheless and marked the 3rd straight month that the headline reading topped expectations. The following charts show that retail sales strength isn’t just about inflation. Even in inflation-adjusted terms, retail sales are way above their pre-pandemic trend.
Research Report Excerpt #6
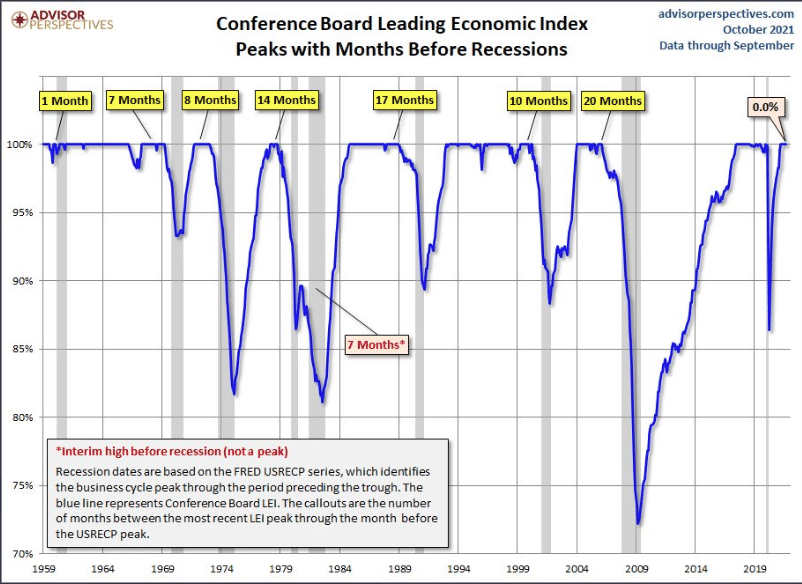
The second factoid about the LEI, especially if you’re a “recession data hunter”; In the past 50 years, the final peak in the LEI has been at least 7 months before the next recession. We are currently still trending higher folks. Given that we have continued to see strong growth from October into November, I think it is safe to say that we will see a new high in the LEI come this time next month, therefore, we would extend our recession probability out even further.
Research Report Excerpt #7
Merrill BofA: “We now expect the Fed to start hiking rates in June next year, pulling up our forecast by 2 quarters. We expect the Fed to stay with a quarterly cadence, hiking at every other meeting which leaves 3 hikes in 2022, 4 hikes in 2023 and 1 hike in 2024 …”
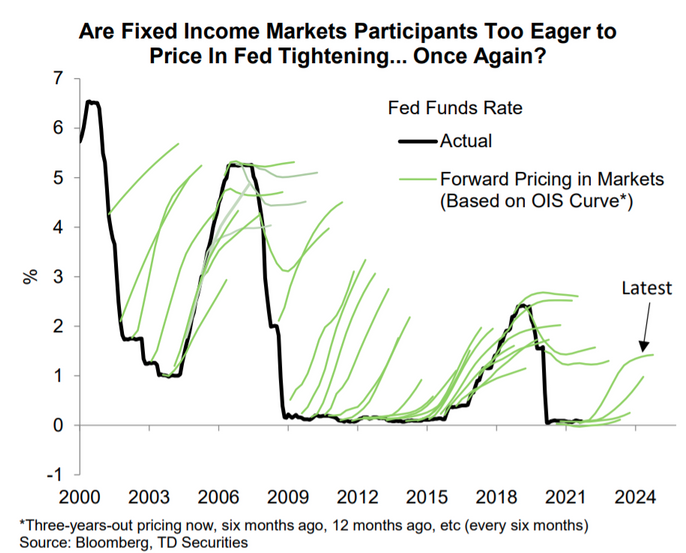
As displayed in the Fed Funds Rate chart above, dating back to 2000, most forward pricing for Fed Fund Rate hikes are either too early, or don’t come at all.
Research Report Excerpt #8
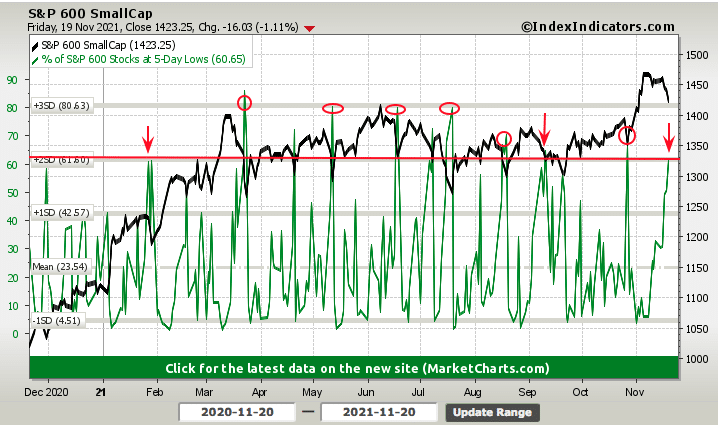
In our IWM/Small caps technical analysis, we highlighted the utility of the Williams %R stochastic for defining oversold conditions. The oversold conditions can also be viewed via the percentage of S&P 600 small cap stocks trading at their 5-day lows. More than 60% of S&P 500 small cap stocks are trading at their 5-day lows. There is certainly room for a bit more downside in small caps, with even more stocks trading at their 5-day lows, but not much more room, given the backdrop of a bull market.
Research Report Excerpt #9
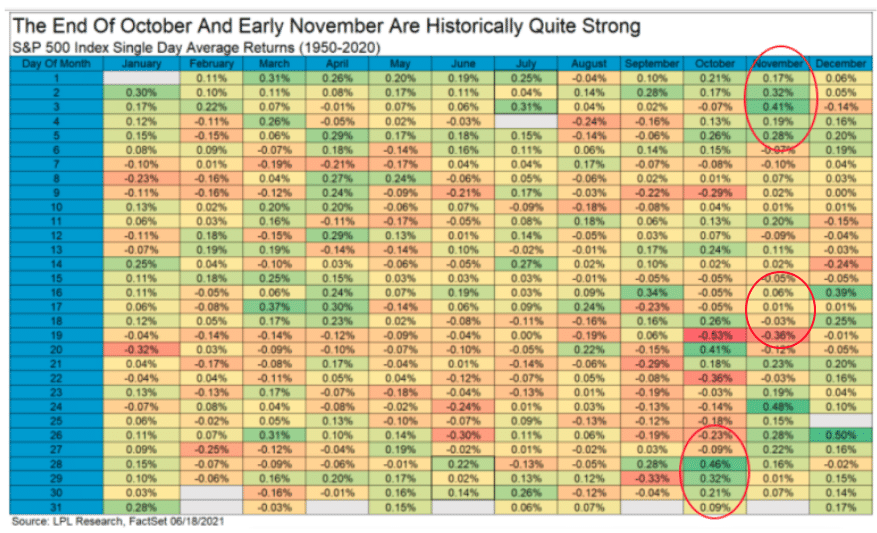
Since the S&P 500 achieved record highs on November 5th and with overheated conditions, Finom Group has been of the opinion that price action could get sloppy through the middle portion of November. That is exactly what has taken place, and as the market has followed the path of mid-November returns dating back to 1950.


