
Economic Data Strength
Markets have been grinding higher in a low-volatility market for several weeks, months even. Improving economic data, which have pointed to strong economic fundamentals, particularly in contrast to other regions, where stocks have been struggling, has largely supported the gains. But last week even emerging markets began to rally after the latest round of trade negotiations resulted in the implementations of further tariffs from the United States on Chinese imports. Nonetheless, markets follow economic and corporate fundamentals, both of which are continuing to show improvement despite the ongoing trade war.
On Thursday, it was reported that jobless claims dropped to their lowest level since November 1969, a sign of an extremely strong labor market. Separately, an Index of Leading Economic Indicators suggested the U.S. economy could look forward to 3% economic growth in the second half of 2018. The leading economic index rose 0.4% in, August following even stronger gains in the prior two months, the Conference Board said Thursday.
The reality that the economy is strengthening through the back half of the year is lost on many investors who choose to focus on mid-term elections and rising rates. One analyst that we continue to follow at Finom Group is Tony Dwyer of Cannacord Genuity. Dwyer remains the biggest bull on Wall Street with respect to his 2018 S&P 500 3,200 target.
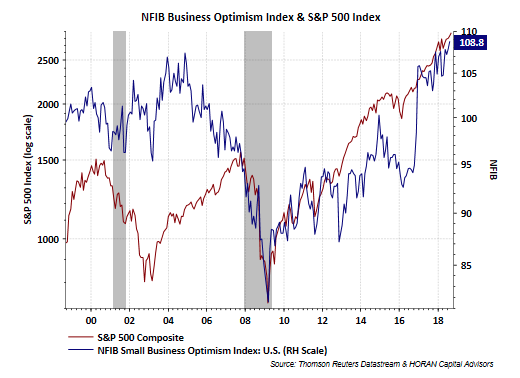
Prior to the release of jobless claims and the LEI this past week, a read on business sentiment proved even stronger in the prior month. The National Federation of Independent Businesses (NFIB) reported that August’s Small Business Optimism Index set a new record high at 108.8. The prior high mark for the index was set 45 years ago (July 1983) when the index reached 108. NFIB’s President and CEO, Juanita Duggan, stated in the report:
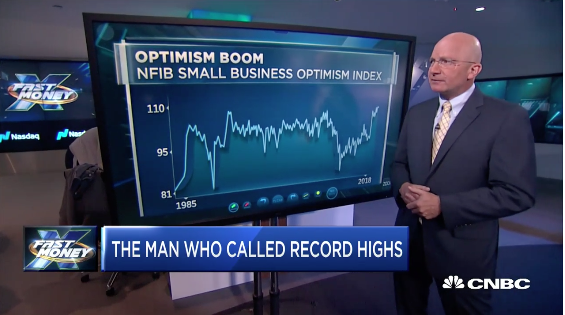
In Tony Dwyer’s latest market discussion on CNBC’s Fast Money show, he discusses with the audience why the market should continue on its path through year-end. He aligns some of his commentary with the strength in the latest NFIB report.
“From the point of a NFIB cyclical peak, the S&P 500 went higher by an additional 33% to its cyclical peak and a recession didn’t occur for a median 41 months.”
Investor Sentiment Less Than Optimistic
There remain some promising statistics for market bulls and bullish sentiment in general. Having said that, bullish sentiment is one thing the bull market rally has lacked for much of its duration. It’s why so many refer to the bull market that commenced after the great financial crisis as the most hated bull market ever.
According to the weekly survey of sentiment conducted by the American Association of Individual Investors, market participants are feeling somewhat tepid about the market, despite a lengthy move higher that took both the S&P 500 and the Dow Jones Industrial Average to record highs last week.

Individual investors’ expectations for the short-term direction of the stock market are largely unchanged from a week ago. The latest AAII Sentiment Survey shows a slight increase in neutral sentiment and a slight decrease in pessimism. Bullish sentiment, expectations that stock prices will rise over the next six months, held steady at 32.0 percent. The historical average is 38.5 percent. Neutral sentiment, expectations that stock prices will stay essentially unchanged over the next six months, rose by a modest 0.8 percentage points to 35.9 percent. Neutral sentiment remains above its historical average of 31.0% for the 30th time in 31 weeks. Bearish sentiment, expectations that stock prices will fall over the next six months, declined by 0.8 percentage points to 32.0%.
Mid-Term Election Angst
Historically, stock market volatility has increased ahead of the elections due to policy uncertainty. However, stocks also tend to rebound strongly coming out of midterm election-year lows. The S&P 500 has been higher one year after the midterm election than it was on midterm election day every time since 1946. The following, supporting historical chart from LPL Financial suggest strongly positive market moves are ahead:
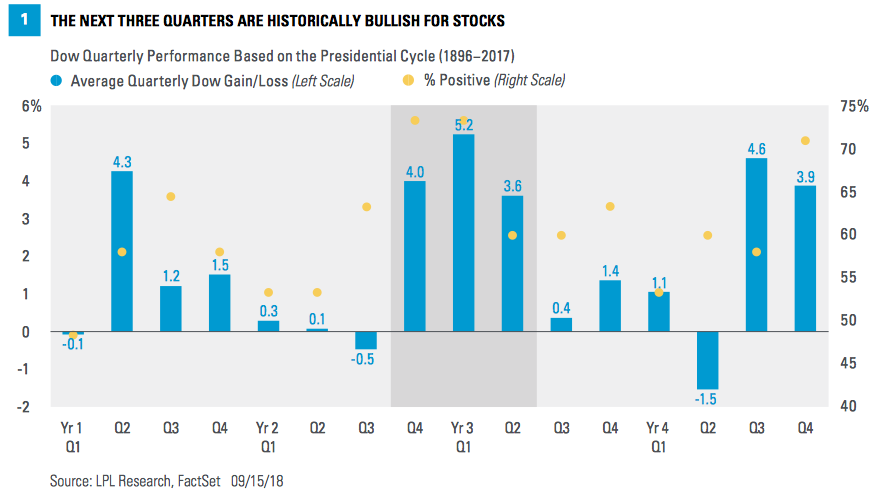
“As the chart shows, the period from the fourth quarter of year two through the second quarter of year three has historically been the best nine-month period of the entire cycle (going back 120 years on the Dow Jones Industrials). Note that some of this seasonal boost may have been pulled forward into years one and two, so it may be prudent to temper expectations some.”
The Week Ahead: Expected Move
Next week is a big week for the markets and the Federal Open Market Committee. Investors, economists and analysts around the globe will heavily follow the trading week. The Fed’s 2-day meeting is widely expected to culminate with a .25 bps rate hike and a post rate hike press conference on Wednesday. With this in mind, let’s discuss the S&P 500 weekly, expected move and discuss it with some context.
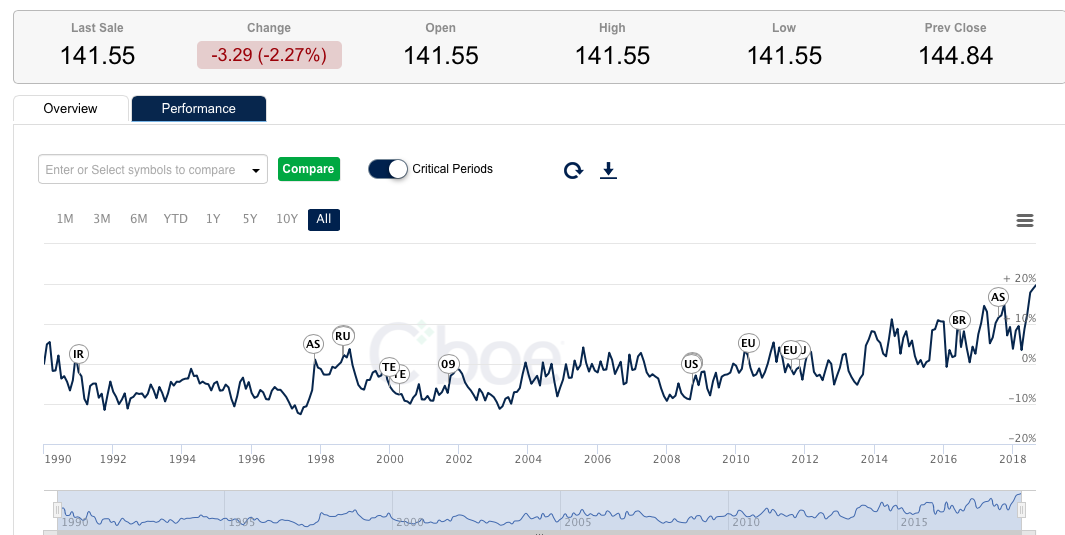
First and foremost, the expected move is supposedly a standard deviation. One standard deviation is the equivalent of 68% of all occurrences. In the last 25 weeks, we’ve closed in or on the expected move 22 times. Last week’s trade also fell on trend with the S&P 500 finishing the week within the expected move. There is extreme efficiency in the market place and there has been since beyond the February-March market correction. This is contrary to how the year began, or how the 1st quarter rounded out and as indicated in the screenshot above.
For the coming trading week, the expected move is $33. In addition to the Fed 2-day meeting, investors should understand that a blackout period for corporate share repurchases has begun as earnings season has kicked-off. We’ve had a few S&P 500 companies report already and 8 more will be reporting earnings this week. So in addition to the Fed’s 2-day meeting and blackout period for buybacks commencing this coming week, the coming week also represents the end of the quarter. The end of the quarter typically represents a period whereby fund managers rebalance positions and portfolios.
Speaking of Volatility
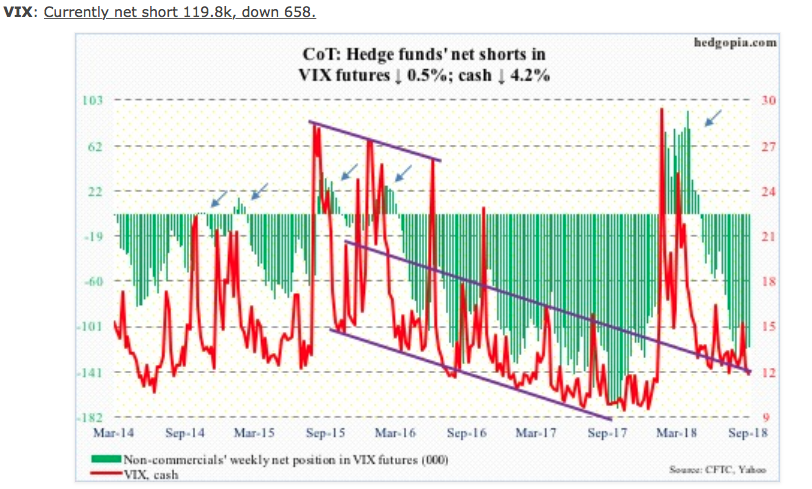
As shown in the chart above, hedge funds remain net short VIX futures, as they almost always are net short. There is little change week-2-week in the VIX futures positioning. Moreover and as it pertains to volatility indicators, the VIX of VIX Index (VVIX) has fallen below 91 after staying above or near 100 for several weeks. A reading below 95 suggests VIX call options have not been heavily favored recently. The SKEW index has also broken back below 142 after rising above 150 for several weeks on average.
A SKEW reading near or above 150 indicates heavy SPX call and put activity. Last, but certainly not least, the 21-day moving average of the CBOE equity-only put-to-call ratio ended the week at 0.589, which is low. On January 26 when the S&P 500, and several other major US indices, peaked before a quick, double-digit, two-week drop, the ratio bottomed at 0.543. Should the ratio get anywhere close to the aforementioned level in the next several sessions that would catch investors’ attention in our opinion.
Taking the confluence of all the volatility indicators we would suggest simplicity in the analysis. In short, a VIX reading below 12 is often short-lived, with the exception of 2017. It doesn’t mean an imminent rise in volatility, but it does attract hedging activity that leads to a higher VIX readings. Finom Group believes that is exactly what we saw in late August-much of September, outsized hedging activity due to a relatively cheap VIX, but it didn’t find the anticipated rise in volatility to date.
Earnings & Fed Tightening
As we noted earlier in this weekly research report, the economy is strong and corporate profits are following suit with great strength. There has never been a recession with corporate earnings growing. In terms of which companies are set to report results this coming week:
Nike (NKE) reports after the markets close on Tuesday, September 25, with the company expected to earn 62 cents in EPS on $9.88 billion in revenues, up +8.8% and +8.9% from the year-earlier period, respectively. CarMax (KMX), Accenture (ACN), ConAgra (CAG), KB Home (KBH) and Carnival Corporation (CCL) are some of the other major companies reporting results this week.
According to Thomson Reuters, The estimated earnings growth rate for the S&P 500 for 18Q3 is 21.7 percent. FactSet expects Q3 2018 earnings growth of 19.9% currently. The forward four-quarter (3Q18 – 2Q19) P/E ratio for the S&P 500 is 17.3. Now let’s talk a little bit about the Fed and the potential for policy error as we promised.
Yes, the Fed is tightening by raising rates and removing liquidity from the markets by reducing its balance sheet. We can look at the real federal funds rate (the Federal Reserve’s target short-term interest rate minus inflation) as an indicator of whether we are late in the cycle and/or what is the likelihood for policy error. As shown in the LPL Chart of the Day, the current real fed funds rate is right around zero (2% inflation and ~2% fed funds rate).
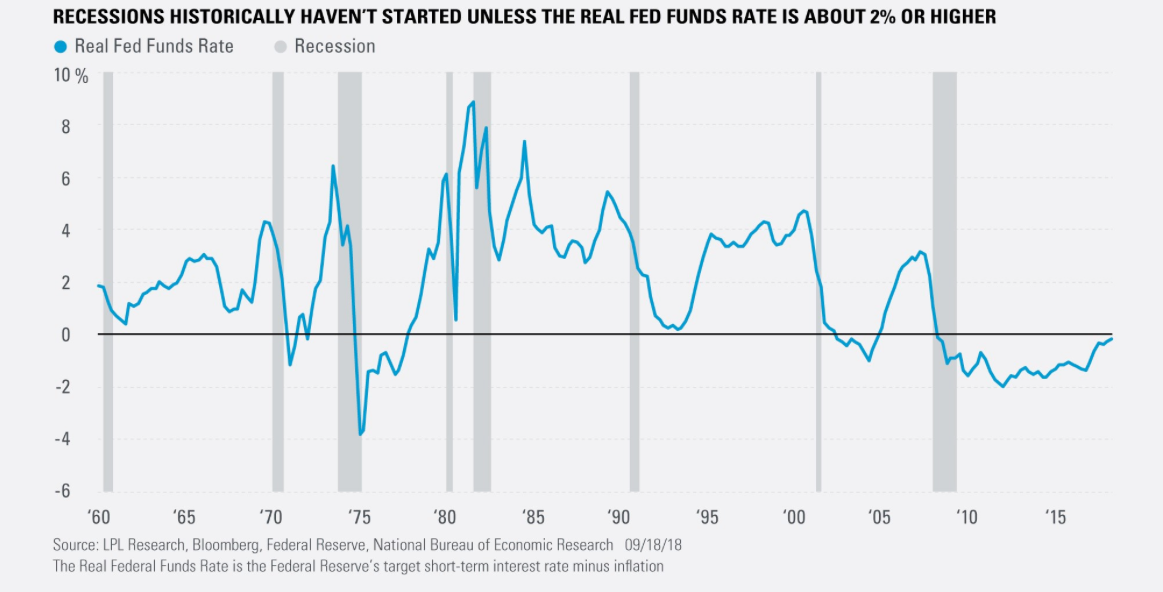
“The near zero level of the fed funds rate, on a real basis adjusted for inflation, suggests the Federal Reserve is not close to over-tightening,” noted LPL Chief Investment Strategist John Lynch. “That is a good sign for continued economic growth.” As the chart also shows, the real fed funds rate was 1.9% or higher ahead of each of the past eight recessions back to 1960.
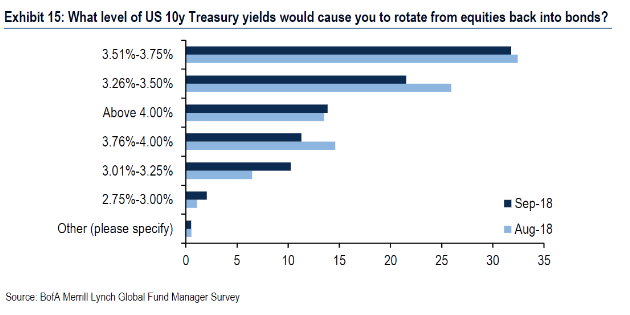
Most importantly though for investors, stocks should remain largely immune to the adverse impact of higher rates until the 10-year tests 4%, which is where price to earnings ratio starts to feel pressure in our opinion. Most fund managers surveyed by Bank of America Merrill Lynch said that 3.6% is the “magic number” that would make them rotate away from stocks into bonds.
The week ahead will deliver with it a great deal of insight into the economy and what the FOMC is thinking about rate hikes and the economy in the future. A second look at Q2 2018 GDP as well as Personal Consumption and Expenditures data will be released next week as well.


