

Research Report Excerpt #1
The absolute best investors I’ve encountered or engaged over the last 23 years of my investing career have ALL:
- Weathered market storms with a willingness to accept double-digit drawdowns.
- Resolved pessimistic and fearful narratives/headlines to deliver long-term opportunity/value.
- Remained optimistic.
- Understood time IN THE MARKET was more valuable than TIMING the market. (chart below)
- Recognized the best friend of an investor is TIME.
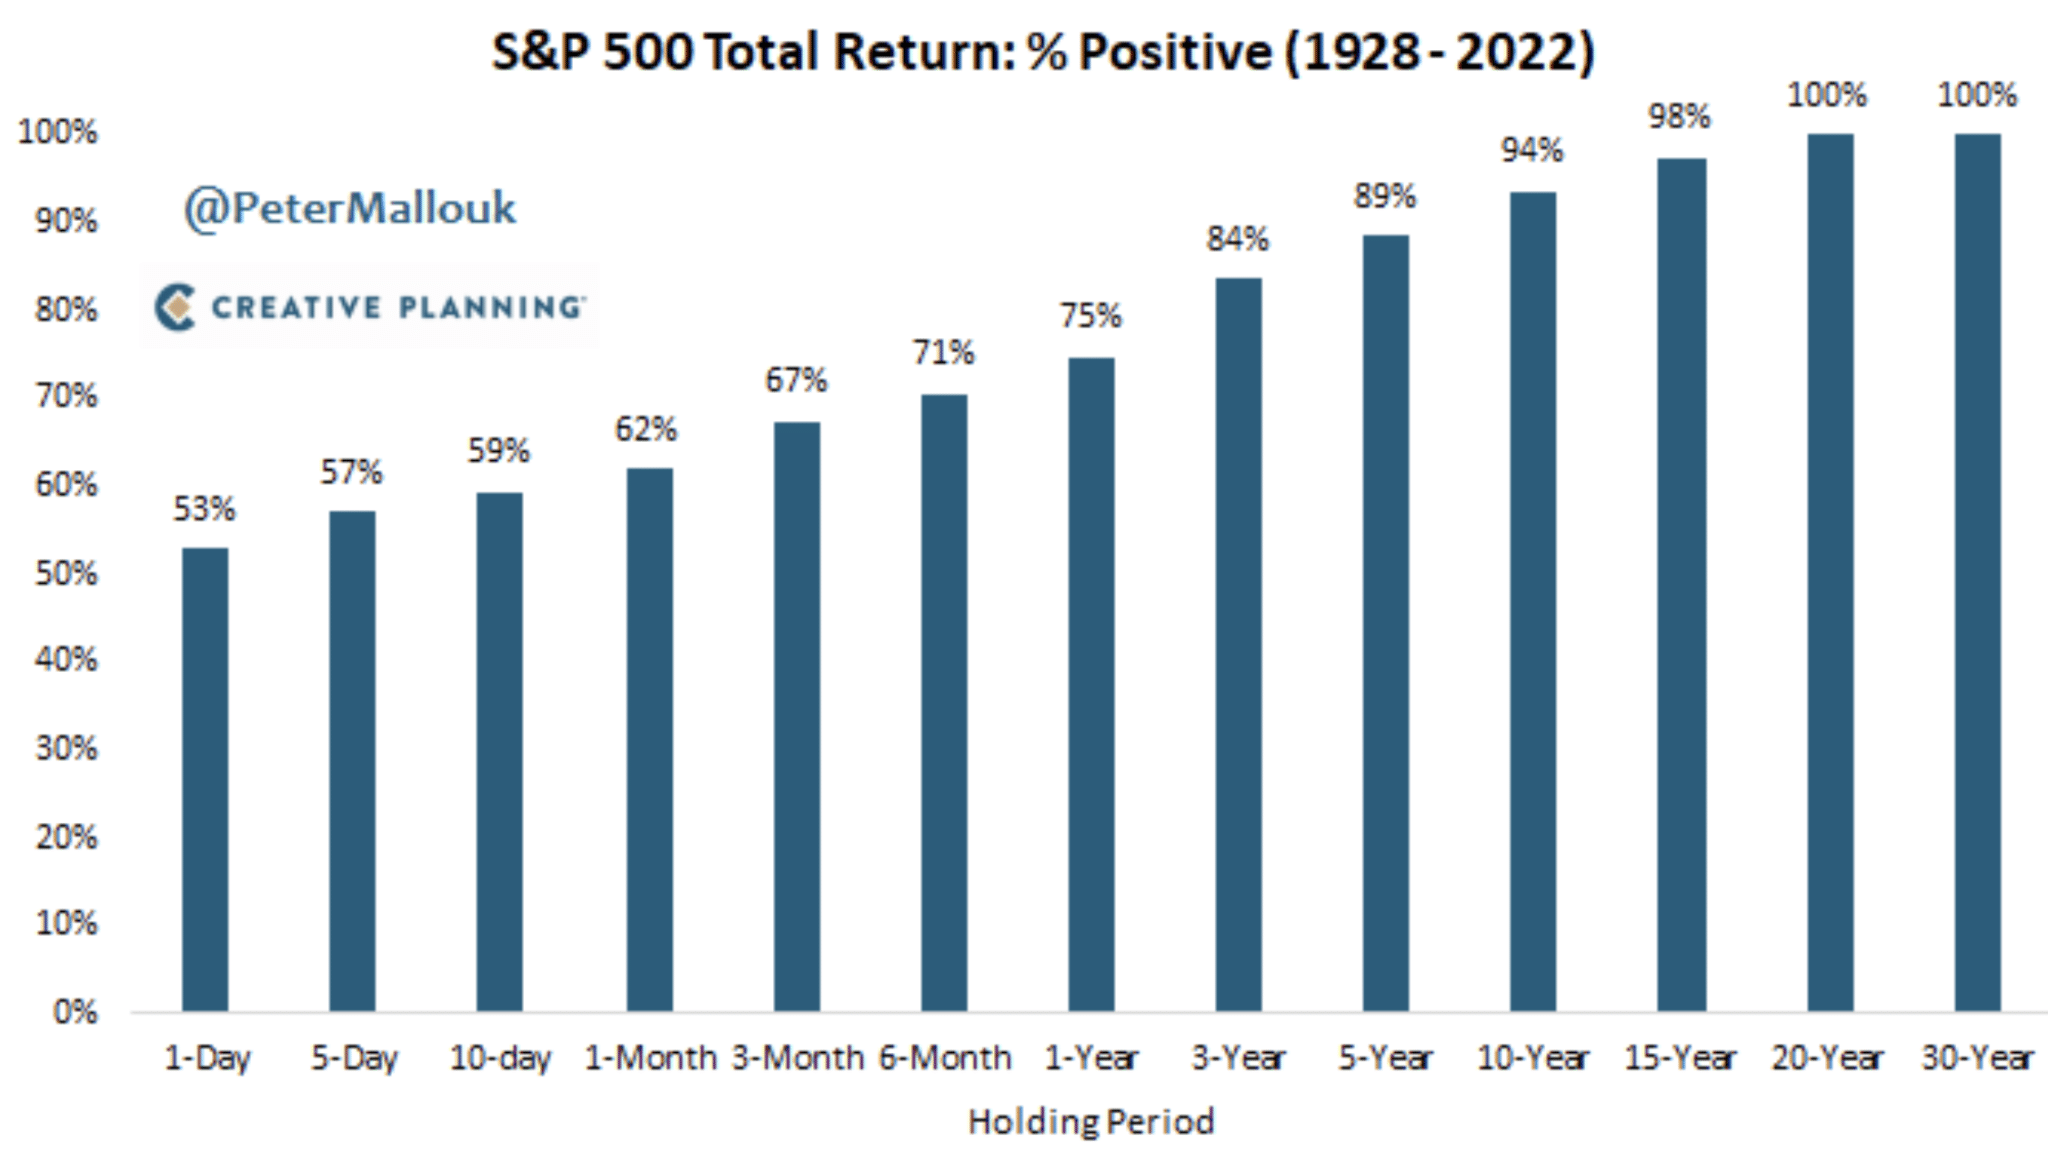
How does the market perform over time? The stock market is the opposite of a casino. The longer you play, the higher the odds that YOU win.
Research Report Excerpt #2
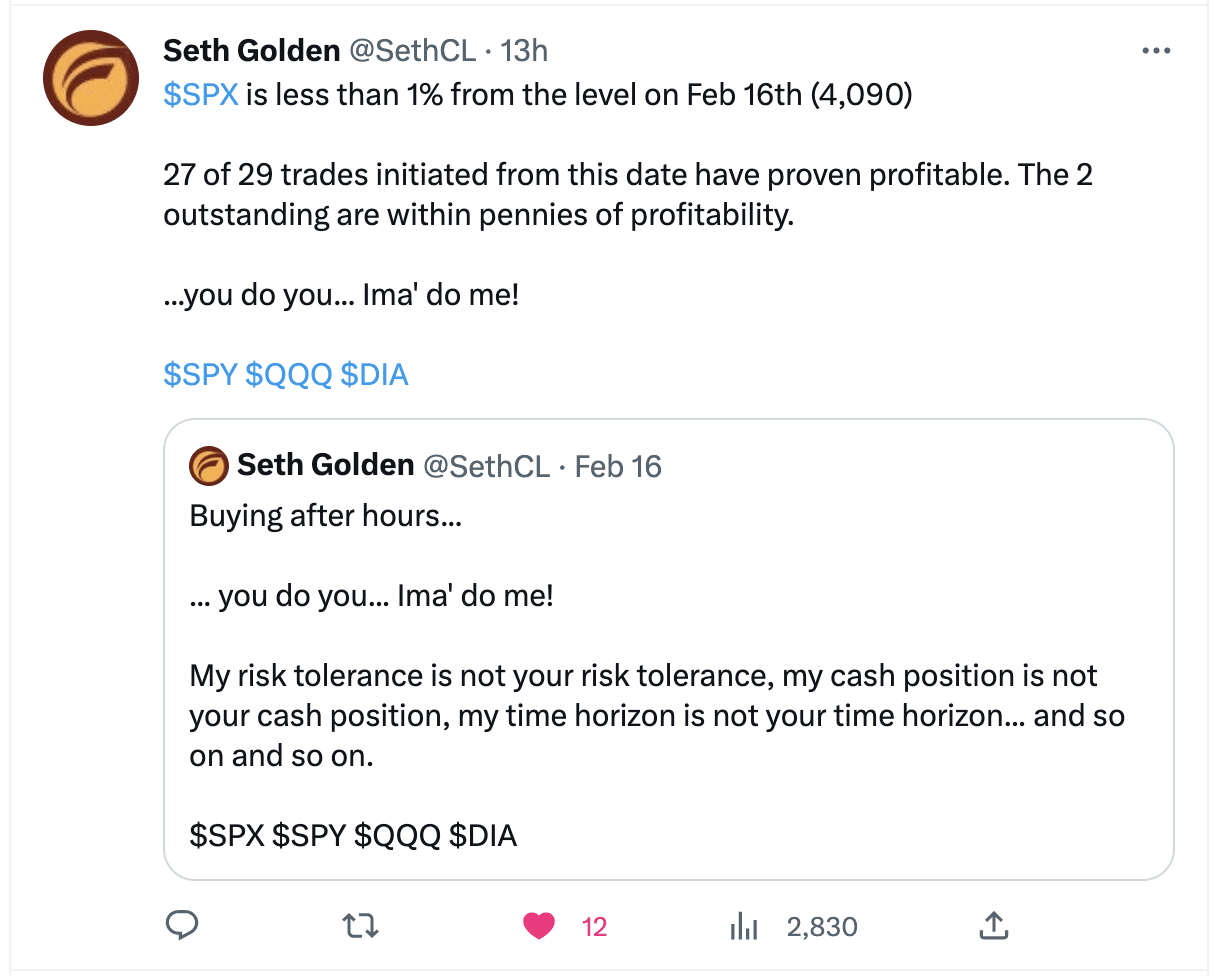
It should never be considered a secret as to what I’m doing within the Golden Capital Portfolio, when consolidation phases arrive. I bought the dip after hours on February 16, and all the way down to the lows of this past week; a total of 29 dip buys, with individual stocks and index ETFs. With the S&P 500 less than 1% from the February 16 closing value, all but 2 trades turned a profit, with the remaining 2 trades within pennies of their profit objective. Either way, the Golden Capital Portfolio’s value is higher to end this past trading week than it was on February 16, 2023.
Research Report Excerpt #3
So let’s review the so-called “2 and 10” study by Steve Deppe, which signaled at the end of November 2022.
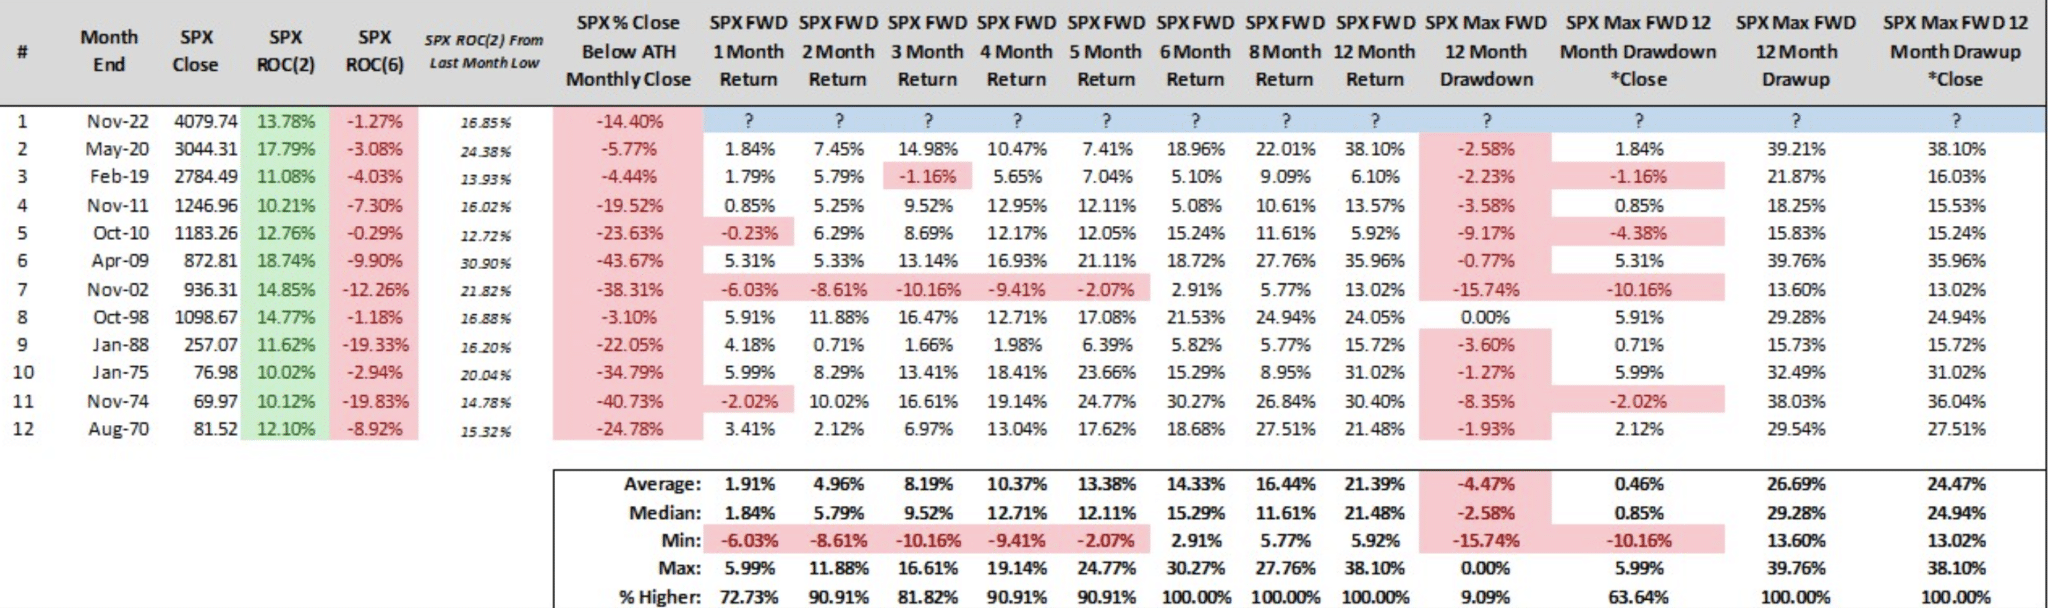
- The study above from Steve Deppe recognizes a 2-month, 10% or greater advance in the S&P 500.
- Last time this occurred, prior to the current thrust, was in May of 2020 with a 17.79% advance.
- 2 and 10 breadth thrust.

- This signal occurs with a trailing 6-month decline, as is noted in the study above, 4th column.
- What is most notable about the study is that the 6, 8, and 12-month returns after the breadth/ROC achievement, the market was positive every single time.
- Is it possible that this will prove the first time the signal will fail come mid-2023 and November 2023. Sure! We know this would prove the lesser probability however.
- One month after this thrust occurred the S&P 500 had fallen by roughly 5%, which has occurred in the past. However, the 2-month forward returns after a “2 and 10” breadth thrust have been positive 90% of the time. The only time such a thrust delivered a negative return was after the November 2002 thrust and unfortunately in January 2023 by about 1%. Yes, it is interesting to note that many of the thrusts came in the month of November, as shown in the study above.
Research Report Excerpt #4
In June of 2022, J.P. Morgan Chase’s CEO Jamie Dimon stated that an economic hurricane was coming our way. Only a month later, the company reported results that met and/or topped Wall Street analysts’ estimates. And the company continued with its expenditures going forward.
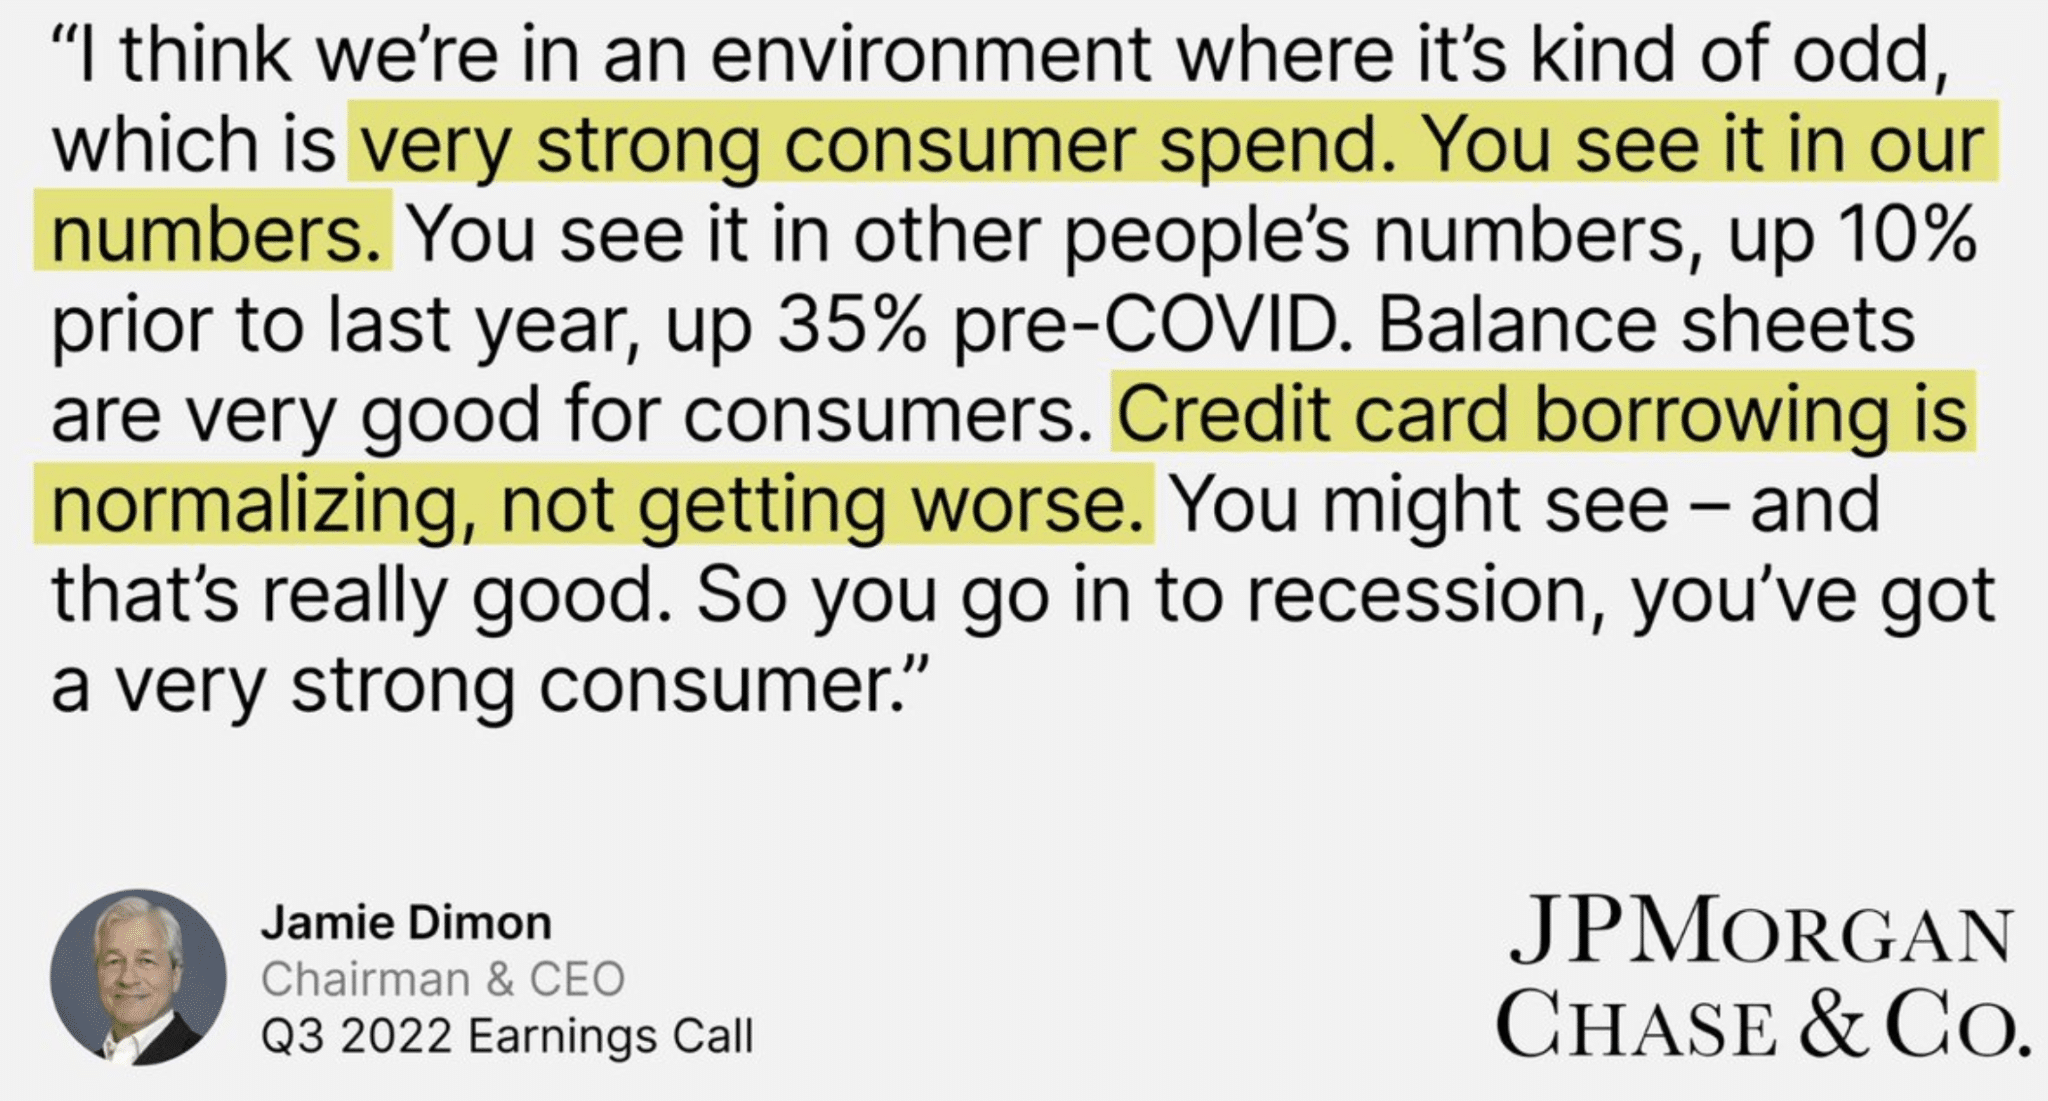

Maybe there is no such thing as “Wall Street elite?” For those of you who know how this all works, I think the answer is genuinely clear. Everybody is putting their best guesstimates out there, trying to predict the greater probable outcomes, and generally leaning on the side of pessimism and negative shocks to the economic system, even as this tends to be the lesser probable outcome.
Research Report Excerpt #5
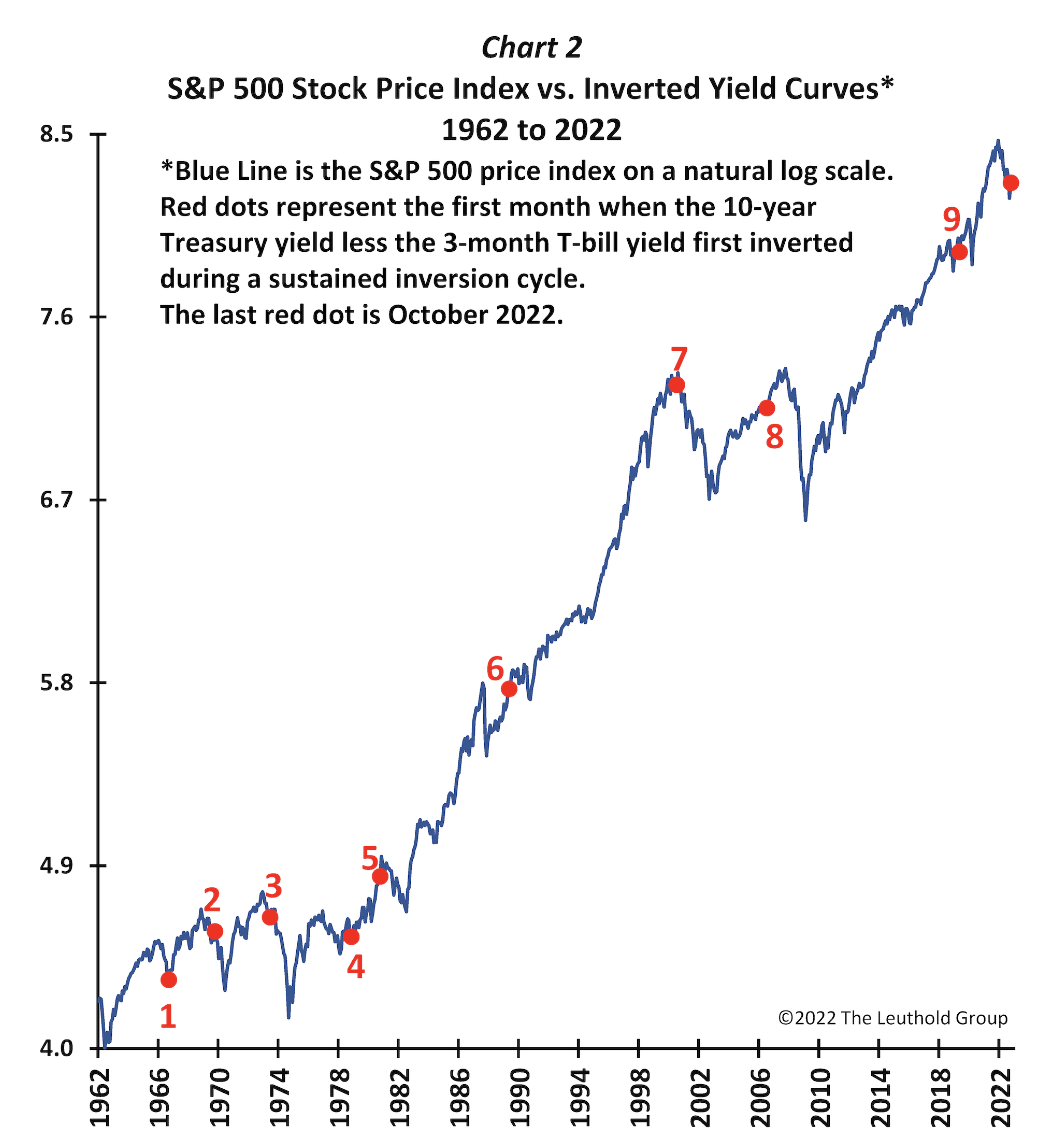
- Chart 2 shows S&P 500 performance with each of the 9 previous yield-curve inversions highlighted. The red dots mark the starting points (the initial yield-curve inversions).
- In some instances, when the curve first inverted, the stock market was near a high for that cycle (e.g., denoted by 2, 3, 5, 7, and 8). That is, the S&P 500 had not shown any “pre-inversion” slump leading to an even larger post-inversion decline. In 1980, 2000, and 2006, the stock market was either at or still rising toward its peak as the yield curve inverted, while in 1969 and 1973, the S&P 500 had fallen only modestly before the inversion.
- Hence, leading up to 5 of the past 9 inversions, the stock market was near its cycle high.
- Consequently, when the yield curve inverted in those five occurrences, the stock market’s downside risk was magnified as the market had to play catch-up when an inversion became a reality. As shown in Chart 1, in four episodes out of nine, performance was flat or negative in the year after an inversion, and second-year returns were negative in two cases. When there was no pre-inversion setback, fallout for the stock market from an inverted yield curve was much worse.
- However, when the stock market had already been discounted pending turbulence from an inversion, the consequences were less serious. Preceding the inversions of 1966 and 1978, the S&P 500 was off -18% and -19%, respectively. In 1989, although the stock market had been rising when the curve initially inverted, it was still in its recovery mode from the Great Stock Market Crash of 1987. Similarly, in advance of the 2019 yield-curve inversion, the S&P 500 had suffered close to a 20% collapse in late 2018 after having basically traded sideways since its 2018 high.
- In each of the occasions where there was a pre-inversion correction in equities, the S&P 500 performed well in the aftermath of the 10s/3m inversion: Following the 1966, 1978, 1989, and 2019 inversions, the S&P 500 was healthy for the next couple of years. Furthermore, in the case of the May 2019 inversion, stocks performed okay until the pandemic crash.
Research Report Excerpt #6
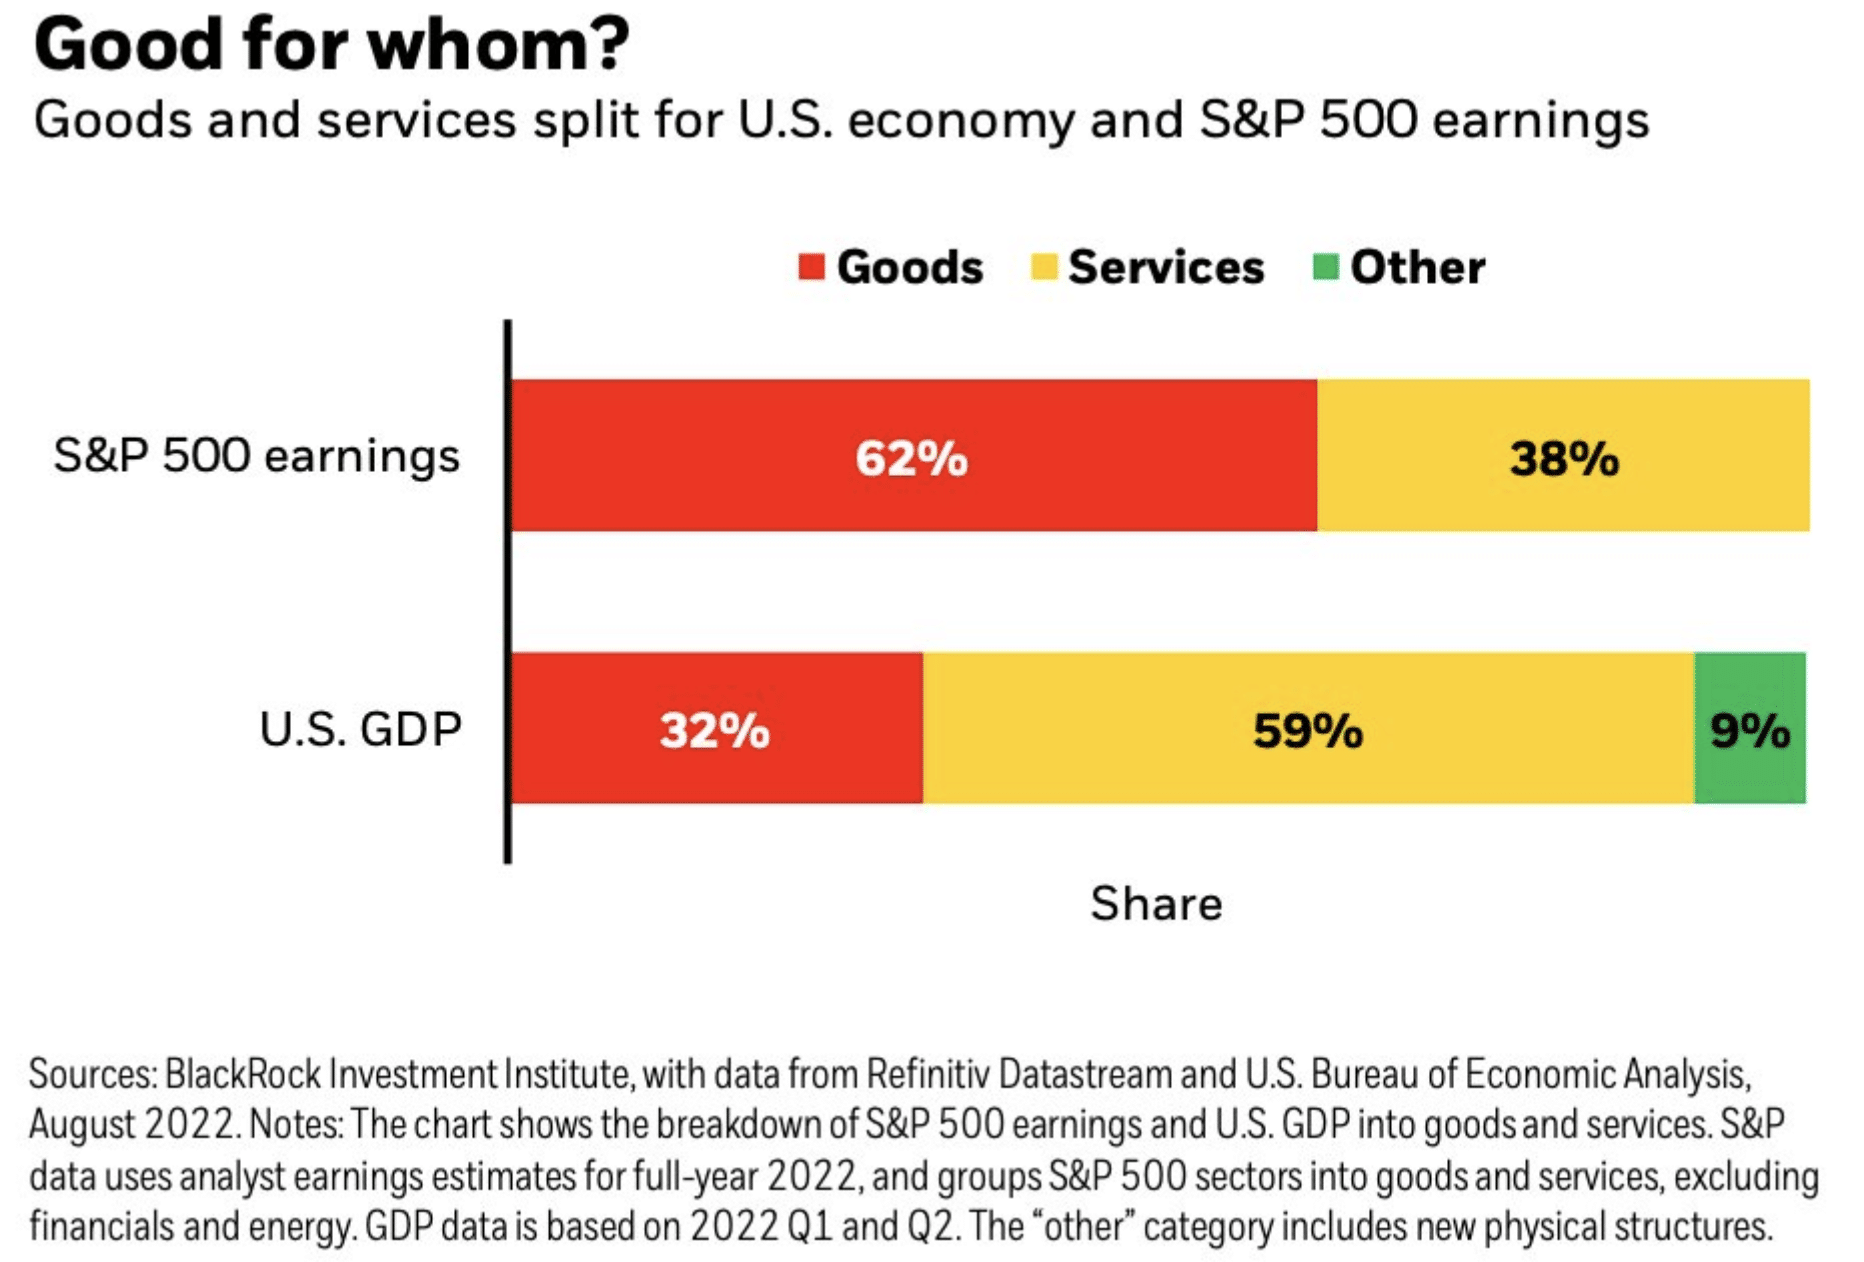
One of the more heavily weighted components/metrics of an earnings model is the ISM Manufacturing Index. While the U.S. economy is not a manufacturing-based economy, the S&P 500’s earnings come largely from GOODS, not SERVICES. The following chart pulls together this forward-looking statement (chart via Blackrock):
Research Report Excerpt #7
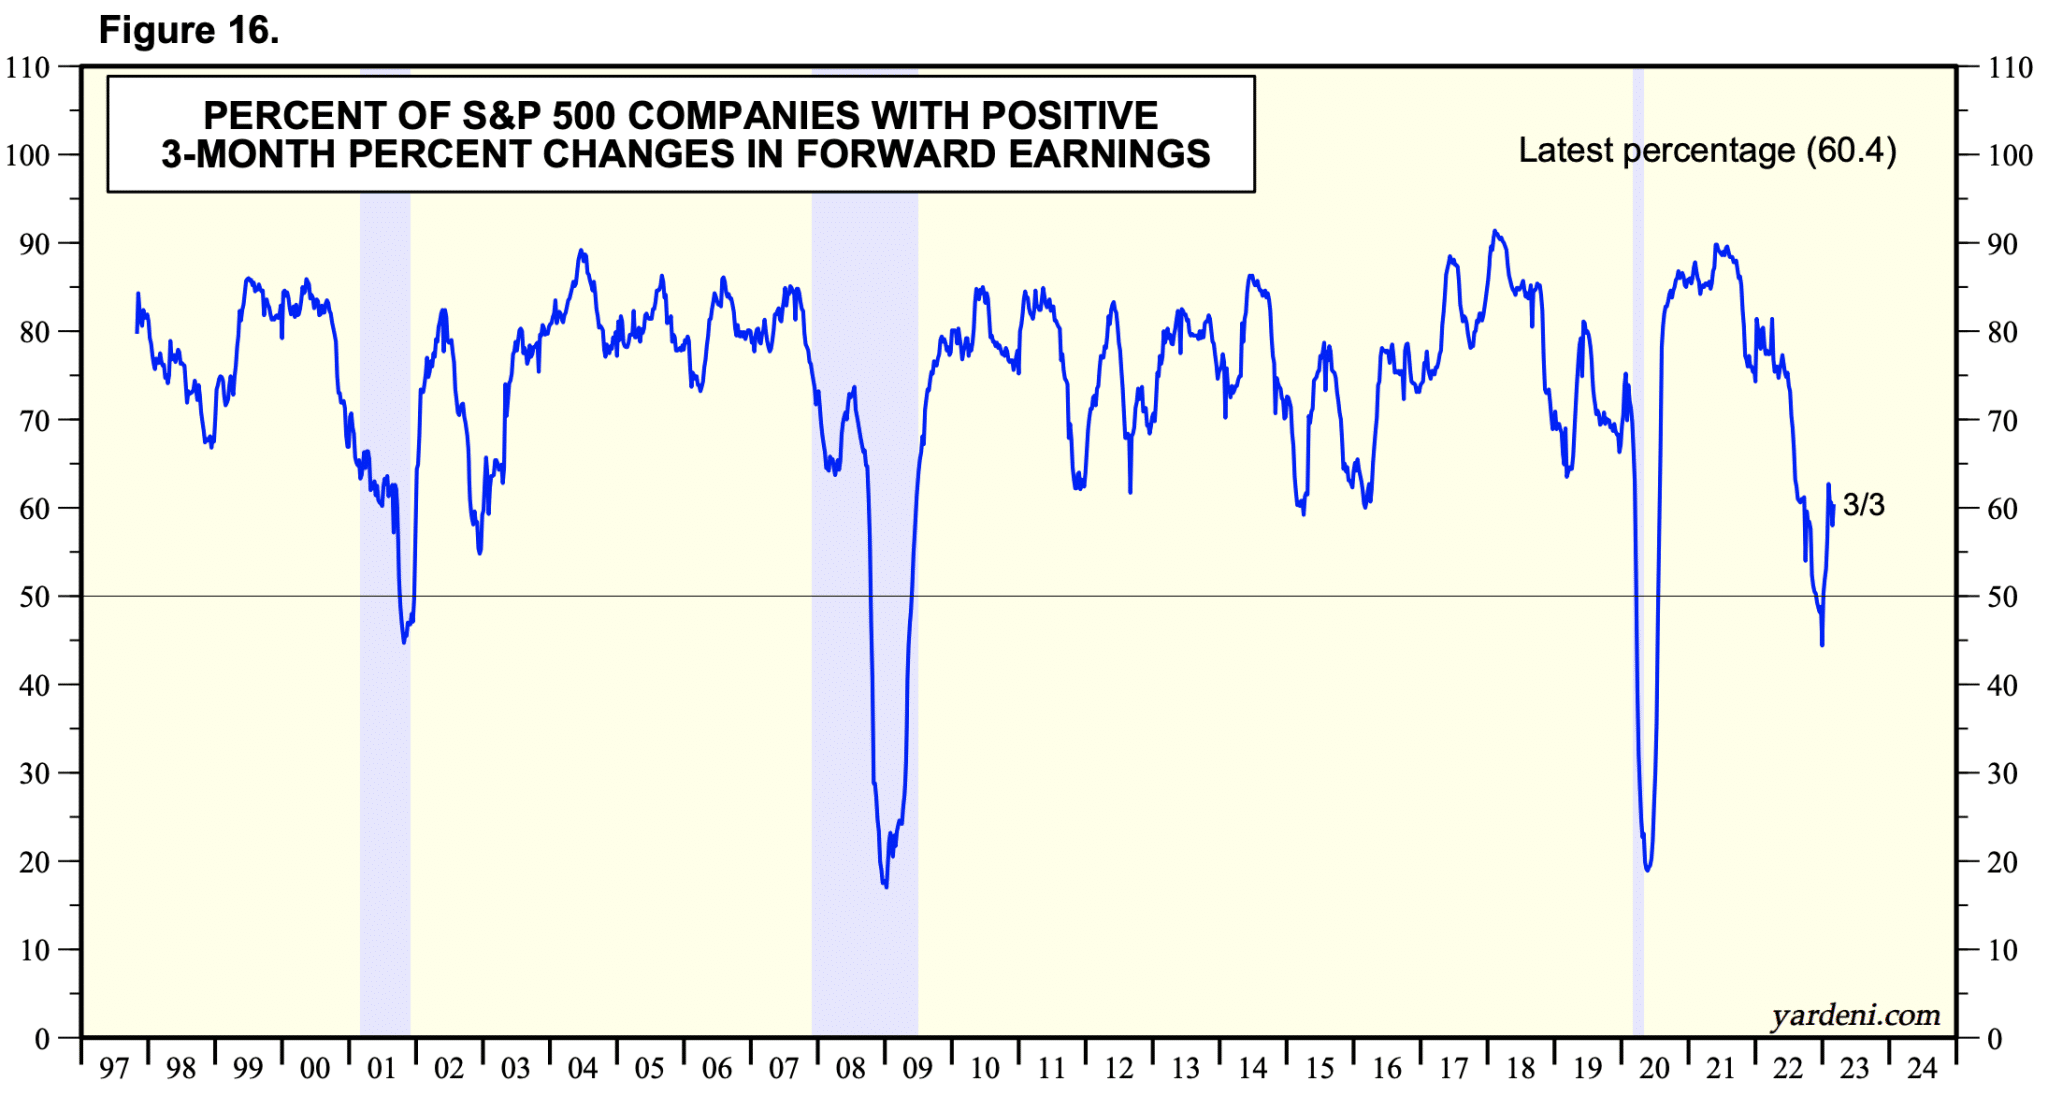
We’ve seen an inflection in the PERCENT OF S&P 500 COMPONENTS WITH POSITIVE 3-MONTH PERCENT CHANGE IN FORWARD EARNINGS. I can’t scream this any louder  , even though very, very few people other than Dr. Ed Yardeni are talking about this occurrence. Additionally, reporting companies during the Q4 2022 reporting season cut guidance at a 10.9% rate this quarter, which is actually a slower rate than the 13.9% during the previous quarter.
Research Report Excerpt #8
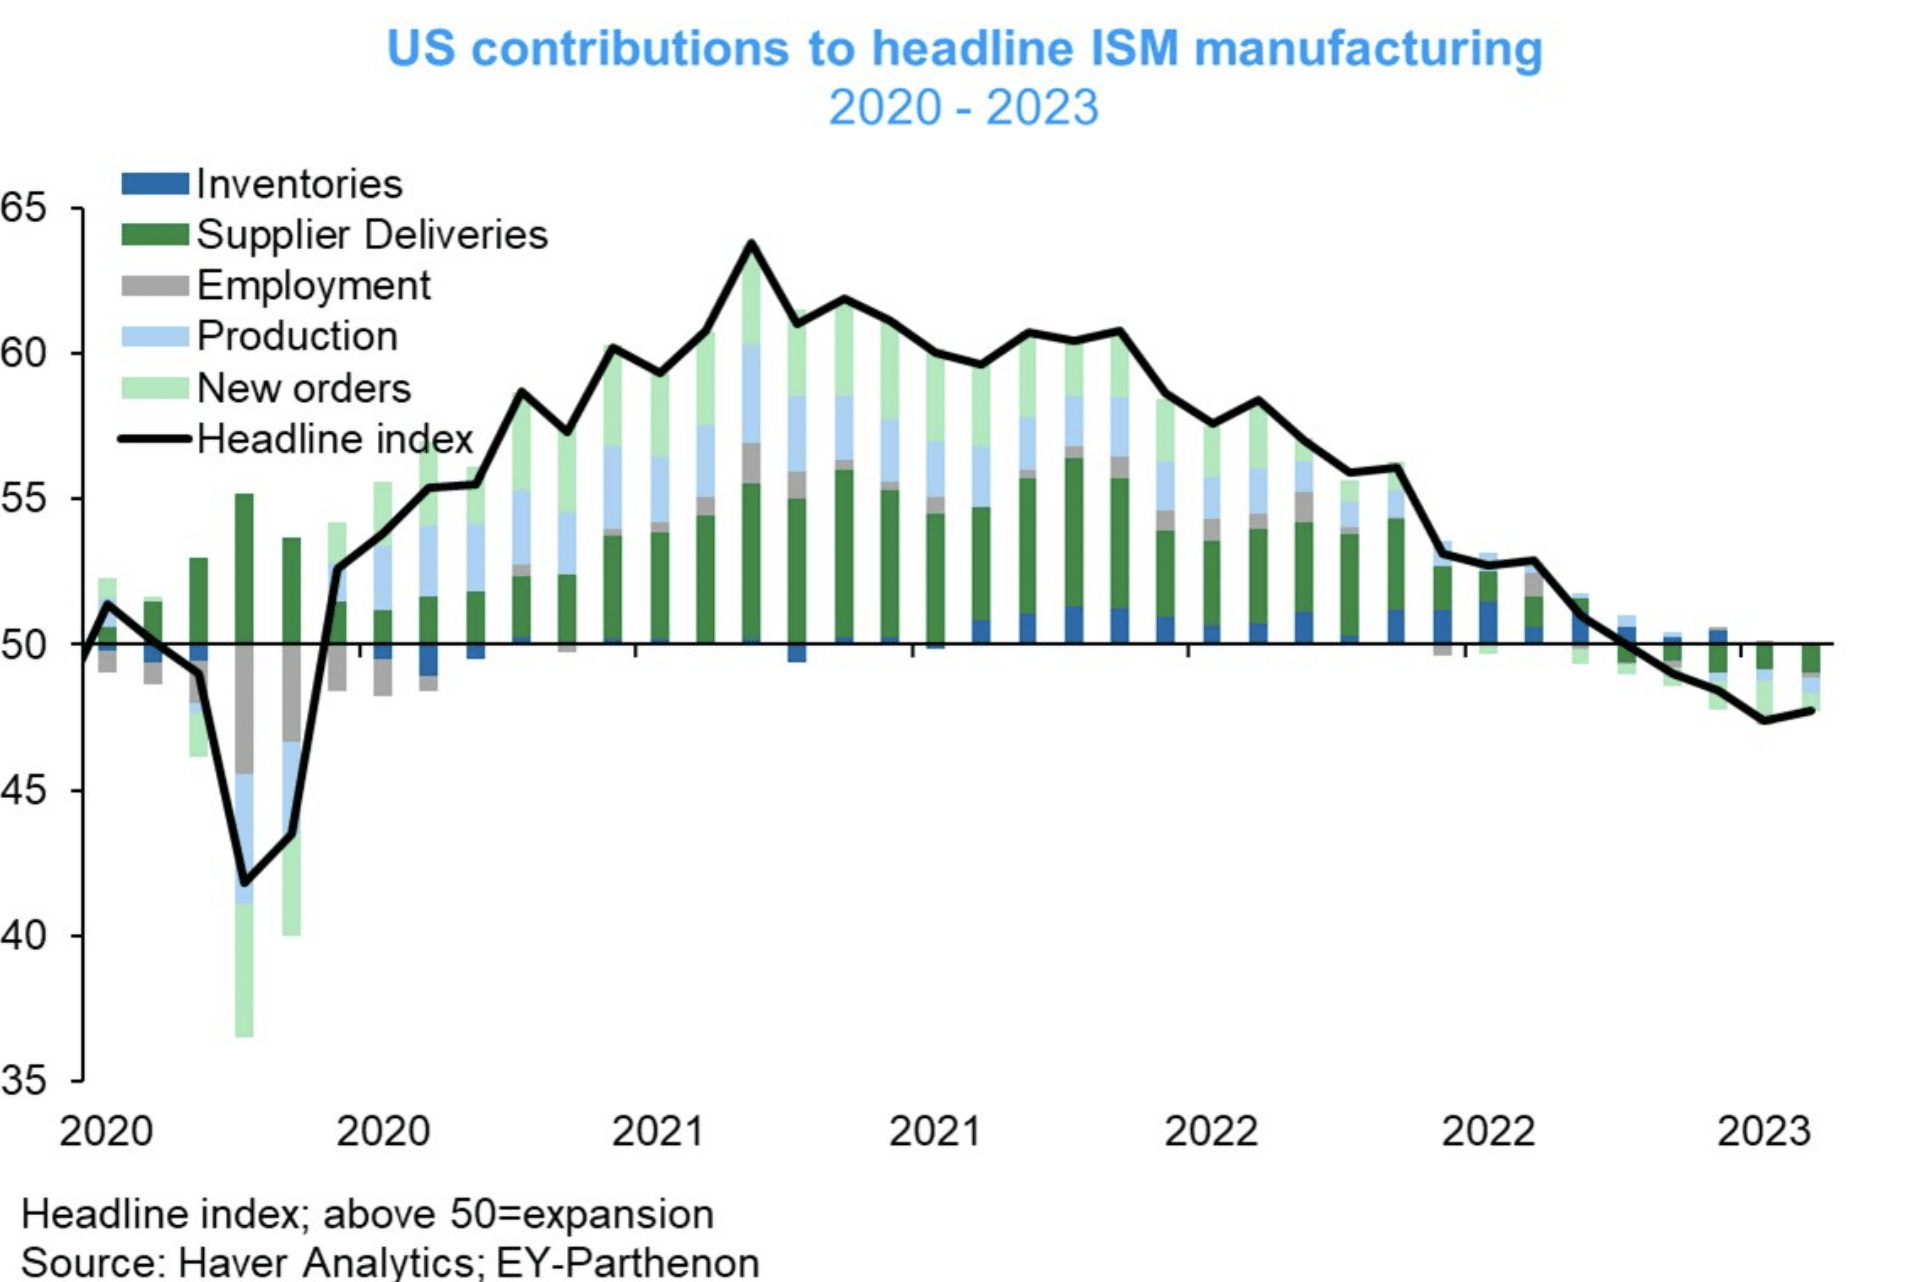
- New Orders 47.0 (+4.5pt)
- Production 47.3 (-0.7pt)
- Employment 49.1 (-1.5pt)
- Supplier Deliveries 45.2 (-0.4pt)
- Backlogs 45.1 (+1.7pt)
- Inflation 51.3 (+6.8pt)
- EY Parthenon’s Gregory Daco
Research Report Excerpt #9
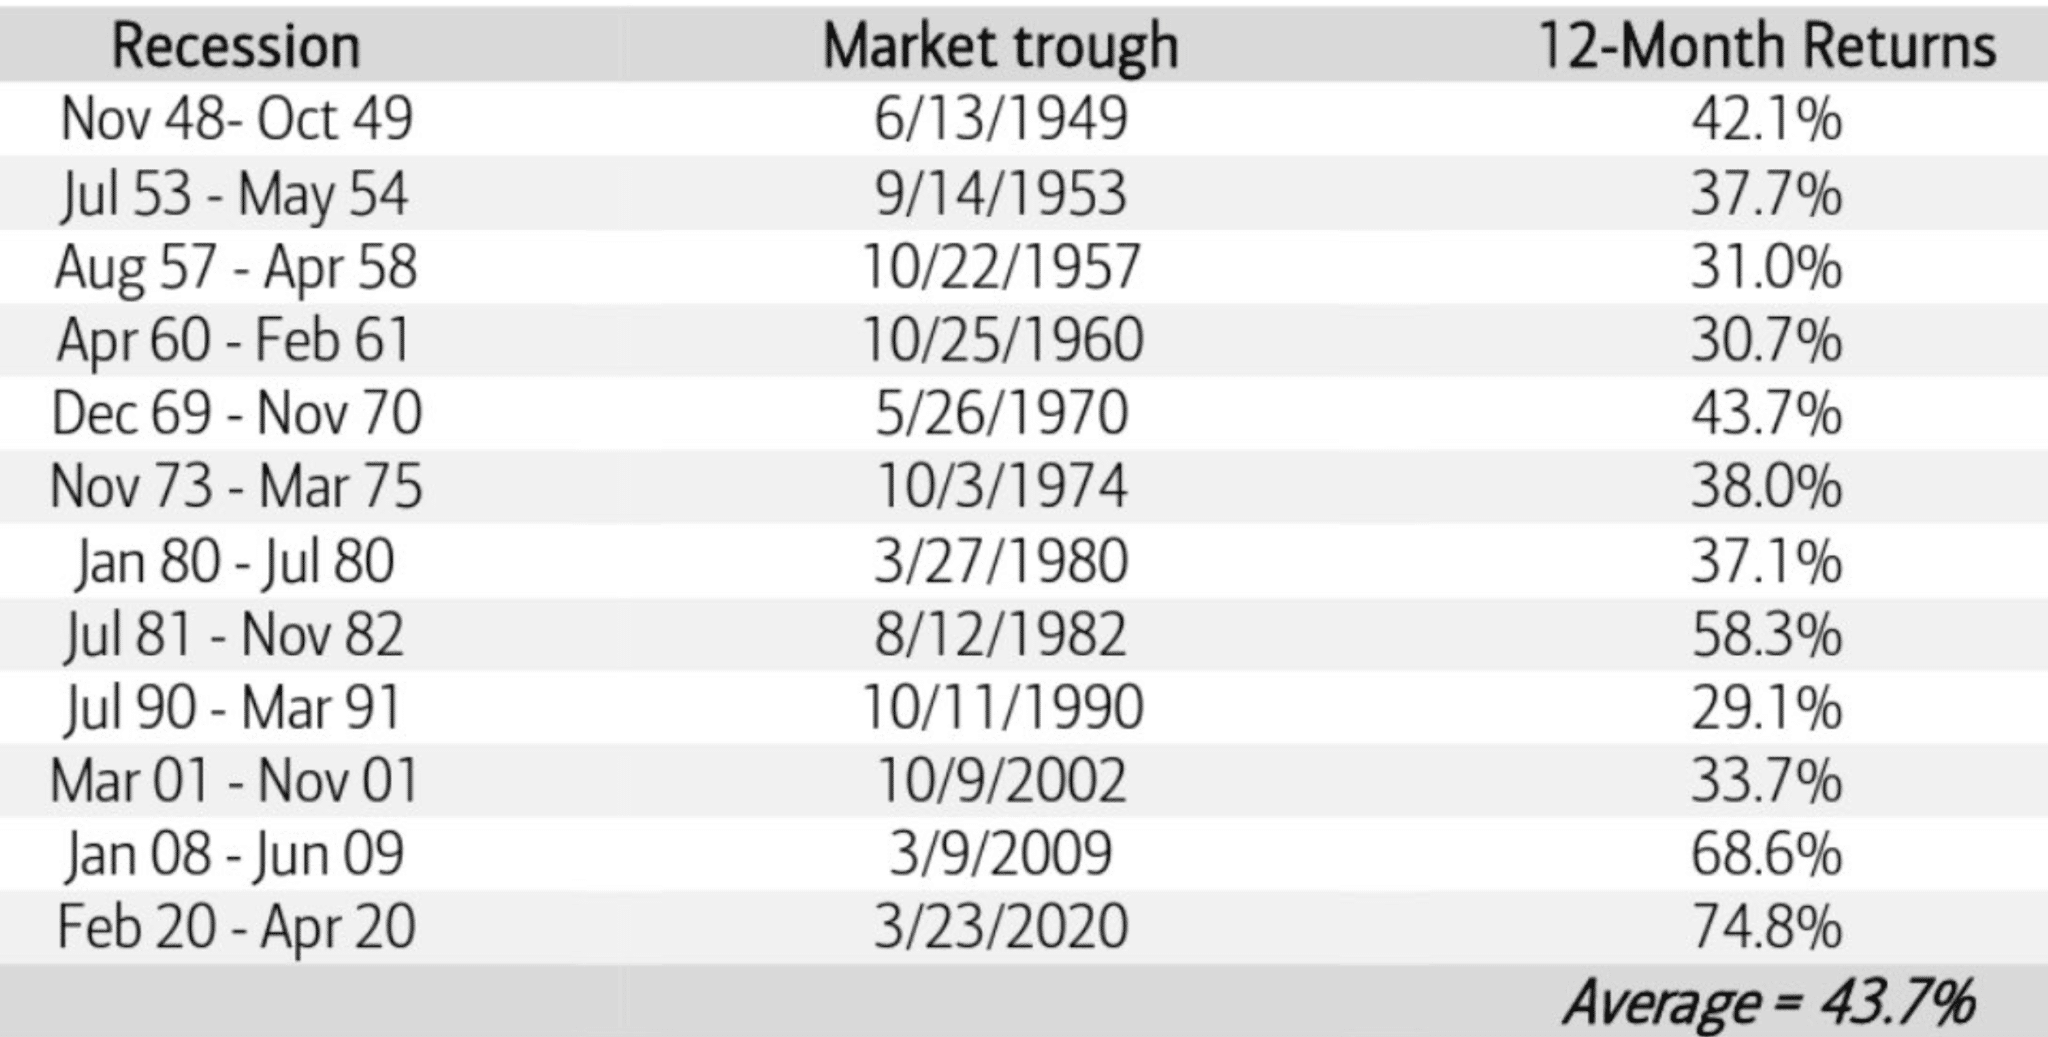
Keep in mind that since 1957 the period of a recession and 12 months after.
- Average return through recession = -5.5% annualized return
- Average return 12 months after trough = +43%
- Average return 12 months after recession +21% annualized.


