
After consecutive weeks of -2%+ drawdowns for the S&P 500 (SPX), and the Nasdaq (COMPQ) dropping below its 50-DMA, all major averages are attempting a bounce back this week. Thus far, the technicals are proving supportive of the bounce ahead of Wednesday highly anticipated FOMC rate announcement and Fed chairman’s press conference.
The chart of the Nasdaq below, identifies a bounce of the 50-DMA and is akin to what the S&P 500 executed on Friday of last week and with the benchmark index briefly breaching its 50-DMA intraday, before bouncing and closing above the key moving average.
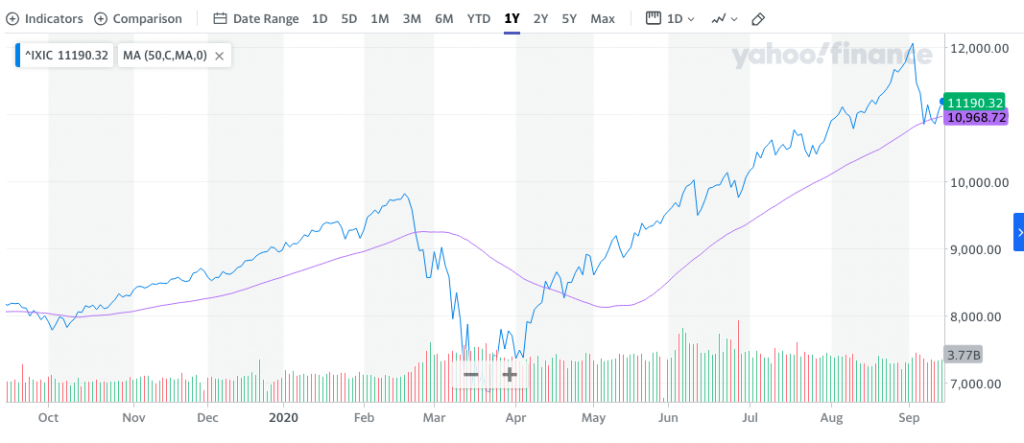
For whatever reason, the investing public seems to emphasize such breaches and closes below moving averages as bearish. While it may not be a bullish technical move, perspective is needed in order to benefit from such a move. Markets are almost perpetually in an uptrend, therefore, when technical weakness arrives it is often more advantageous to align for a technical rebound than it is to fear greater downside. This is especially true when the major moving averages are in an uptrend alongside the index itself. Does it look like the 50-DMA is in an uptrend with the Nasdaq? Well, “alrighty” then!
Media narratives are often the promoters or distractors from the reality of ideal investor positioning, as they tend to plague investors with more fearful narratives when markets lose upward price action, as they have recently. The recent “media craze” highlighted SoftBank’s $4bn trading in the mega-cap tech/FAANG names in recent months, which it believes created the last leg of the Nasdaq’s extended and overheated rally.
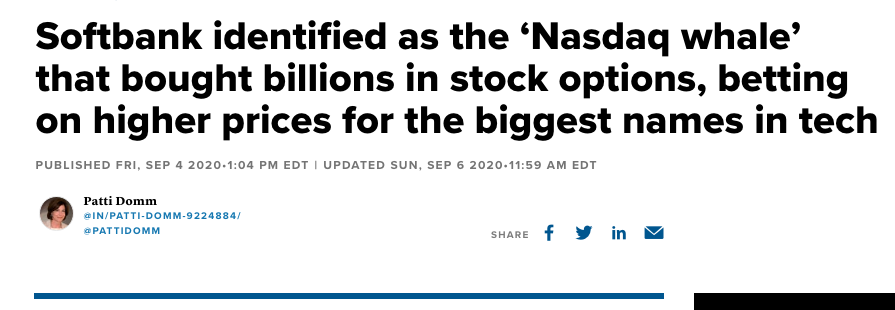
“According to the Wall Street Journal, SoftBank had made regulatory filings showing it bought nearly $4 billion in shares of Amazon, Microsoft, and Netflix, plus a stake in Tesla. The paper quoted a source saying that SoftBank spent roughly $4 billion buying call options tied to its stock holdings, but also in other names. It then could profit from the run up in stocks and subsequently unload its position to other parties.
SoftBank was trading in names that are among the key drivers of the stock market. Apple, Amazon , Microsoft, Facebook and Google equal about a quarter of the S&P 500, and they have been drivers of a big chunk of its gains. One options trader explained that those names can be proxies for the market, and can be hedged against the S&P 500 and vice versa.”
Remember the time the stock market went up since World War II, no? What about more recently and from 2009-present day? Are you picking up what I’m putting down here folks? If it’s not SoftBank, it would be someone else. Did Facebook, Google, Amazon, Apple or Microsoft offer investors poor metric performance within their latest quarterly filings? Did they warn of WORSE earnings or sales performances ahead? If it wasn’t SoftBank, and as history validates, other entities would have likely have/been buyers of such quarterly performances from these mega-cap names. And there in lay the difference between recognizing what markets do over time vs. what the media incessantly promotes. The media promotes fear, assuming the opposite of market history and reality.

The media desires for investors to assume, that if not for SoftBank, market and/or stock prices would be of lesser value than that of the present day. Such media outlays and emotion-evoking proliferations are never-ending and part of the media’s business model. This is how they garner an audience, which in turns drives advertising on the media platform. Today’s fear-laden narrative is brought to us by way of the latest commentary from Blackstone, the largest private equity, alternative investing firm in the world. They must know what they’re talking about then, right?
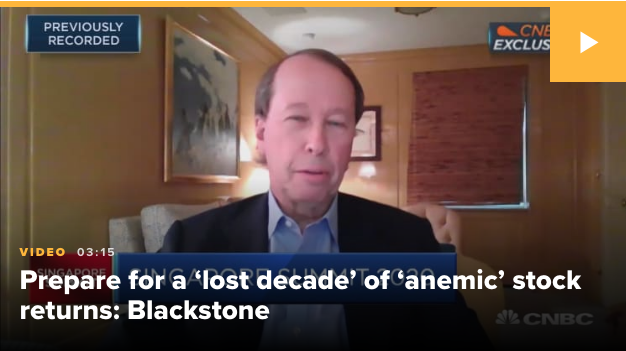
Do you think this included video headline from CNBC’s recent interview with Blackstone’s Vice Chairman Tony James is going to create optimism for investors? The coming years could be a “lost decade” for equity returns as companies struggle to grow their earnings, Blackstone’s Executive Vice Chairman, Tony James, told CNBC on Wednesday morning. Isn’t he “a peach”? Or… is this just Tony being Tony and the media simply looking for the next fearful story as markets are seemingly uncertain and with the backdrop of an 11% correction in the Nasdaq and 7.4% correction in the S&P 500, peak-to-trough? Well is it? Throwing a lot of questions out there to think about ahead of the FOMC meeting today, but I think the best thing to recognize is that… well we’ll get to that in a moment and after we travel back in time.
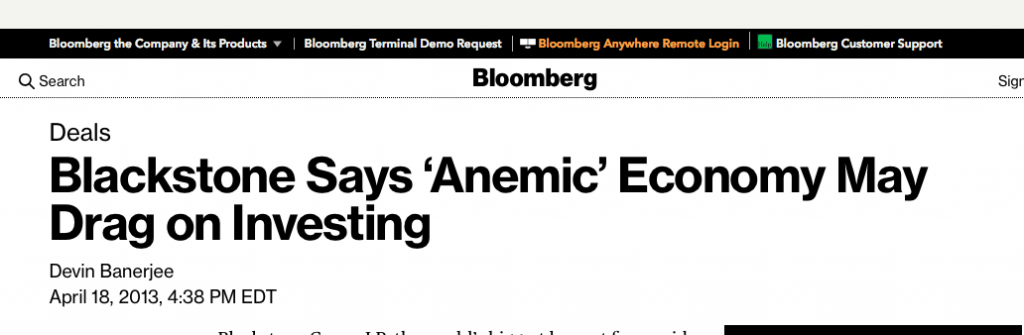
That headline was take from back in 2013, in an article written by Bloomberg, based on commentary from Tony James and post the company’s quarterly earnings release. It would seem as though Tony has an appreciation for characterizing the surroundings of markets and the economy with the term “anemic”. One more question if I may: How’d that outlook/forecast pan out? Alrighty then! The guesses will always be coming from the participating financial market elite, but recognize they are little more than guesses based on individual experience and potentially individual bias. As I always say, if anyone could predict the future in absoluteness, the Lottery would be the place to do so, not the financial markets.
Now let’s say the noise produced by the media fear-driven narratives did impact your emotional well-being over the last 2 weeks and as the SoftBank trade “dried up” and markets consolidated magnificent gains over the last 5+ months. Let’s say you sold in to such consolidation. Maybe you bought protection against market downside, some VIX calls, maybe VIX-Exchange Traded Products (VIX-ETPs). If that was the case, what now? The Nasdaq is up 3% week-to-date, the S&P 500 is up nearly 2% and the VIX itself was down some 12% last week with one of the more popular VIX-ETPs (UVXY) dropping from $27 to below $20 on Tuesday. How’d that protection work, those “hedges”? The point is:
“Far more money has been lost in this business betting on the end of times and hedging things like COVID rather than making great bets on great companies and allowing them to compound.”
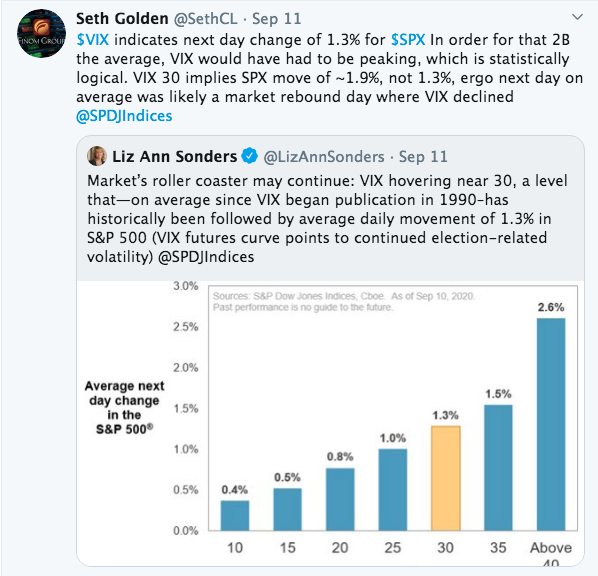
Charles Schwab’s Liz Ann Sonders, frequently appears on Bloomberg and CNBC, offered the above tweet. In fact, she’s quite the Twitter tweeter. Based on her tweet and supportive chart, one would assume more volatility ahead. Her offered calculations didn’t make sense and are invalid, which is why I commented. That tweet and comment was offered on Friday of this past week and with the VIX falling, while the S&P 500 had another rough session. But as I commented…
“VIX 30 implies SPX move of ~1.9%, not 1.3%, ergo next day on average was likely a market rebound day where VIX declined.”
So what happened on the next trading day of the week, which was this Monday? S&P 500 had a nice rebound and the VIX declined. Of course, none of this would have been recognizable through the Sonders’ tweet. Be careful on Twitter folks, be careful! Alright, enough of the “everyone else is out to get us”, Seth! I agree, let’s move on 😉 ! Here is something that we offered to our subscribers this past weekend in our weekly Research Report and in the context of dissecting the market consolidation/correction afoot:
“Anticipating further price consolidation may continue to aid in level-setting expectations near-term, and given the robust rally in markets since the March bottom. The question we’re moving forward with is simple; to what extent IS THIS A HEALTHY CORRECTION VERSUS THE START OF A MORE SUBSTANTIAL DOWNTURN? We do not have evidence thus far to suggest it is more than the former at this point. We remain of the opinion this is a healthy and to-be-expected correction, providing long-term investors with opportunity to buy the dip and extrapolate previously outlined returns going forward.”
Everything that we analyzed, from market breadth, through the economic data, back to sentiment and even at the sector level of the indices suggested that this was nothing more than a necessary and healthy correction to-date. One of the interesting aspects of the 2-week consolidation afoot was narrowed down to the previous trading week’s performance of some cyclical sectors of the market/economy. Despite the fall-out in tech, consumer discretionary and other areas of the market, Materials and Industrials outperformed greatly. Take a look at some of our notes and charts from this weekend’s Report here:
We highlighted the positive trend developing with the Industrials sector in our latest State of the Market video as follows:
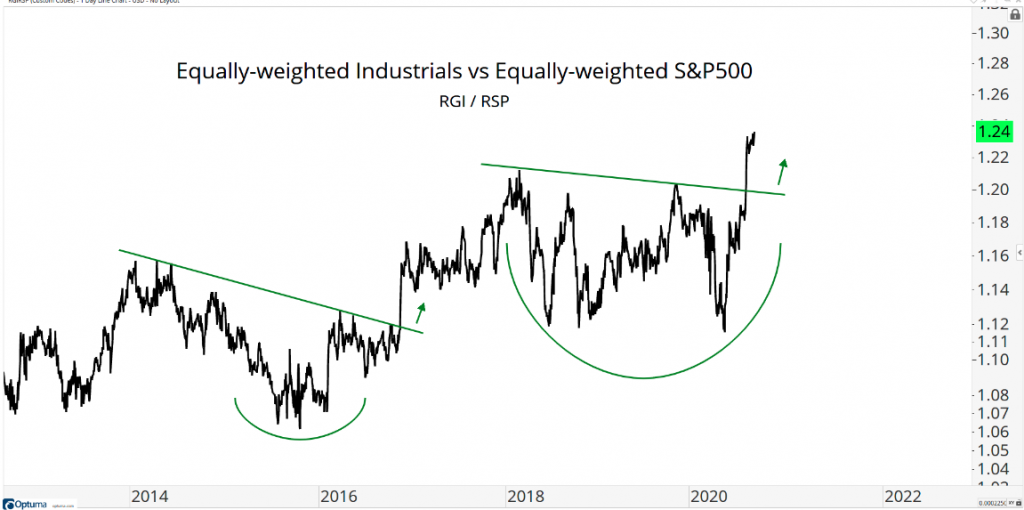
- What would you tell the gloom & doomer who is shorting stocks and thinks we’re due for a market crash?
- Show them the Equally-weighted Industrials vs Equally-weighted S&P500 breaking out” (RGI / RSP)
- With new highs in this ratio, it’s hard to argue breadth deterioration. To us, this is further evidence of breadth expansion!
“These two sectors (Materials and Industrials), if nothing else, speaks to healthy market consolidation that could give way to broadening market breadth once the market resumes its uptrend. The market will ultimately resume its uptrend, it’s just a matter of “when”. Within Industrials are the Dow Jones Transports (DJT), another chart that suggests the current market consolidation is just that and not something to be feared, but revered.
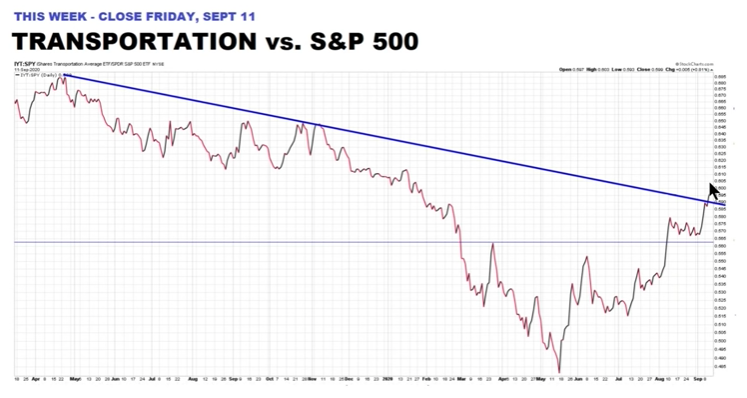
“The Transportation stocks relative performance to the S&P 500 just broke above a long-term trend-line. Does this look bearish to you? If we condense our time frame and look at just the absolute performance of the DJT, here is what we see:“
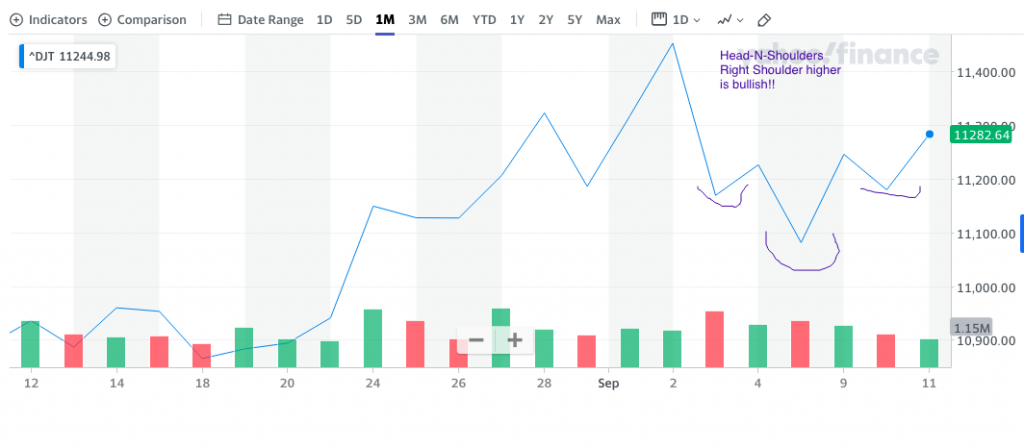
Transports, in past years, have been a key tell on the economic strength or weakness of the economy. The indicator from Transports has, however, given up its leadership strength to the Semiconductor/Chip sector in recent years. Firms have spent more money on technology than on logistics, freight and the like, which has found CAPEX identifying the Semiconductor sector as the new leadership of markets. One might say the Semis are the new Dow Theory signal. So while I’m encouraged by the recent performance of Transports, which has continued into the current week, Semis are always a key focus for market analysis. With that being said, for every good chart there is a bad chart or sector chart that lends itself to cautious optimism. I stress the optimism based on what I also mentioned earlier: Markets are almost perpetually in an uptrend! So let’s look at the following chart and analysis that lends itself to the aforementioned, advisable sentiment as disseminated by Steven Strazza of All Star Charts:
- Semiconductors had been one of the top performers off the March lows, but have been correcting and showing relative weakness since the beginning of the month.
- The recent performance from these groups is in direct opposition to their structural trends, as Semis have been in a strong uptrend for the past several years while Transports have been stuck in a sideways range, still trapped beneath their 2018 record highs.
- Here’s a short-term look at the charts, dating back to the beginning of the year.
- Semis just made their first lower low since the March bottom. We’ll be watching closely to see if they can reclaim their highs from earlier in the month.
- The bottom line is if both of these critically important groups continue to trend higher, it’s likely happening in an environment where stocks, in general, are still in an uptrend, and the S&P 500 is back above our key 339 level. Here’s a look.
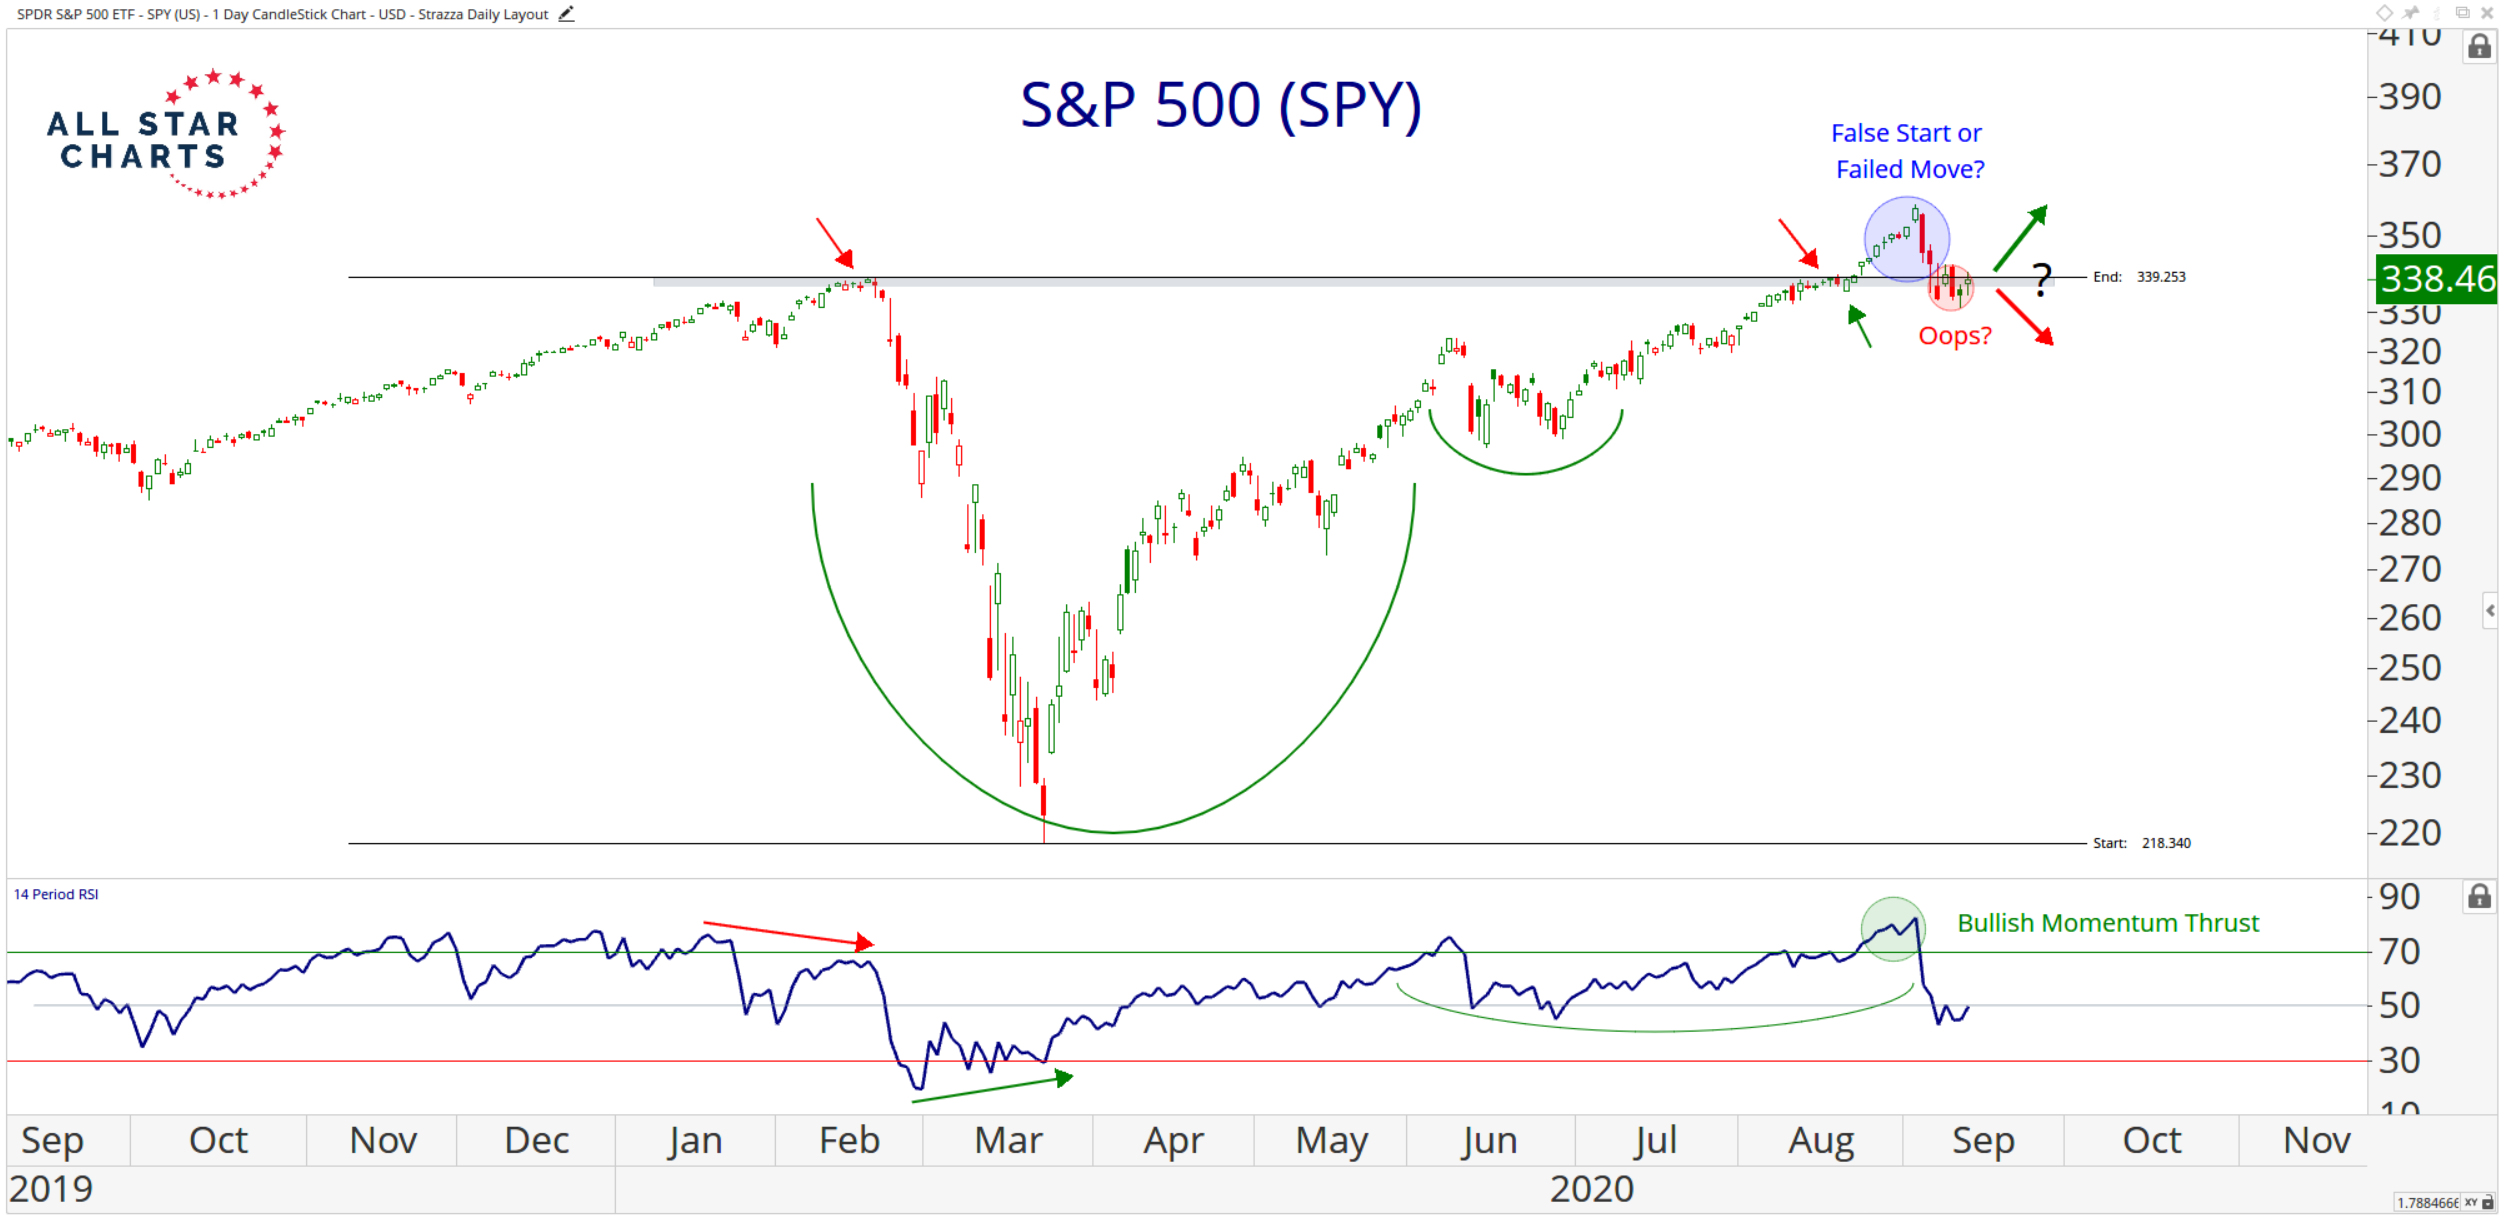
- Buyers and sellers are battling it out there now. We should see some resolution soon, and Transports and Semis are likely to act as a leading and confirming indicator for whichever direction we head from here.
I like the points and general technical analysis offered here by Strazza and the team at All Star Charts. With an emphasis on aggregated analysis and considering 3rd party analysis, the Finom Group proprietary, algorithmic Hit Rate Tracker has tracked a pretty good performance from All Star Charts:
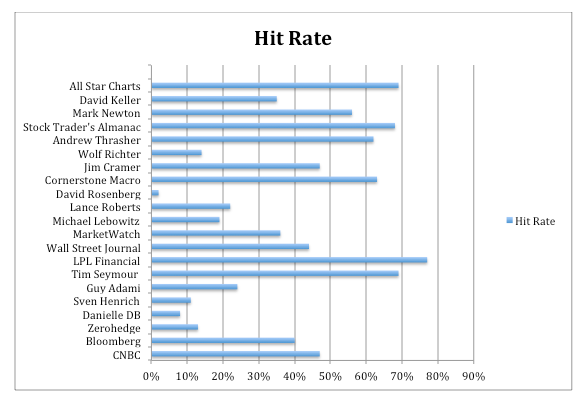
The top performers in our Hit Rate Tracker are LPL Financial, Stock Trader’s Almanac, Tim Seymour and All Star Charts. Speaking of the Stock Trader’s Almanac, this respite from the selling pressure that has found more reasonable valuations for investors lately…
This mid-month (September) buying activity since Monday is pretty much par-for-the-course. History suggests, that their is often a mid-September bounce (chart from Stock Trader’s Almanac)
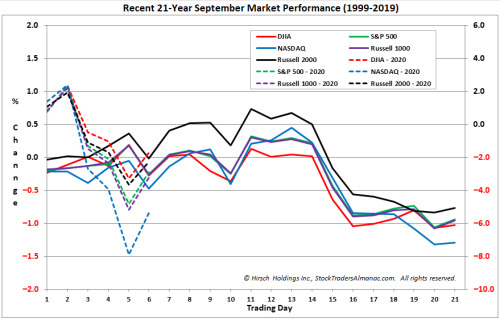
Unfortunately, history also suggests that this bounce gives way to more downside later in the month. While 2020 has been found for many an unprecedented circumstances and occurrences, as it pertains to investor behaviors, this tends to be more consistent regardless of the unprecedented times and circumstances.
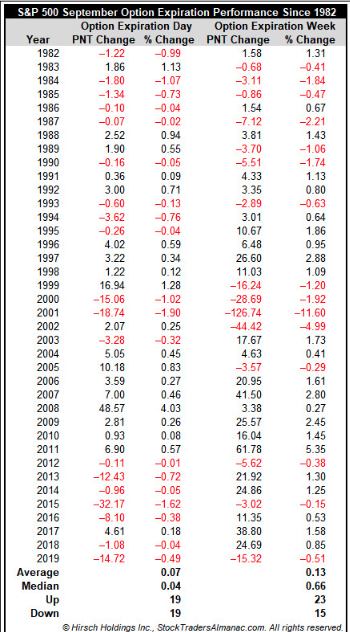
In keeping with our historic view of markets, here’s another tidbit of information from the Stock Trader’s Almanac. Keep in mind that the current week is a monthly options expiration week (OPEX).
- The S&P 500 is up 13 of the last 17 September option expiration weeks
- September’s option expiration week is up 60.5% of the time for S&P 500 since 1982.
- DJIA and NASDAQ have slightly weaker track records with gains 55.3% of the time and 57.9% of the time.
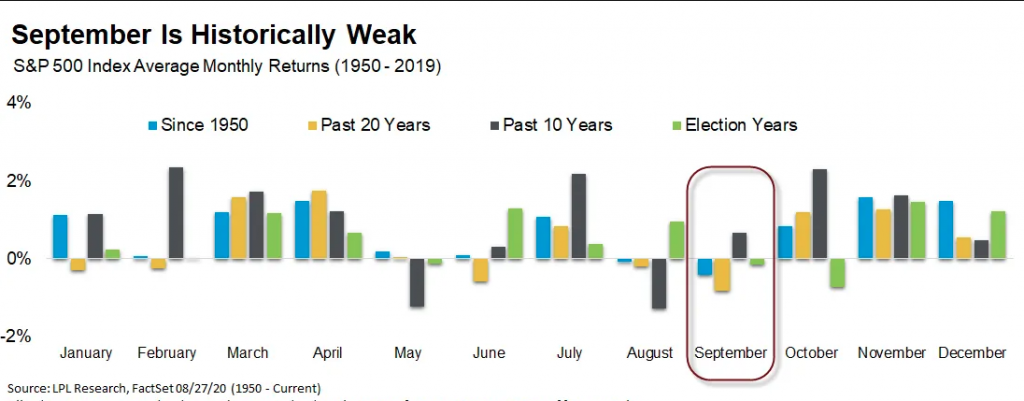
The historic data is never a guarantee. Having said that; it helps to identify the probabilities. While historically, we understand that September is not a good month for markets, it’s not a reason to be a seller of equities either. The negative returns, historically, simply aren’t that great, especially in election years. (LPL Financial Chart below)
Moreover, consider that the S&P 500 is up 5 months in a row. That’s a pretty profound message the market has been sending since April folks. As they say, momentum begets momentum or…
“An object in motion remains in motion along a straight line unless acted upon by an outside force.” ~Newton
The S&P 500 is up 5 months in a row and up 35.4% over that period. This performance has proven unprecedented, record setting, the best ever. The previous best ever performance was… drum roll please… 34.3% off of the 2009 lows. From that point in 2009, the S&P 500 added another 8.7% six months later.
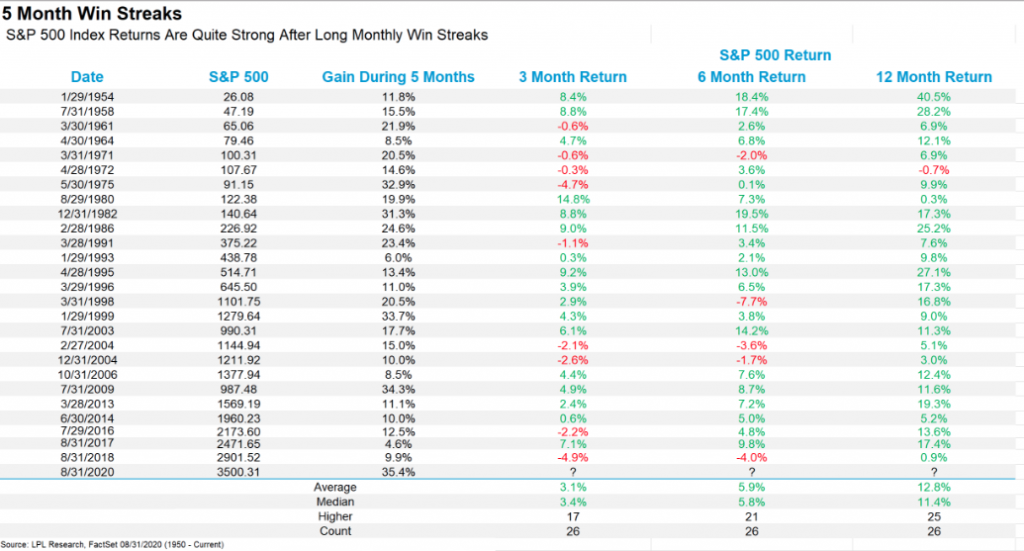
Not to sell our readers short on statistical data and to provide even greater depth of probabilities for markets going forward, the S&P 500 was up 7% last month. Crazy, right? Here’s what the benchmark index did the next month the past 15 times it was up at least 7 percent.
- 5.0%, 5.9%, (3.1%), 0.5%, 0.8%, 5.7%, 5.1%, 9.4%, 5.3%, 3.4%, 3.7%, (0.5%), 0.1%, 3.0%, 4.5%
- Avg 3.2%
- Let’s not forget this is an election year, heading into quarter-end rebalancing for the September quarter
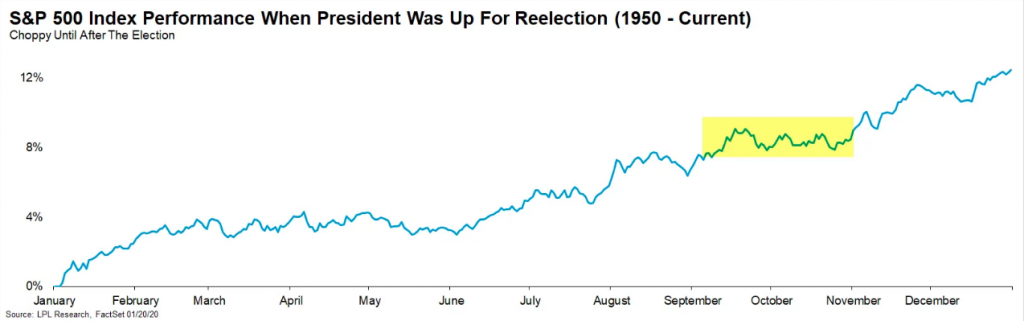
The chart above shows that even if the S&P 500 is down less than 1% on average for September during election years dating back to 1950, it rises into the 4th quarter. Looking at all the data and charts provided, one more question: Where is your sell signal? Are you really trying to time an “out and back in” folks?
Where stocks go from here, is likely higher, even if NOT in a straight line. Finom Group thinks the case for stocks to end the year higher from where we are now is a fairly strong one for several reasons:
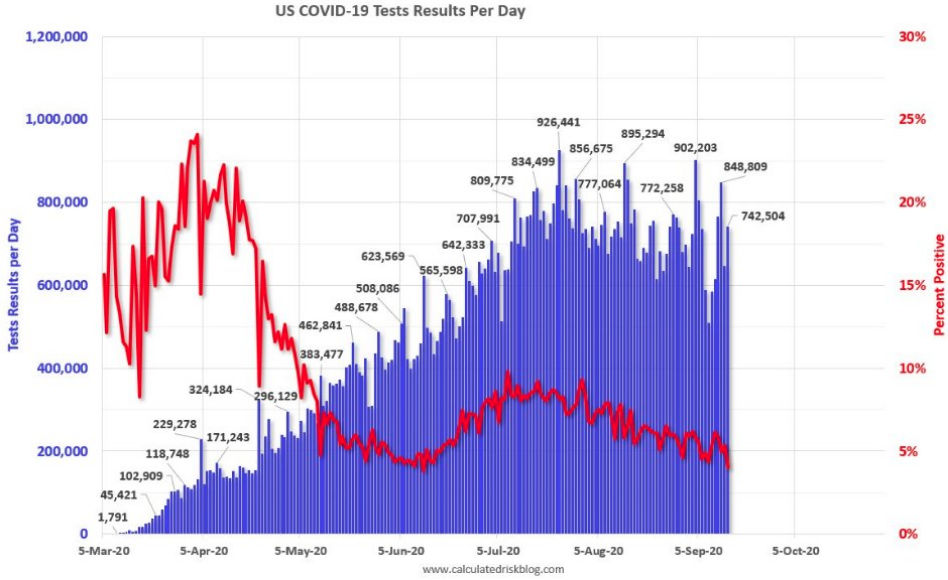
- We’re getting COVID-19 under control.
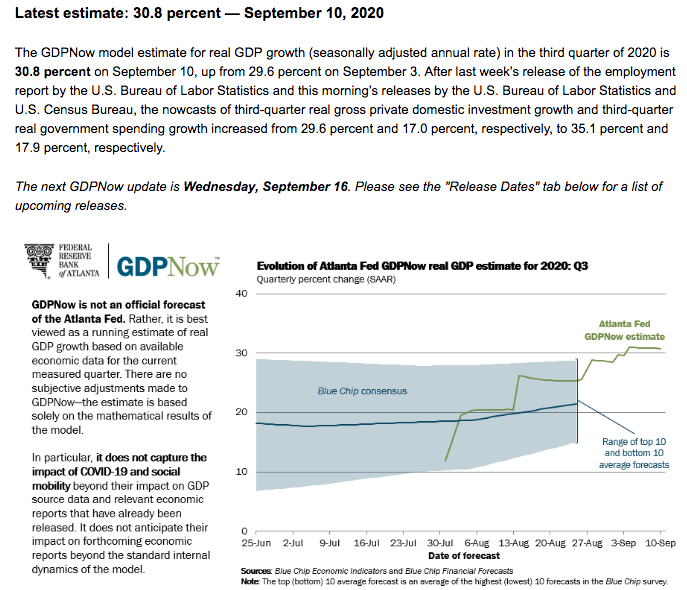
- Economic reopening continues. Economic data has consistently beaten expectations as the economy has reopened. Gross domestic product (GDP) growth in the third quarter possibly may reach a record 30% annualized. The Atlanta Federal Reserve’s GDPNow forecast is tracking to 30.8%, while Goldman Sachs expects 35% growth.
- Retail sales have already passed their pre-pandemic peak, and housing is booming (source: US Census Bureau). Higher stock prices help support spending via wealth effects, and even though the chances have fallen in recent weeks, more stimulus help from Congress may still come before the election. (Retail Sales due out Wednesday morning)
- BANK OF AMERICA CEO SAYS AUGUST SPENDING HAS CAUGHT UP TO 2019 LEVEL AFTER FALLING SHARPLY EARLIER THIS YEAR!
- Earnings estimates are rising. Earnings estimates rose during second quarter earnings season and have continued to climb higher. Though not always predictive, estimate increases have tended to come in bunches, so we think the odds are good that estimates may continue to rise and third quarter earnings from corporate America may surprise to the upside. The chart below is from Yardeni Research, outlining the current and updated consensus EPS forecasts, along with Dr. Ed Yardeni’s proprietary forecast for FY2020, FY2021 and FY2020 EPS.
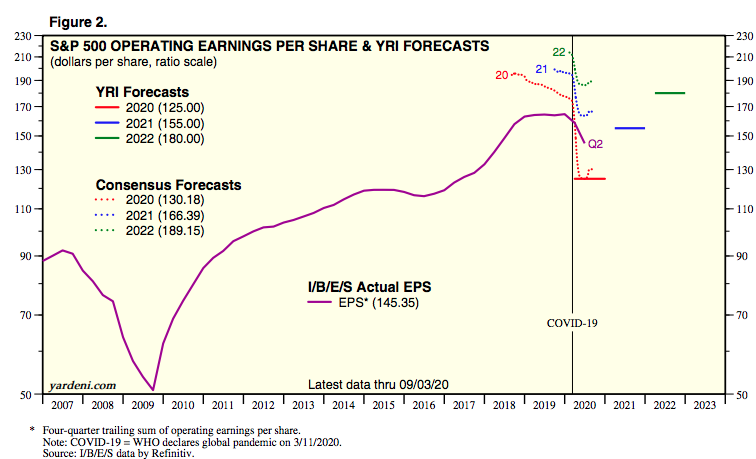
- The FY2020 EPS consensus estimate has improved from $129.88 in the previous weeks to $130.18 as of this past week. That is a rise of $.30 per share in Q3 EPS.
- What if Q3 EPS estimates prove too low, again?
- Will we see another $5 increase in the FY2020 EPS consensus estimates by the end of Q3’s reporting season as we saw by the end of the Q2 reporting season?
- The estimates for FY2021 continue to rise as well from $165.69 in the previous report to $166.39 in the most recent.
- At this pace of earnings revisions and with the S&P 500’s recent consolidation, the market’s forward multiple has contracted from 23 down to 21.7.
There’s a lot to digest here at the mid-point of the trading week, and as we await the market’s reactions to the Fed press conference later today. This has already proven a noisy week for investors who are camped on both sides of the river banks. We’ve heard from the bears, as they have the loudest voice and biggest platform. As such, let’s offer a more bullish market call from BlackRock’s Rick Rieder. He says what’s good is going to stay good.
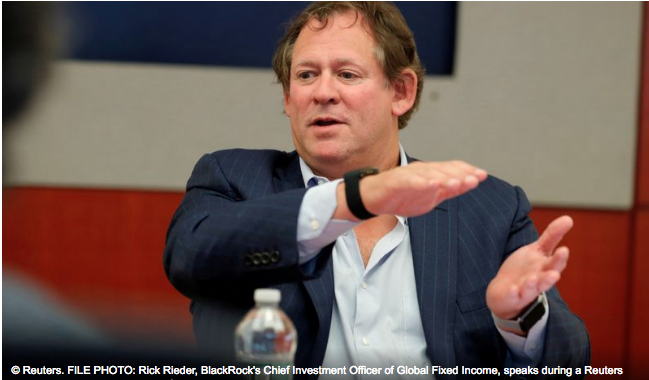
“I think the market is going to keep going higher,” Rieder, said in a Reuters interview. The Global Allocation Fund has been selling calls against existing long positions in large-cap, high-flying tech stocks to benefit from gains if they shake off recent weakness.
Investors’ concern that stock markets are overpriced is misplaced. While some stocks are grossly over-valued, the generic market is not, he said.
The Global Allocation Fund has a trailing one-year return of 16.99% and outperformed Morningstar’s U.S. Fund World Allocation category by 13.22%, according to Morningstar data.
“The most important thing for equities in this market is not the price-earnings ratio but the Federal Reserve’s bringing the discount rate to zero and its indication that rates will remain there for a long time. They’ve created explosive upside for where (the) multiple can go.
Investor Takeaway:
Investors would do themselves a great injustice by trying to time market pullbacks and expect to hedge appropriately with the intention of buying back-in at lesser valuations. The greatest advantage investors have is time in markets, not timing markets. More often than not, also, those supposed hedges turn out to be taxes on one’s portfolio than actual hedges. Regardless of what the market’s reaction to the FOMC meeting finds, Finom Group maintains that the market consolidation afoot is healthy, normal and likely to find long-term opportunity for investors who exercise strong disciplines! We’re dip buyers and that’s not just talk! Subscribe today and see for yourself with our daily/weekly trade/investment alerts!


