Welcome to this week’s State of the Markets with Wayne Nelson and Seth Golden. Please click the following link to review the SOTM video. In 2020, we are already confronted with a new geopolitical event as the U.S./Iran tension have risen to levels of minor military conflict and found with markets retreating a day after hitting record levels once again. Market conditions remain overbought nonetheless. Entering a presidential election year, we examine the probabilities for the S&P 500 performance. The economy remains front and center as economic data has largely performed well through the Q4 2019 period, outside of the manufacturing sector. J.P. Morgan is forecasting an earnings rebound in 2020, no recession and an economy that continues to be supported largely by the strength of the consumer.
My goal with the last week of the year is fourfold:
- Get organized!
- Review my progress toward long-term goals in the past year.
- Set goals for the upcoming year.
- Create a game plan!
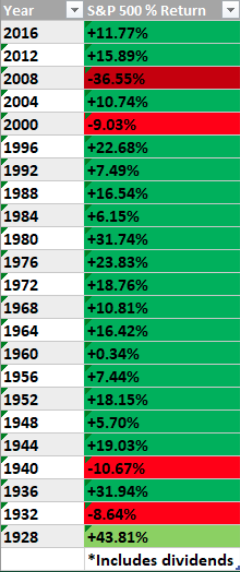
- Above are the Returns for the S&P 500 during Presidential Election years! (Going back to 1928) Higher 82.6% of the time. Avg. gain = +11.05%
- “By any objective measure US large cap stocks start 2020 on perilous footing. Valuations are rich. Corporate debt levels are at record highs,” said Nicholas Colas, co-founder of DataTrek Research, in a note. “But… we know the Federal Reserve has learned its lesson. It will be quick to ease if necessary and slow – very slow – to raise rates.”
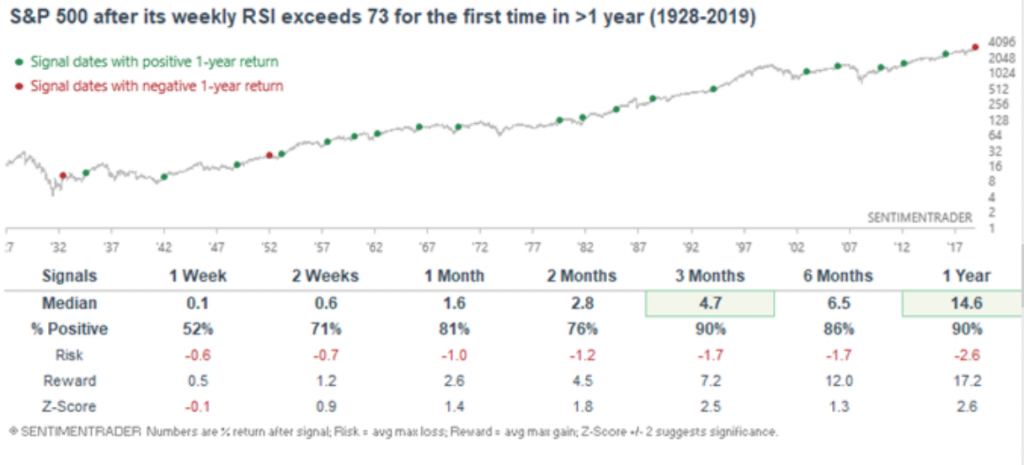
- Heading into the New Year, the best signs are due to persistent momentum.
- When there are broad signs of momo at work, it tends to be good for longer-term returns.
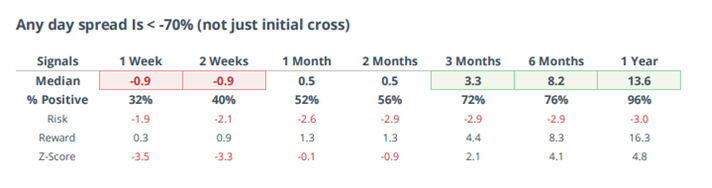
- Shorter-term, the historically extreme optimism has a strong record at preceding weak or outright negative returns up to 1-3 months later.
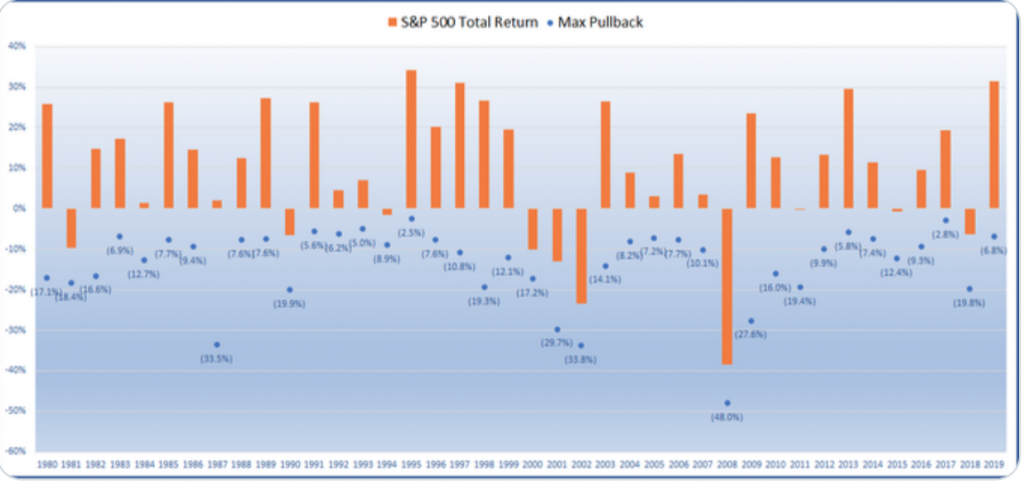
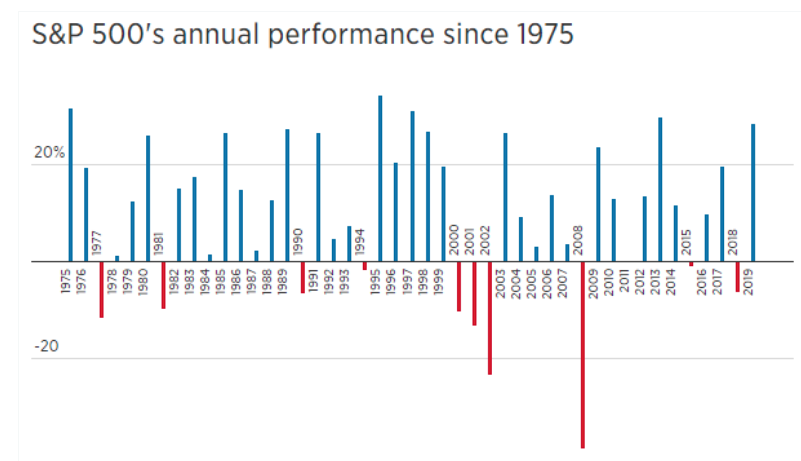
- The largest correction for the S&P 500 in 2019 was 6.8%.
- This is about half of the average year, which sees a max correction of about 14%.
- If all you followed was the headlines, you’d never believe last year was quite calm.
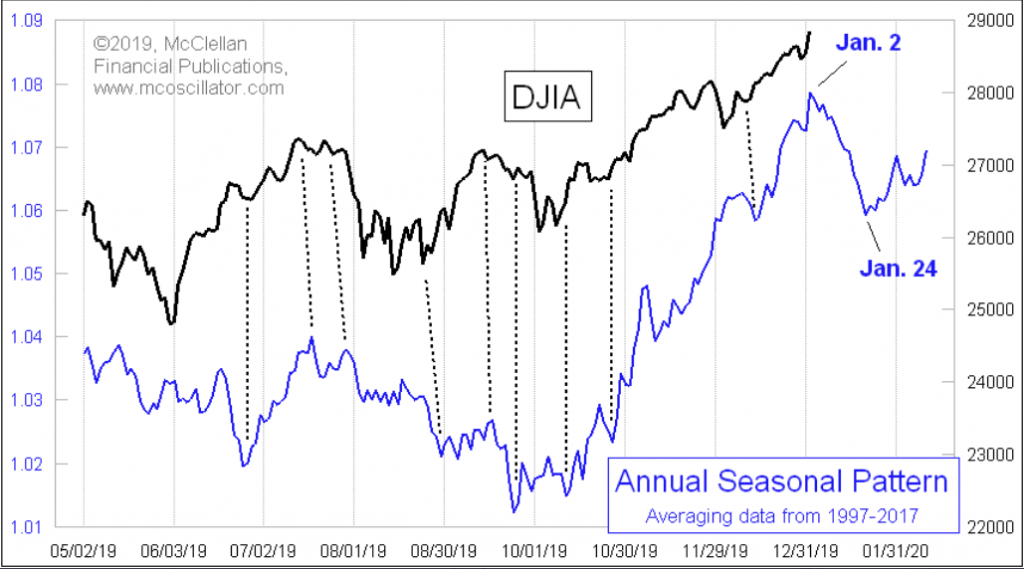
- Noticeable peak in the Annual Seasonal Pattern equating to Jan. 2.
- Now we get to see if the January decline appears this time, as has become quite prevalent in recent years.
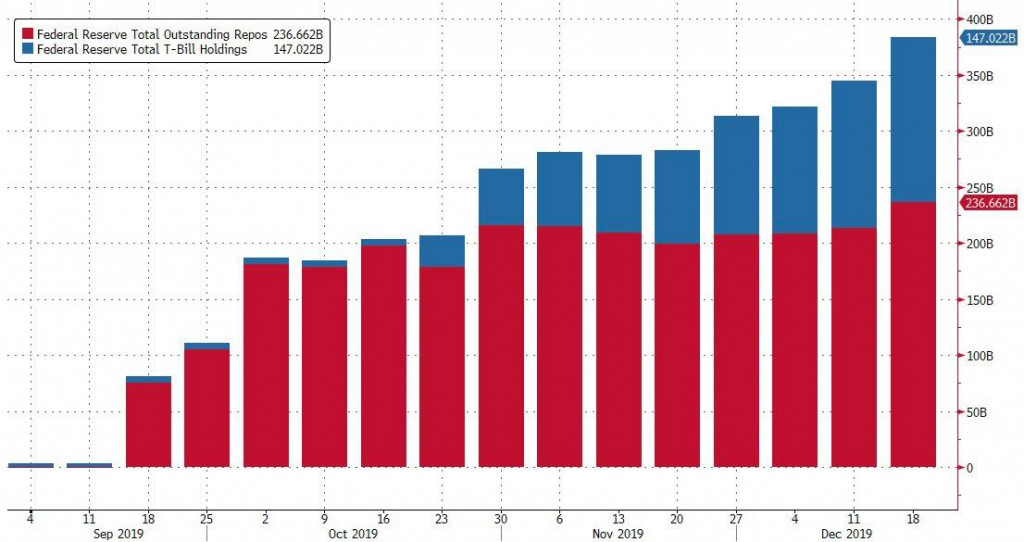
- Since mid-September, the Fed has actively injected $237 billion via “temporary” repos and $147 billion via not so temporary Bill purchases.
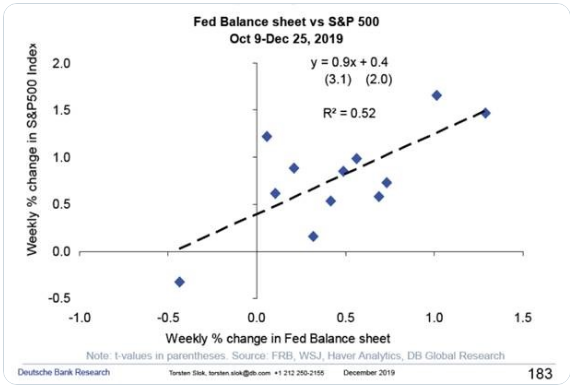
- There is a high correlation with FED BD and stocks going up: Since the Fed started buying T-bills in October, a 1% increase in the Fed balance sheet has been associated with a 0.9% increase in the S&P500.
- The Fed has vowed to backstop about $500 billion in liquidity between mid-December and mid-january, which means that one month from now, the Fed’s balance sheet will likely have breached its previous record and reach new all time highs.
- Morgan Stanley, in the year’s final report by the bank’s cross-asset expert Andrew Sheets, writes that he “expect the Fed to expand its balance sheet through April/May.” That also roughly coincides with BofA’s 3,333 target which will mark the market top for the current cycle.
- Michael Hartnett BofAML: “We are not so sure the Fed will no longer support it beyond that date; after all, the economy is now the market, and while a garden variety bear market would ensure a recession, a crash such as the one needed to wipe out the central bank excesses of the past decade, would result in the biggest global depression ever. Which is why the status quo will never allow it to happen, and such a “market event” would only be possible in a time of great social and political upheaval.”
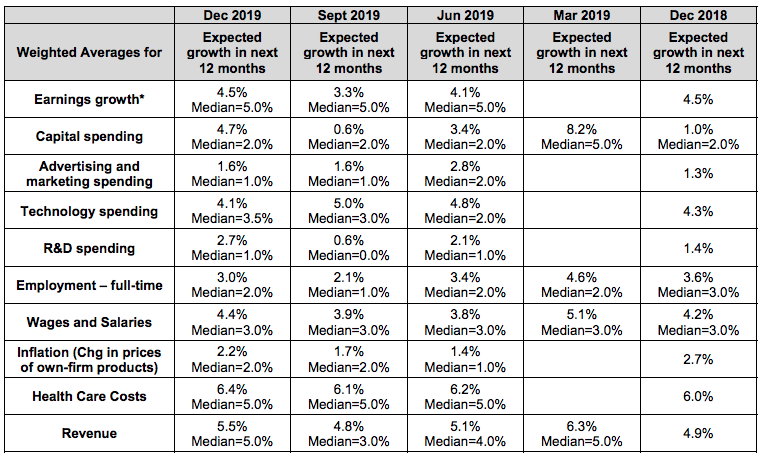
- The weighted average estimate for earnings growth in the next year rose from 3.3% in September to 4.5% in December.
- Capital spending growth expectations went from 0.6% to 4.7%. That’s good for business investment which fell in Q2 and Q3.
- Revenue growth is expected to be 5.5% which is up from 4.8%.
- Margins are expected to fall by less.
- Expected wages and salaries growth rose from 3.9% to 4.4%.
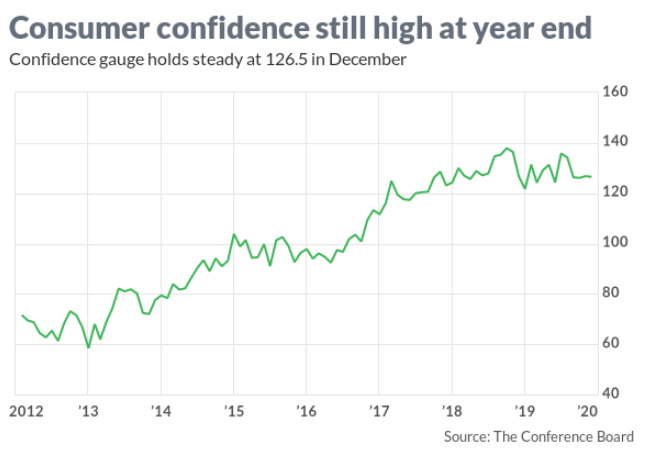
- The level of optimism on the U.S. economy increased from 62.6% to 66.6% as you can see from the chart below.
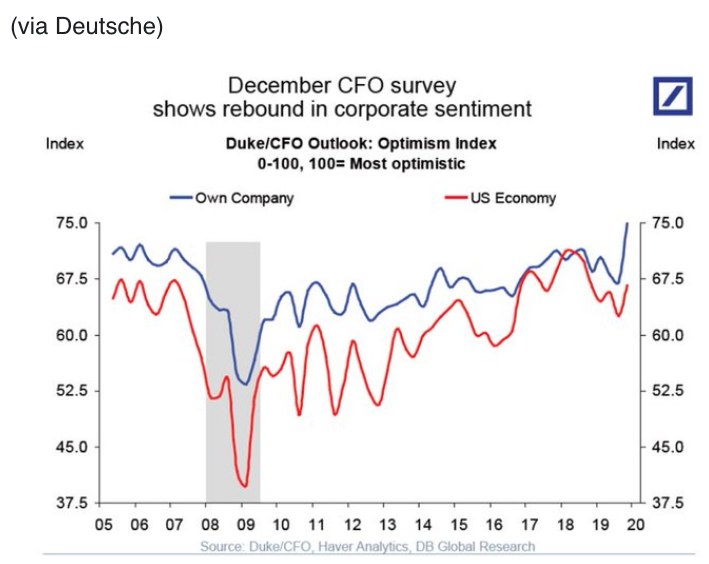
- The level of optimism CFOs have for their own company rose from 67.1% to 75% which is a cycle high.
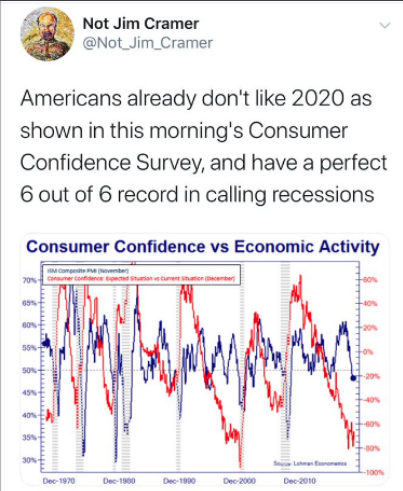
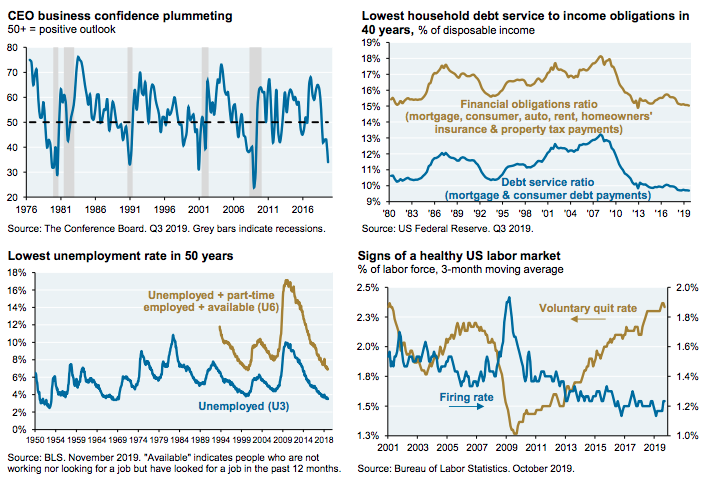
- 52% of US CFOs think America will be in a recession by Q4 2020 and 76% think there will be a recession by mid-2021.
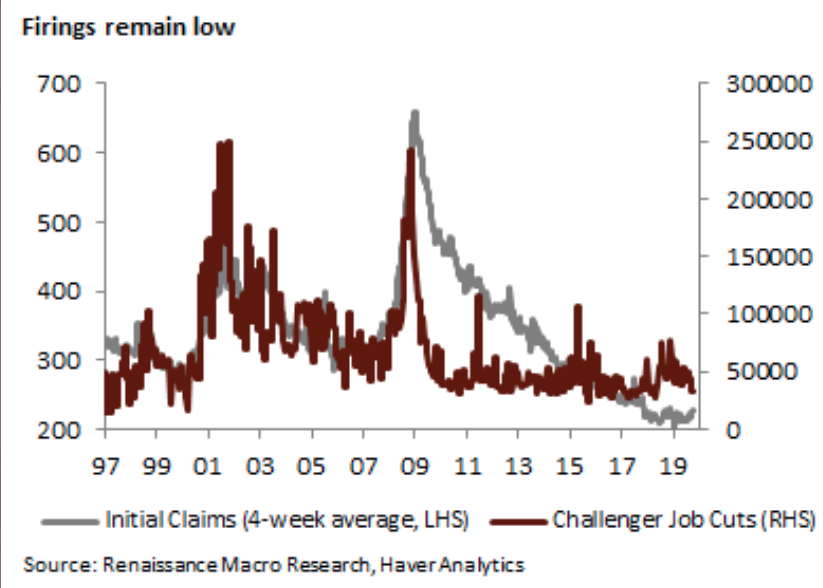
- Firings remain quite low.
- In December, announced layoffs declined 25.2% to 32,843, the lowest since July 2018, according to data from Challenger.
- Layoff announcements tend to lead initial claims by two to three months. At any rate, companies haven’t cut back on employment levels.
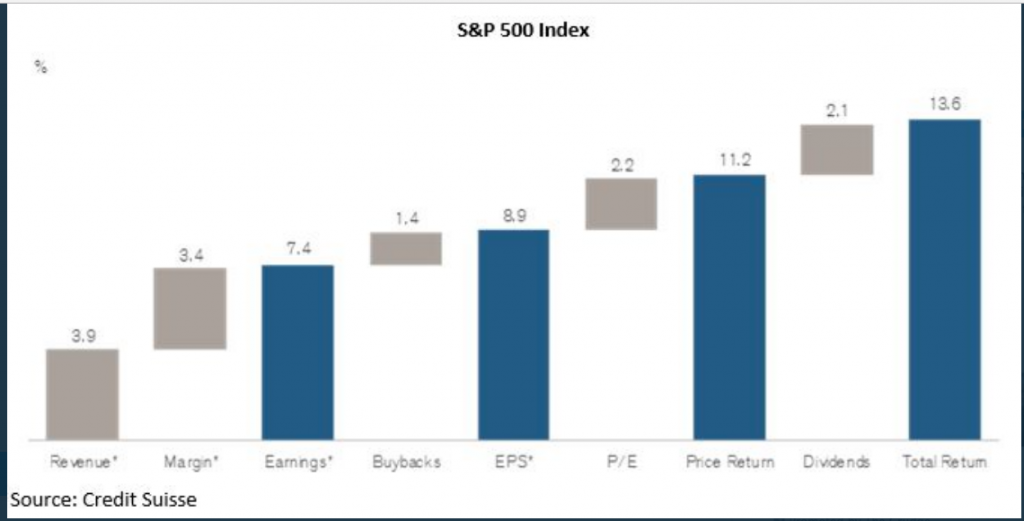
- For those who say that total returns have been driven by buybacks. Earnings Earnings Earnings!
- JP Morgan: We expect 5%-7% earnings growth in the US in 2020; this number would be higher, but is dragged down by the energy sector and by problems at Boeing.
- We expect roughly the same earnings growth in Europe, although we do not expect a substantial narrowing of the performance gap between the two regions.
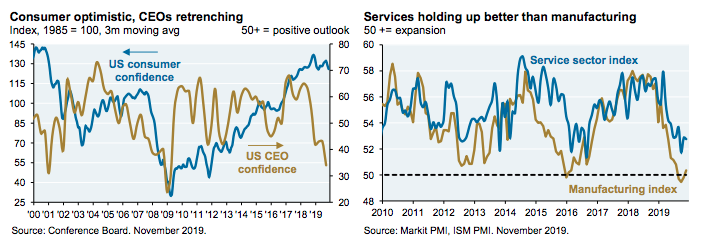
- Part of our optimism for 2020 is based on the continued strength of the US consumer.
- US consumption is close to its highest share of global GDP since 2008 and consumers are still optimistic, in contrast to US CEOs.
- Part of the reason: while manufacturing is treading water, service sectors that make up a larger share of the economy are doing better. As shown on pages 9-10, most measures of US wages, labor markets, household debt, consumer delinquencies and housing look pretty healthy.
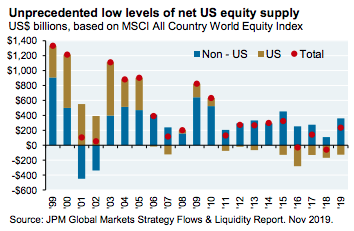
- The slow pace of net US equity supply should mitigate the duration and downside of the next selloff, whether it takes place with or without a US recession.
- As a reminder, after the 20% selloff that took place in December 2018, the S&P 500 staged its fastest bear-market recovery on record over the subsequent 100 days.
- For investors, one 2020 peril is a pickup in US wage or price inflation that indicates that the Fed has made a serious mistake in cutting real rates to zero (again).
- The Fed’s thinking on policy rates has undergone a massive shift since 2007, with current estimates of the natural real rate of interest at less than 1% (actual real policy rates are even below this level).
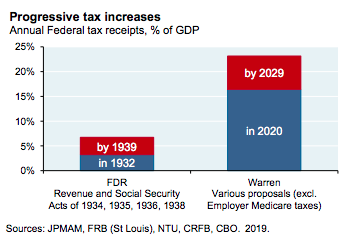
- The other peril: a progressive overhaul of the US economy after the election (bans on stock buybacks, increased corporate tax rates, sector-level collective bargaining, etc;
- The 2nd chart is one way to illustrate the breadth of the 2020 progressive agenda:
- Warren’s tax increase proposals are roughly 2.5 times the level of FDR’s tax increases that took place during the Great Depression, a time when US unemployment reached 22%.