

Research Report Excerpt #1

Most traders/investors from all walks of capital market experience had a poor year in 2022. When markets are heavily trending downward and taking most stocks down the same path, it’s incredibly difficult to outperform, market perform, and/or extrapolate the true value from such a trend. The educational value of a bear market is the greatest value for investors, as it sharpens the focus of an investor while building an encyclopedia-thick layer of ice water in one’s veins. The ability to move beyond the emotions typically associated with a market/portfolio drawdown is one of the greatest traits of a savvy/hardened investor.
Research Report Excerpt #2
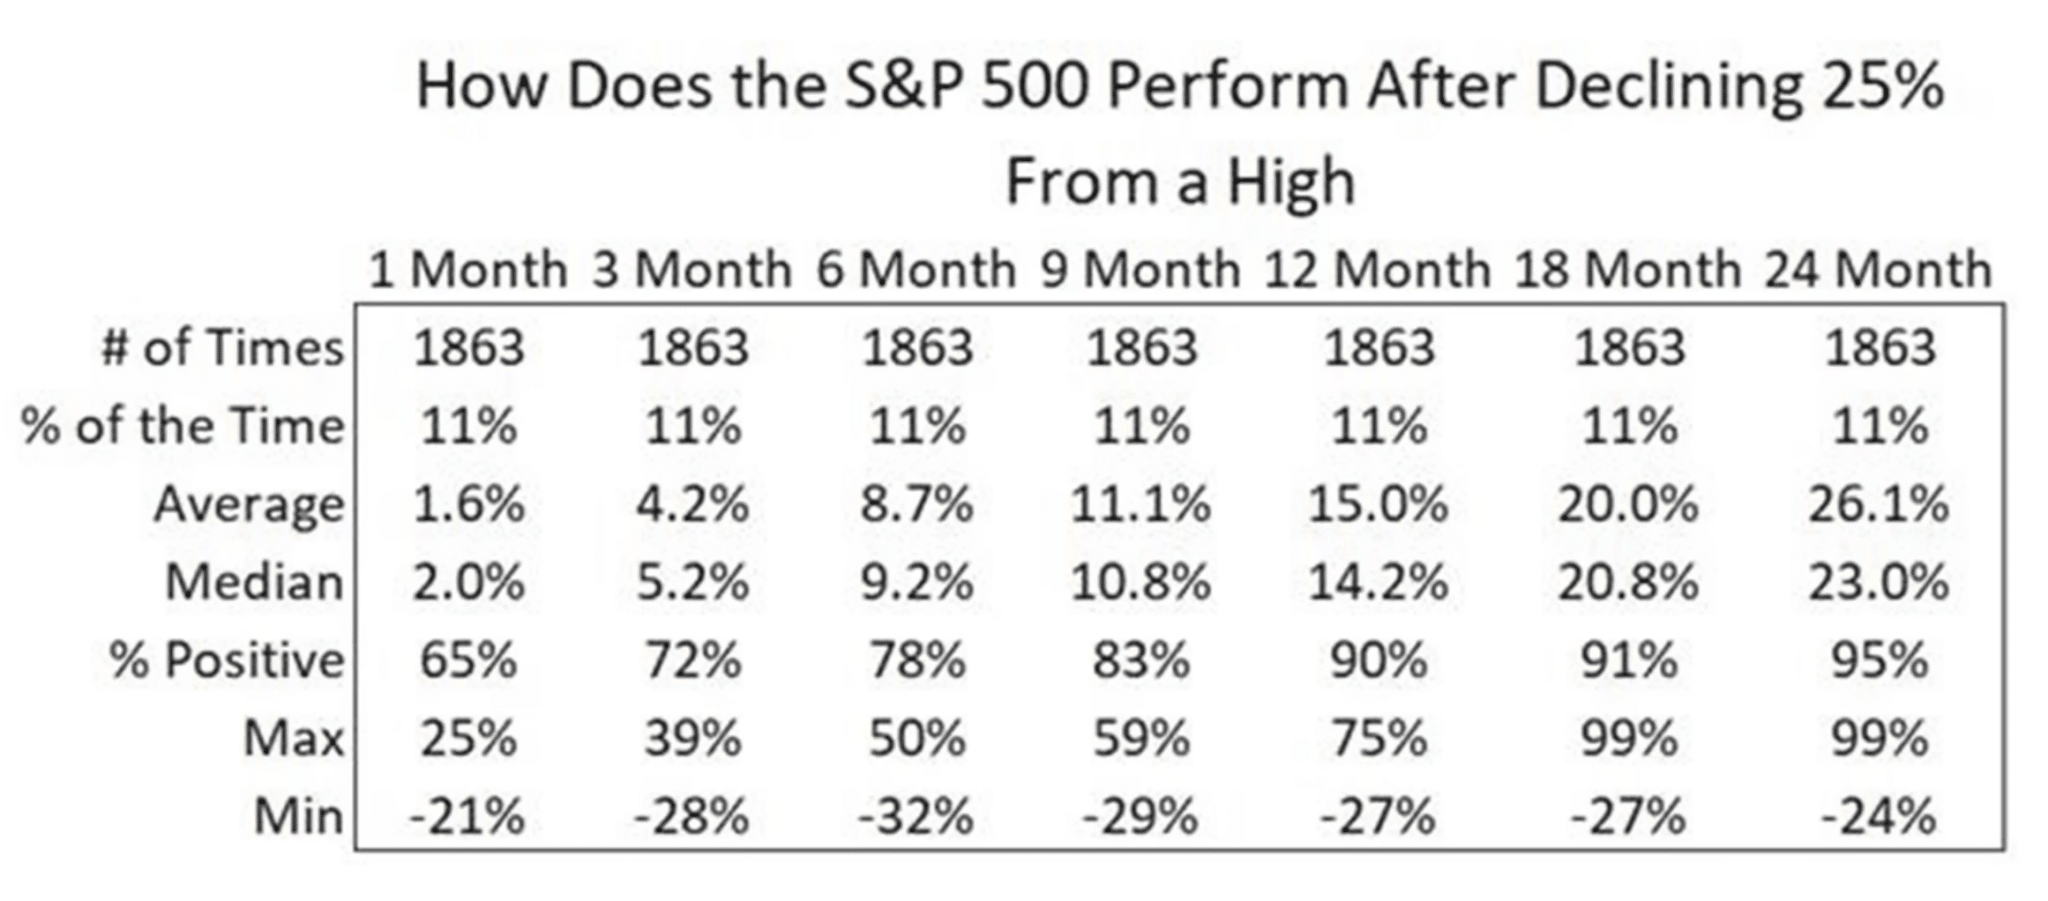
Nine months after the S&P 500 has fallen 25% from an all-time high, the market was higher 83% of the time, as shown in the table above. A year later the S&P 500 was higher 90% of the time. While many of the quantitative studies we focused on in 2022 didn’t bear the greatest probability, we understood this was a force-factor of the Fed’s rate-hike regime. A new year, with the majority of the Fed’s rate-hike regime in the rear-view mirror likely lends itself more favorably to quantitative performance in 2023 than in the previous year. Investors should at least be open to the probabilities.
Research Report Excerpt #3

The chart above illustrates the annual growth of real M2 money supply since 1960; prior to the pandemic, it rarely exceeded 10%, but it surged above 25% in February 2021. Nonetheless, that record gush quickly reversed; it was back below 10% by May 2021 and ended the year at just 5 percent. This year, it dropped below zero in April and is currently -5.6%, lower than 98.5% of the time since 1960.
In October 2018, real liquidity growth was near zero, and 16 months later, it was 25%. Fourteen months after that, it was back to zero and is now near record lows. Stock market performance has reflected that unprecedented liquidity volatility. The S&P 500 dropped almost 20% in late 2018, followed by over a two-fold gain by the end of 2021 (interrupted by a brief 34% pandemic-induced drop in March 2020) before again deteriorating about 25% this year. Remember, there is usually only 1 bear market but every 3.5 years and we’ve had 3 bear markets in the last 4 years. That’s the relevance of liquidity folks.
As also shown in the chart above, regardless of what the Fed is doing with the funds rate, real liquidity growth has been strongly correlated with stock market performance. The chart highlights 14 previous cases when annual real liquidity growth bottomed either near zero or below zero. Of those, there was only one instance (2008) in which the S&P 500 declined over the next 12 months. On the whole, buying the S&P 500 at past liquidity lows yielded an average of +14.2% in the ensuing year.
Research Report Excerpt #4
How has S&P500 performed once the Fed hits the “PAUSE” button? The Fed “pause” button has been a reliable buying signal for investors since 1954, as outlined in the chart (Fundstrat) and table (BofA) below:
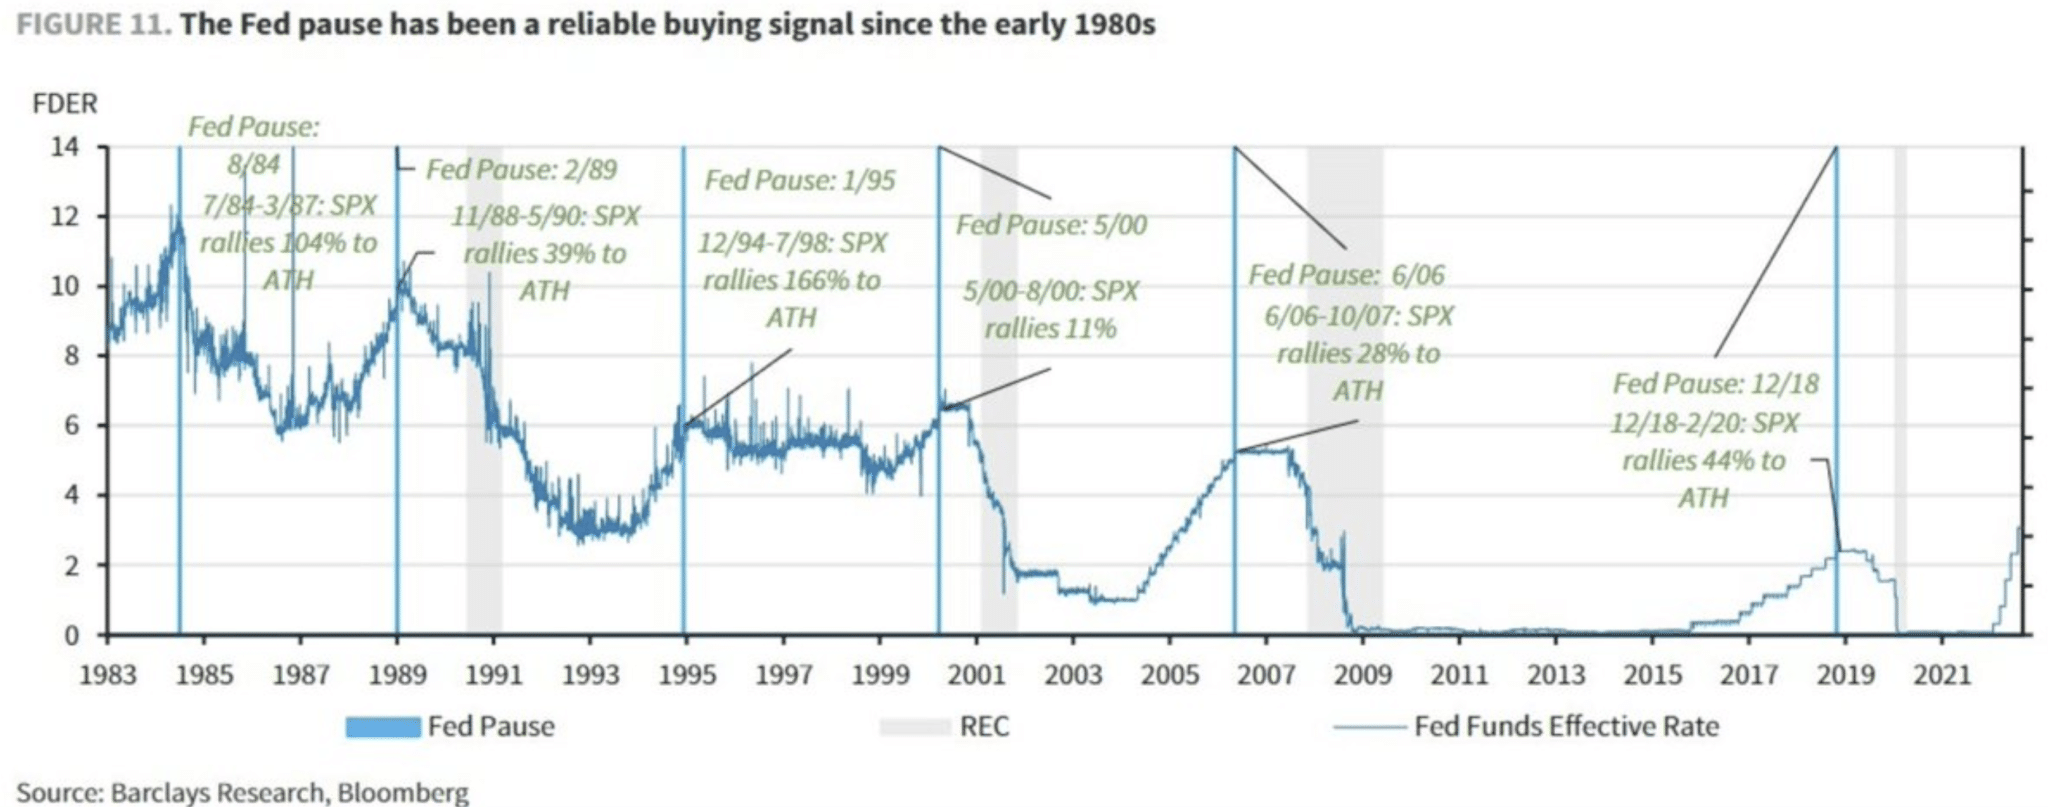
- 7/84 – 3/87 = 104%
- 11/88 – 5/90 = 39%
- 12/94 – 7/98 = 166%
- 5/00 – 8/00 = 11%
- 6/06 – 10/07 = 28%
- 12/18 – 2/20 = 44%
- Since 1954, the average 12-month S&P 500 return after a pause = 14%
- n = 13
- Careful; the worst performing sector once the Fed hits the PAUSE button is the ENERGY sector!

Research Report Excerpt #5

After strategists missed big last year (-22%), Wall Street’s “Top Strategists” are back again and have given their outlook for 2023. Do you agree? What’s your S&P 500 prediction this year?
Research Report Excerpt #6
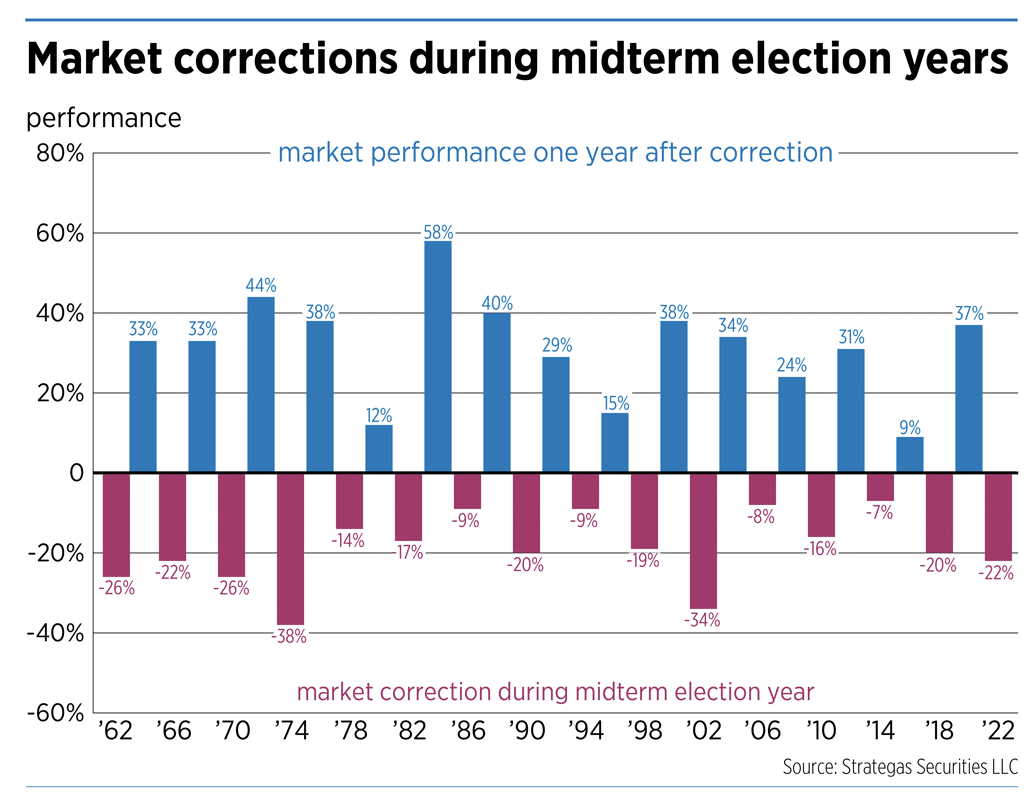
The average 12-month return from a Midterm year correction of -20% or greater has been +30% or greater, and higher every time a year later. If we calculate, using the absolute bear market low of 2022 at 3,491 (October 13, 2022) and a baseline 30% gain from that level (1,047 points) that would suggest the S&P 500 achieves 4,538 in 2023.
Research Report Excerpt #7
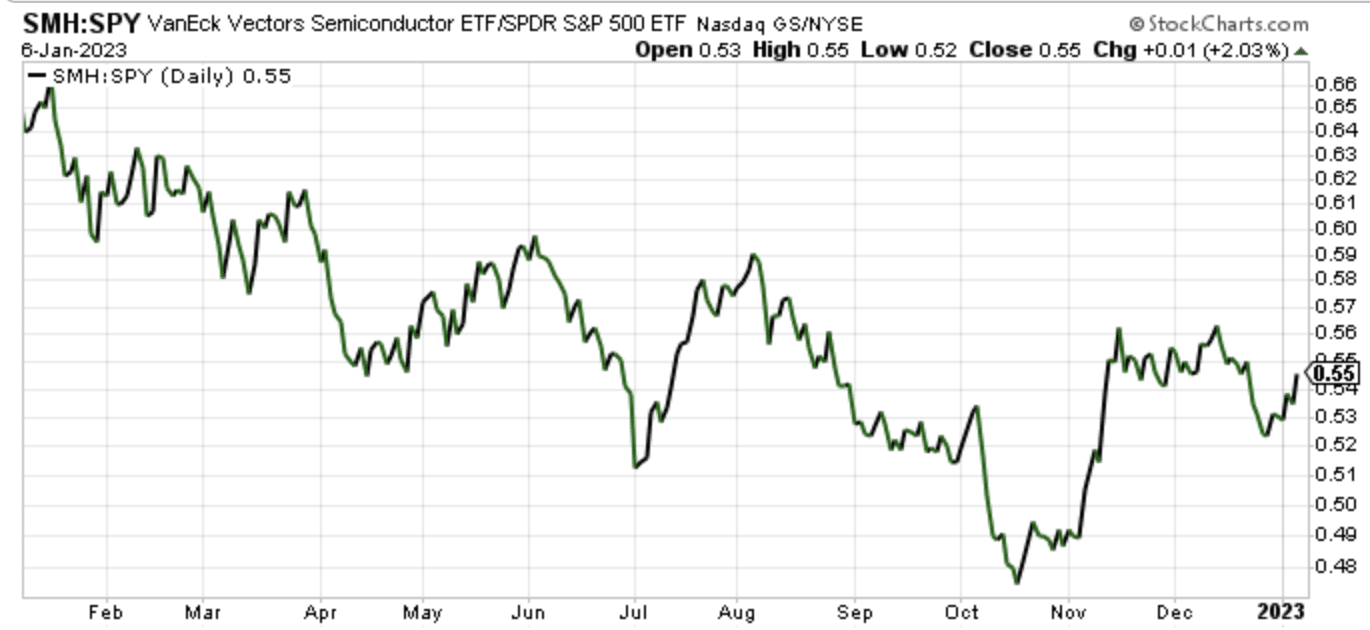
It’s almost comical how willing the pundits are to overlook this technical dynamic and dismiss the old market adage that “price is truth”. It is a year-long downtrend, don’t get me wrong. We are still seeing lower highs in the performance ratio. If the current uptrend truly began at the October 2022 lows, however, we’ll likely see a continued move higher in this performance ratio, above the August high. And if that happens, we are likely seeing positive overall market performance.
Research Report Excerpt #8
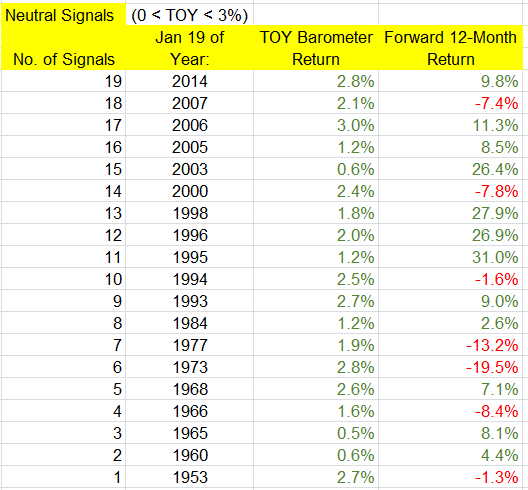
There have been 19 neutral signals for the TOY Barometer. The following year was positive 12 times (63%), compared to 77% win rate for “all years.” The overall average and median returns were 6.0% and 7.1 percent. But among the “up” years, the average and median gains were 14.4% and 9.4%, while the “down” years’ average and median losses were -8.5% and -7.8 percent. There were several big up years (1995, 1996, 1998, 2003), and two big down years (1973, 1977), so even if there is a neutral signal, there’s still a decent chance the following 12 months will venture far from its January 19 print.
Research Report Excerpt #9
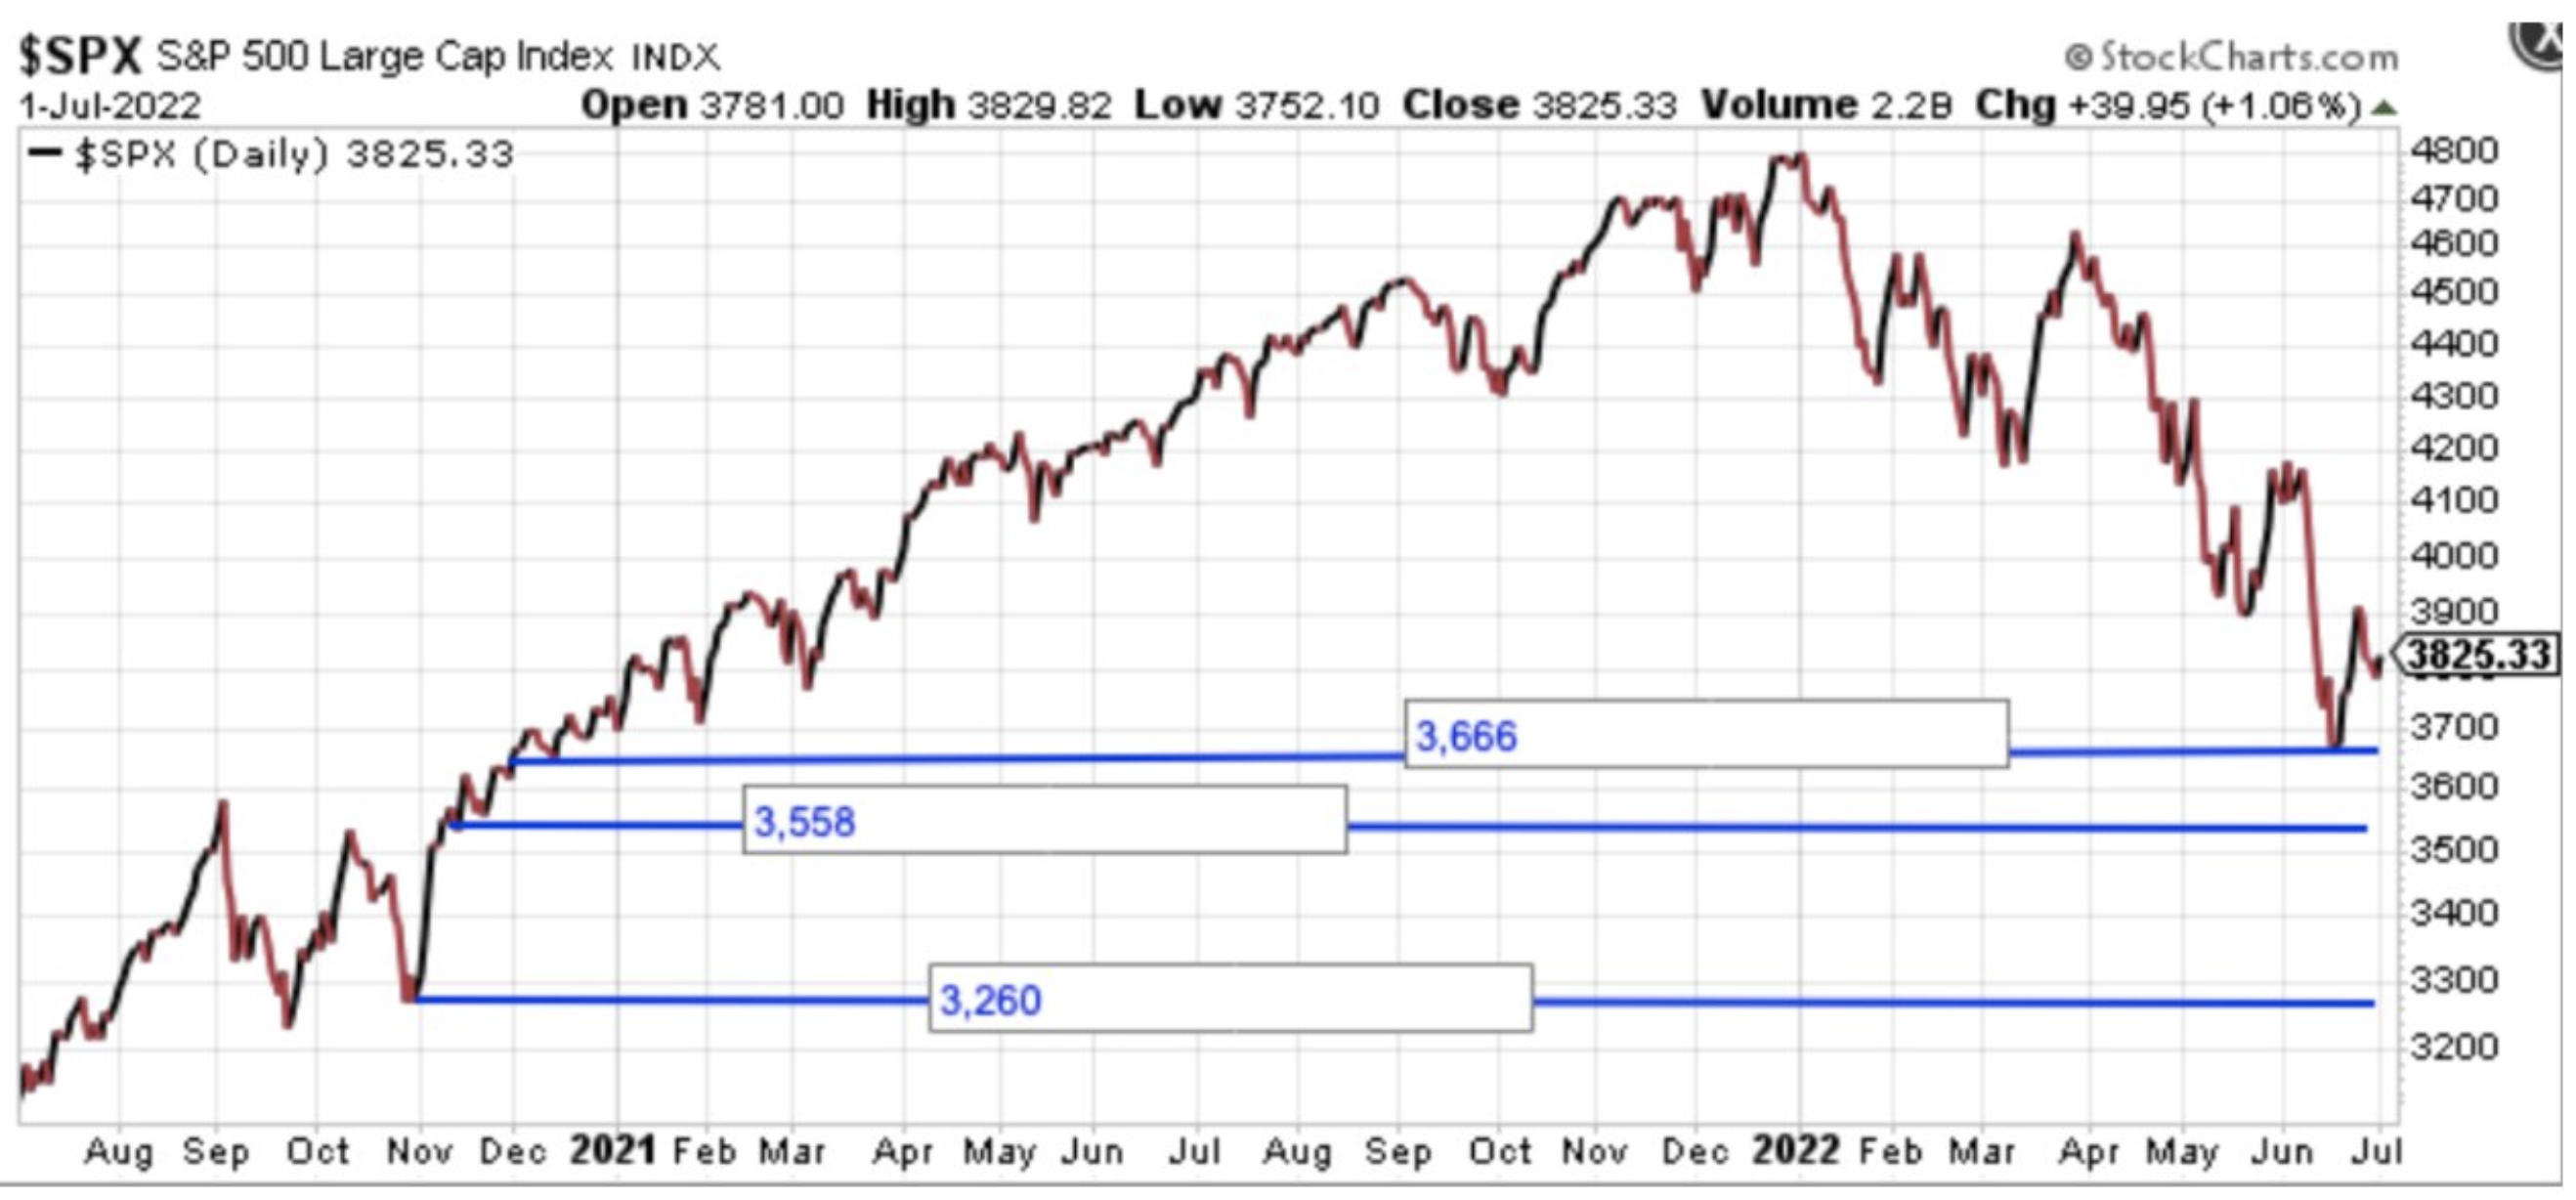
The Roadmap for significant acquisitions/capital allocations in 2023 remains as it was in 2022, unless we see greater technical improvements alongside continued bullish quantitative study achievements. If the latter is achieved prior to material technical improvements, one might consider adjusting the capital allocation Roadmap depicted above.


