
In reviewing the year-to-date major indices rally, I can’t help but to think that many, many investors have suffered from being captive of the moment and missing the big picture. Being captive to the moment refers to the pervasive negative sentiment that was born out of the Q4 2018 market sell-off. With the S&P 500 (SPX) falling some 20% from its peak to trough level, investors succumb to fear and the all-too formative loathing that has kept many investors on the sidelines and missing a great opportunity to either recapture former losses or gains from the 16% rally in the benchmark index.
The rises of social media platforms find many investors falling prey to dogma of fear driving pseudo economists and halfhearted investors. Some rather infamous purveyors of fear driven narratives include Sven Henrich and Jesse Felder. To be perfectly clear, Henrich and Felder’s narratives almost always portray the demise of equity markets and impending declines. They are almost always wrong and inherently leaning in favor of inevitability. We all know the market will decline, inevitably.

Felder’s latest narrative falsely lays claim to the notion that positioning within the VIX-ETP complex of derivative instruments might lead to the next volatility event. Within the narrative, the permabear Jesse Felder offers readers the following:
“We can also look to the volatility ETFs to try to get a picture of where this trade currently stands. Interestingly, since VXX went away at the end of January and was replaced by VXXB Barclays has not released details regarding the short interest in the fund. Still, we can look to TVIX, the second most popular VIX ETF by assets. Here, the message is the same as short interest recently surged to record highs far beyond what was seen prior to the XIV evisceration.
In all, it looks like traders have become extremely complacent in picking up pennies in front of steamroller once again. And rather than just purchase a straight up short vol ETF like XIV they are shorting a 2x vol ETF, enhancing both their leverage and their total risk. What’s more, their extreme positioning may be the only catalyst needed to call the steamroller back to finish the job.”
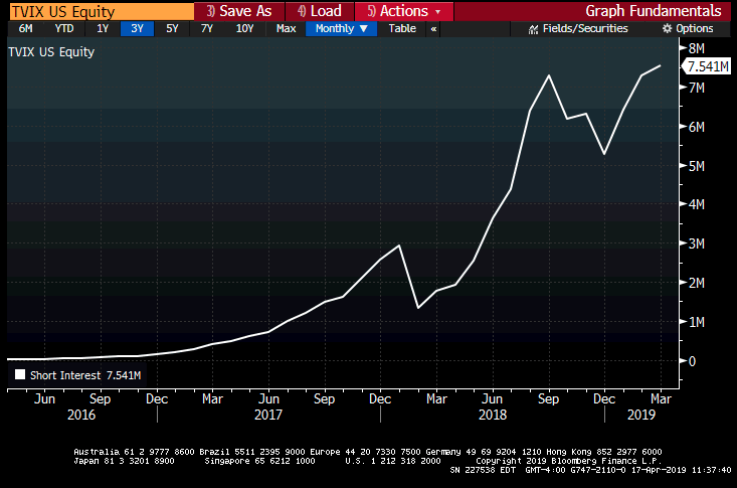
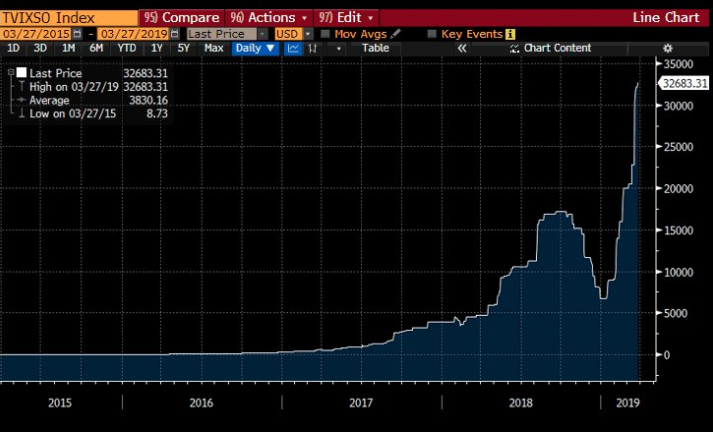
What Jesse fails to do within his fear laden diatribe is recognize that millions of shares in the ETN, TVIX, were created over the last few months and since the outsized long positioning commenced in February. Essentially, nobody believed in the market’s rally at the onset of the year, and many believed that volatility would return rather quickly. Outsized flows into TVIX forced the sponsors/APs of the ETN to create millions of shares, which increased the size of the float. (See chart below of shares outstanding/SO)
So with respect to the large short position, Jesse is most inaccurate. Many market participants have just positioned against the seemingly errand long positions. Moreover, as a percentage of the total float, the short interest is still under 30% with respect to the total float, which is historically very low for TVIX short positioning. But Jesse doesn’t give readers, investors or traders this insight. Simply put, it doesn’t make for a fearful story to represent the total scope of positioning in TVIX or the VIX complex if he had done so. The worst part of these diatribes is that they go unchecked by editors of various financial blog/media sites. Unsuspecting investors/traders lacking an understanding of the subject matter read the content as FACT, when many a time it is anything but fact.
Where Jesse Felder misrepresents data and draws upon inferences from charts, others misrepresent data and make false claims, using proprietary software to create charts that have no factual representations on the subject matter they discuss. The following is an example from Lance Roberts of Clarity Capital. Lance does a sound job of imbedding falsehoods within the scope of popular narratives so as to capture large audiences. But make no mistake about it; a falsehood is a falsehood.
In Lance’s most recent rationale for avoiding equity exposure, which he admittedly has been underweight throughout the year, dragging down his performance, the author tackles the subject of buybacks. Of course this has been a hot topic issue all year long and politicized in the media. Below is a claim put forth by Lance:
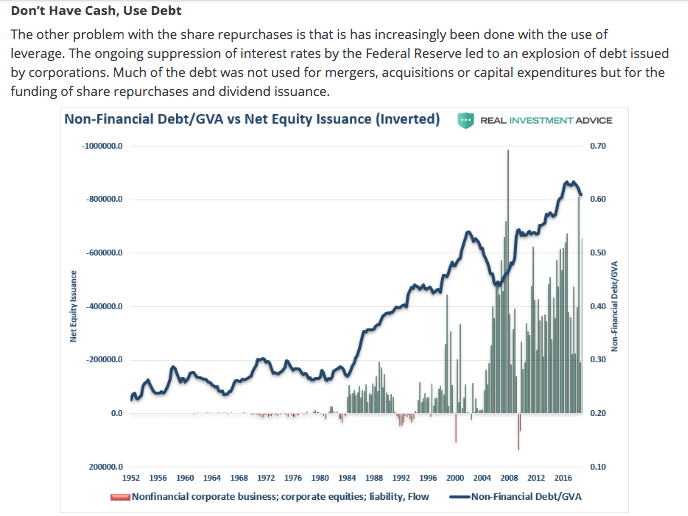
Is it true? Have buybacks been increasingly taking place with the raising of debt? No of course it isn’t true and of course Lance has to use an “inverted chart” of something loosely tied to what might be a debt to buyback ratio representation. It is anything but true and anything but a representation of debt to buybacks. But who has the acumen to clarify the falsehoods, and who has the desire to do so knowing that fear-littered narratives are actually the ones that achieve greater readership, clicks, likes and follows on social media? The answer, as more and more of these narratives pervade investor/trader daily e-mails from financial media and social media sites is simple, nobody. It’s a free world out there and in the social media world, my truth is the truth, but…reader be-aware!
So here’s the truth about Lance’s offering, debt funded buybacks have not shown any material increase when juxtaposed with cash funded buybacks. The following chart is from J.P. Morgan Chase, one of the most reputable financial institutions in the world.
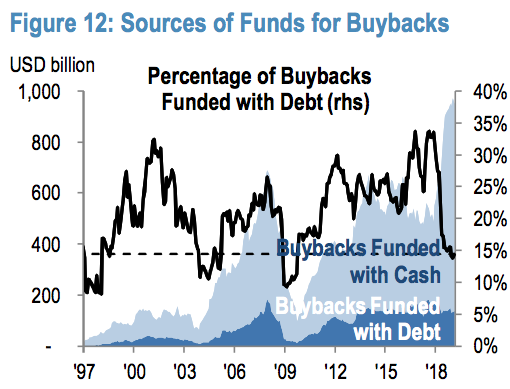
In fact, debt funded buybacks decreased in 2018, as repatriated cash from overseas flooded corporate balance sheets and as banking institutions were granted the ability to buyback their company shares since late 2017. Nonetheless, the fear mongering, misrepresentations and falsehoods will continue from the aforementioned market participants. Investors need better resources and that’s the truth!
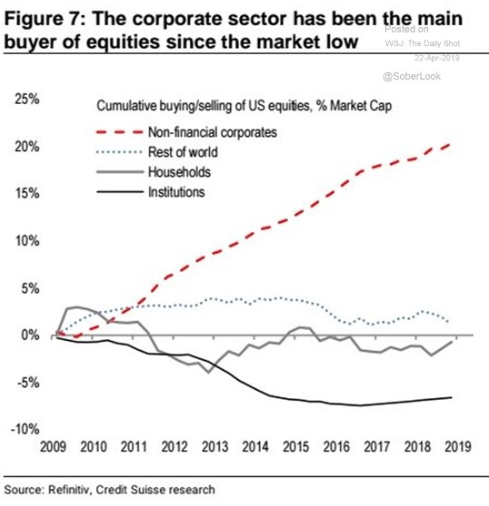
This is not to suggest that corporations aren’t a prevailing reason for the 2019 market rally, anything but in fact. I very much recognize the relevance and importance of corporate buybacks. Remember from my earlier statement that nobody believed in the market rally when it first took hold and as only light releveraging took place earlier in the year. As I aim to deliver the facts, corporate buybacks largely funded by cash, has been the main driver in the equity market rebound. (See chart below).
Investors will find these types of works increasingly published and distributed during bull markets and especially in an era of social media dominance. Many market participants have been calling for the end of the bull market since 2011 and with the onset of the European debt crisis centered on the Greek defaults and subsequent bailouts, bondholder haircuts et cetera. As the central banks stepped in to bayou various regional economies around the world, the hatred for the stock market elevated, driving an increase of equity market pundits and fearful narratives on what’s in store for the economy and equity markets. Some 8 years since the Greek bailouts, economies have strengthened to the dismay of these so-called permabears. And although the equity markets have risen mightily since the Great Financial Crisis, it could be legitimately argued that the equity markets have actually weakened structurally and through the rise of passive investing and quant/algorithmic trading.
The big picture, with regards to the equity market performance over the last 10 years or even just the last 3 months has left behind a great many citizens and further divided the U.S. social and economic class structures. The haves have more and the have nots may not have less, but they are no closer to achieving financial stability than they were 10 years ago. While the Sven Henrichs, Danielle DiMartinos and David Rosenbergs of the world will continue to warn investors/traders of the inherent pitfalls to current monetary policies and market structures, they do little if anything to lift up individuals today, for the fear of what may come. When “it comes”, they have no idea as the last 10 years has proven. As such, the opportunity for achieving a healthier financial position through equity market exposure over the past 10 years has been lost by those who were frightened out of the equity market by these individuals. It’s not hard to be held captive to fear, it’s natural and why many of these permabears have thousands upon thousands of followers.
The most unfortunate aspect of the investor landscape going forward is that the issue highlighted in this narrative, fear laden diatribe public distribution and consumption, is only going to increase. To that extent I hope to be able to continue to deliver factual market representations void of bias, emotion and focused on the big picture. The big picture is identified and proven over time, the market follows earnings and the economy provides greater earnings over time. You’ve likely heard the following saying many a time: “You can’t see the forest for the trees”.
This is telling someone that they are so focused on the details of a situation, that they are not seeing the bigger picture. An alternative (but related meaning), you are complaining that the various small immediate problems, which must be dealt with make it impossible to focus or do anything about the larger.
I have always determined this to be the permabear issue, not being able to see the forest for the trees. Permabears are the most capable of seeing the wrong/poor/failing/weakening of most any designated aspect of the economy and/or market. They are the most capable by designated and exercised premise of their existence that centers on their bias. It’s permanent and rooted in fear, which as I mentioned before is highly captivating and long since found intrinsically captivating themselves, beyond their own understanding for which the forest becomes… lost!
The permabears held firm to the driving forces they believed were in place and producing a technical bear market in late 2018. But those driving forces were merely trees within an abundant forest. A China and U.S. trade feud, a global economy that proved slowing and earnings feared to express a pending recession. Many fearful and tall trees, but…China is rebounding and the U.S. is not in its worst shape mostly feared, but little realized.
Investors need to understand that China is a managed economy and that officials aren’t likely to stand by and let the world’s second-largest economy flounder and falter for too long before taking action. Stimulus has poured into the Chinese economy and found working already, akin to the vast amounts of stimulus poured into economies of scale in former years. Thus the Chinese equity markets have rebounded, as they should.
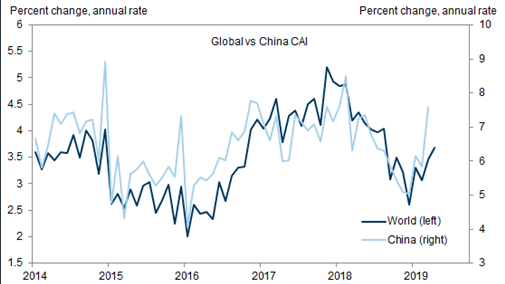
“From Golden Sachs: The global outlook continues to brighten, with our global CAI now up to a preliminary 3.6% in April. Most of the acceleration is due to China where strong activity data lifted the CAI to 7.6% in March (up from 5% as recently as December).”
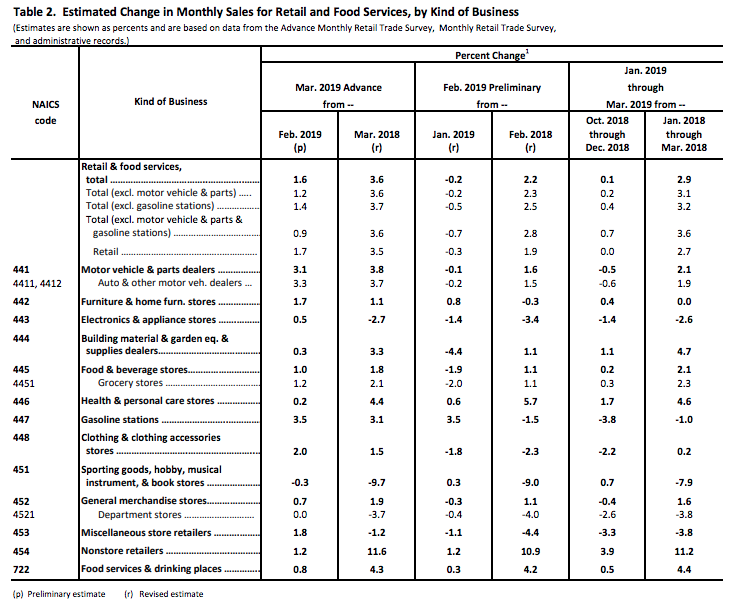
Moreover, it appears the demise of the U.S. economy has been overstated and heralded with greater error. While the Atlanta Fed’s GDPNow model had been projecting a paltry gain of just 0.3% for US GDP a couple of months back, the projection now stands at a 2.8 percent. The trade deficit has narrowed, inflation has been tempered dynamically, the energy sector has returned to a more balanced state of supply/demand, the consumer is still spending and they are achieving higher wages to buy “stuff”. And since more than 70% of the U.S. economy is driven by consumption, well, you get the idea. And if you don’t get the idea here is a snapshot of the latest monthly retail sales.
Is every tree in the forest healthy, certainly not! But there are many trees in a growing forest that is the U.S. economy. Housing is struggling as we saw in the latest existing home sales data, which took another dip.
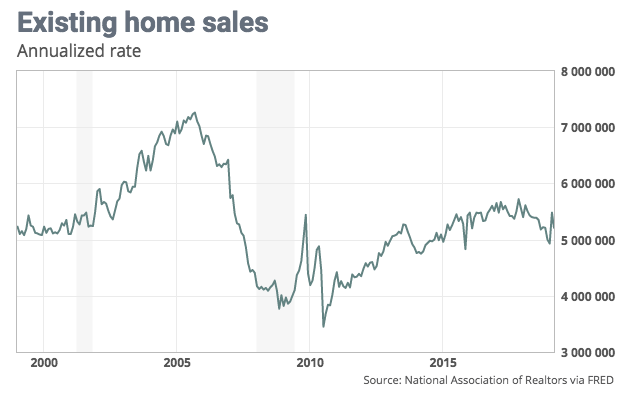
But the reality is that existing home sales are still healthy, growing at a pace on par with the era that led preceded the mortgage and housing bust of 2008. Existing-home sales ran at a seasonally adjusted annual 5.21 million rate in March, the National Association of Realtors said Monday. That was the pace of sales from 2000-2002 and before mortgages could be achieved absent income verification. Is that what we want to go back to, the era of deregulation and robo-lending without qualifying homebuyers? The reality is the pace of home sales has slowed, but the pace of sales is still healthy. It’s the rate of change from former highs that scares people. They’ve been used to a persistent 10-year uptrend and a final sugar high spurt that found rates rising and now have been subsequently reset from said sugar high levels. Nonetheless, the forest around the housing sector remains healthy and I’m expecting housing to rebound in H2 2019.
“Really Seth, you expect housing to rebound, even with housing starts falling”? Oh yea, oh yea I certainly do. Don’t get me wrong, I can certainly be proven wrong, but my thesis is rooted with historic trends and data. Please see the chart below:
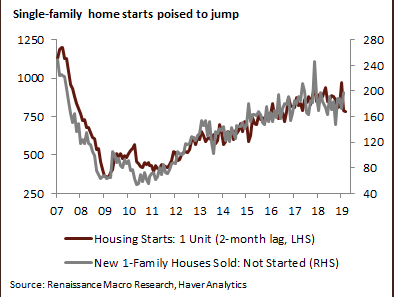
While single-family housing starts hit their lowest level since September 2016, there is some room for improvement in the months ahead. New homes sold, but not yet started hit their best level in a year; this series tends to lead by a couple of months. As such, we should see housing starts pick up going forward and this is before we hit upon the easier comps produced from a downtrend in housing starts in 2018.
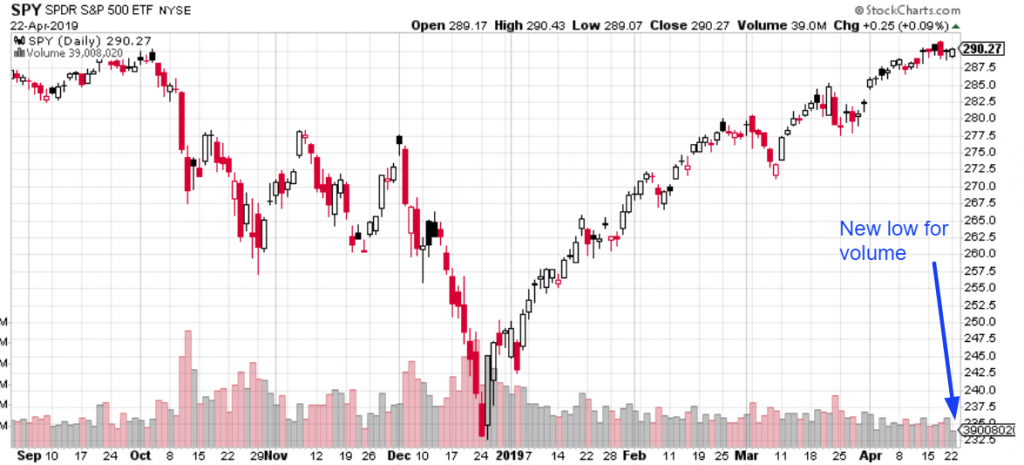
Reverting to my general market commentary, it seems as though we’re not making much ground outside of the Nasdaq 100 that recently hit an all-time high. Last week we discussed market volume which proved increasingly light and that hasn’t changed much.
But this should be expected and when we align our trees it’s known why. Remember, this week will encompass the greatest number of corporate earnings reports. Thus, many companies will be withholding their share repurchases until after earnings results are delivered. This, as I discussed earlier, is taking the largest purchaser of shares out of the market, when assessed for the current equity market exposure year-to-date.
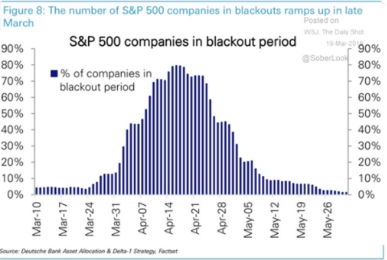
And this is what we explained in former Research Reports, suggesting the Deutsche Bank chart, positioned below, of corporate buybacks was in error and if representing factual reporting cycles would need to see the peak of the blackout period be moved back a week or two.
So which way does the market go on light volume and as it seems to have been stuck since last week? Tom Lee from FundStrat aims to answer this question with some technical analysis. (See chart below)
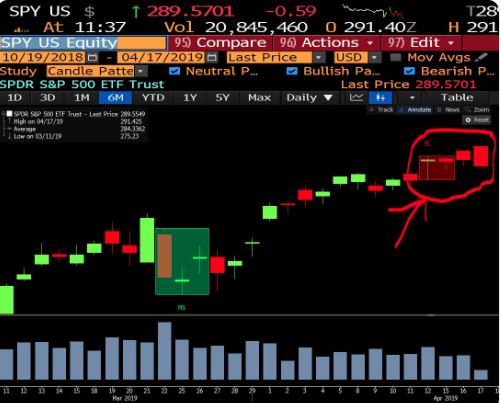
“Last week, analysis by our data science team shows S&P 500 has only a 9% probability of a gain in the week following a “3 black crows” formation (since 1928). Base case remains positive on equities in 2019.”
Obviously, based on the candlestick formation that highlights the SPY opening higher than where it closed each day last week doesn’t bode well for the ETF this week according to historic probabilities. But, nobody anticipated or expected a V-shaped market recovery either, which had an extremely low probable occurrence also. Nonetheless, and as we continue to look at the market’s volume decline we can also look at historical market probabilities using volume as a parameter.
Here’s what happens next to the S&P when volume is this low, according to Troy Bombardia:
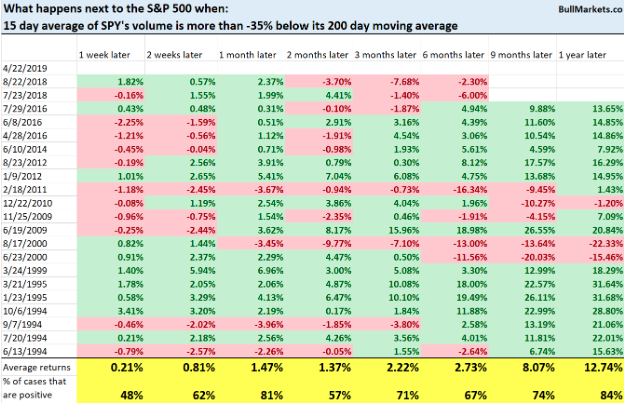
When volume is this light, it’s not consistently bullish or bear until we go out roughly 3 months, for which it becomes increasingly bullish. Sorry bears!
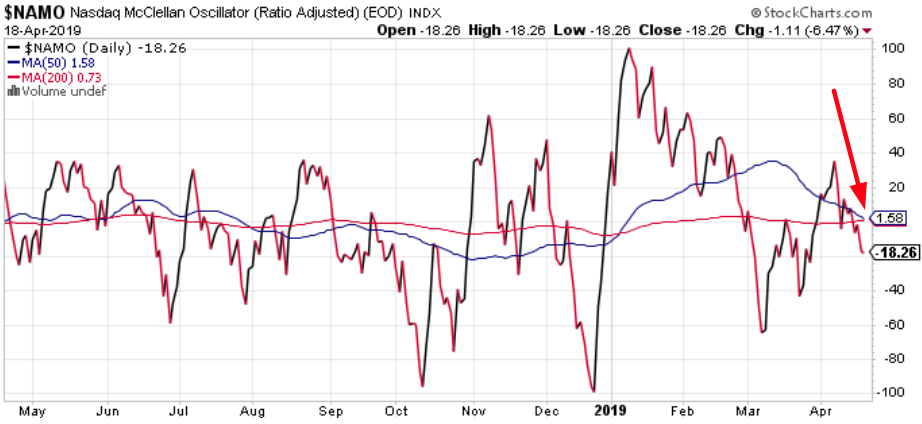
Additionally, as volume is declining, breadth is also weakening. Here’ the NASDAQ’s McClellan Oscillator (a breadth indicator). As you can see, the McClellan Oscillator’s 50-DMA is close to crossing below its 200-DMA for the first time since January 2019.
So we’ve looked at volume and breadth, a wide swath of economic data and general macro-sentiment for equities. And with this, what really matters most will always be corporate earnings, which is our proverbial forest after all. And those earnings continue to come in better than anticipated and serve to underscore my belief that the earnings recession forecasted for the Q1 2019 period, won’t be as severe as previously thought and forecasted to be from the pseudo analyst community of permabears. This morning alone…
Coca-Cola Co. (KO) reported first-quarter earnings and revenue that beat expectations. Net income totaled $1.68 billion, or 39 cents per share, up from 1.37 billion, or 32 cents per share, last year. Adjusted EPS of 48 cents beat the 46-cent FactSet consensus. Revenue was $8.02 billion, up from $7.63 billion last year and ahead of the $7.89 billion FactSet expectation. Coca-Cola will host its annual meeting on April 24, at which James Quincey will become chairman, succeeding Muhtar Kent, who started in 1978 and is retiring. The company maintained its full-year organic revenue guidance for 4% growth, and full-year adjusted EPS range from down 1% to up 1%.
Twitter (TWTR) reported first-quarter net income of $191 million, or 25 cents a share, up from $61 million, or 8 cents, a year earlier. Excluding a tax benefit, the company’s net income was $66 million, or 9 cents a share. Adjusted earnings per share rose to 37 cents from 16 cents a year earlier and came in above the FactSet consensus, which called for 15 cents in adjusted EPS. The stock is up more than 8% in premarket trading.


