
Remember the daily record advances in the S&P 500 back in January of this year. Remember the VIX rising alongside such advances as the RSI hit record levels during this time period. Investors enjoy or appreciate when the S&P 500 breaks out and to the upside with strength and breadth, as it did back then and is doing presently. But that appreciation doesn’t come without some level of fear and consideration that daily record high advances don’t come without an inevitable mean reversion. In other words, all good things must come to an end, even if only for the moment. Again, we saw this back in January, record highs daily and record highs that inevitably led to a 12% correction for the S&P 500 through much of February and into March. The consequence: a VIX that rocketed from 10% to over 50% in very short order and with a 100%+ gain for the VIX in a single day.
The S&P 500 finished at a record for the third session in a row Tuesday while the VIX also rose to 12.50 and for a second consecutive day. The VIX tends to trade inversely to the S&P 500 some 87% of the time. The VIX is a measure of the market’s expectation for volatility over the next 30 days and is calculated from the implied volatility of S&P 500 options. A low reading indicates a calm market while a higher reading/number suggests elevated uncertainty/fear. All indicating terms are relative of course, unless you are directly trading VIX derivatives and don’t care for “relatives”.
When anomalistic trading of the VIX complex comes to bear, it forces upon VIX traders to discover the reason for the trading activity. There are a number of indicators to review how premiums in the complex are being traded with regards to assigning risk. The majority of the time, the vast majority of the time, VIX futures are traded net short. VIX futures determine the shape of Term Structure or the VIX futures curve, as it is known. In order to better understand the volatility risk premium and Term Structure we can look at how Non-commercial VIX traders are positioned. We outlined to Finom Group subscribers last weekend, in our weekly research report, the following:
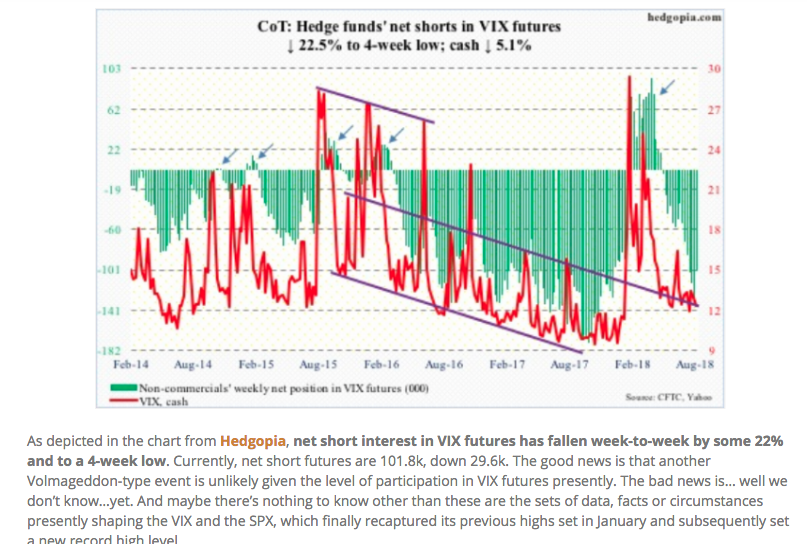
Based on the screenshot alone, we understand the Non-commercial net short position in VIX futures had declined rather significantly, although still net short VIX futures. Not necessarily what you want to see if you are short volatility because this feeds into VIX futures Term Structure by elevating the curve. It could be nothing, it could be something and/or it could be transitory risk premium elevation that subsides quickly. Truth be told, risk premium tends to decay quickly although quickly in and of itself is subjective.
Another aspect we look at with regards to VIX trader positioning is leveraged money. Russell Rhoads, formerly of the CBOE, recently offered a review of leverage money positioning with the following:
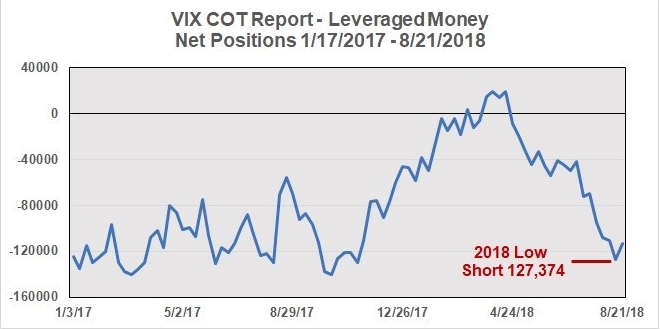
“As of Aug. 21, leveraged money was long 63,837 VIX futures and short 177,450, for a net position of short 113,613. You can see on the chart below this is near the 2018 low of 127,374 and just a tad higher than the previous week’s reading.”
Taken together, Non-commercial net VIX futures positions and leveraged money, here is what we see consequentially expressed in term structure.
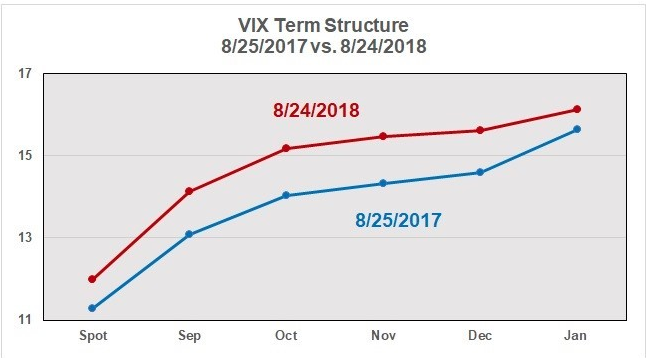
As one can clearly see from the graphic, on a YOY basis risk premium has become elevated. From Spot VIX/cash-VIX out several months VIX futures contracts, risk premium is elevated beyond 2017. Where September 2017 premium for VIX futures was 13, it is 14 here in 2018. The premium widens the further out on the curve we go.
Given what we see in the futures curve, which is still with rich contango for short sellers, it’s clear that traders are preparing for heightened levels of volatility in the coming months. Does this define the future of volatility? The answer is clearly no, but it defines what has been moving the VIX and VIX complex of derivatives at present, as well as VIX Futures Term Structure.
Trend divergence is always concerning and demands of it respectful due diligence or preparation. On August 21, the S&P 500 closed at a record level, but the VIX showed its divergence by ending at more than 40% above its 52-week closing low of 9.14 from November 2017. As Dana Lyons most recently described, “This has happened only three other times in the past two decades, and those were all followed by some “very inauspicious times” for equities.”
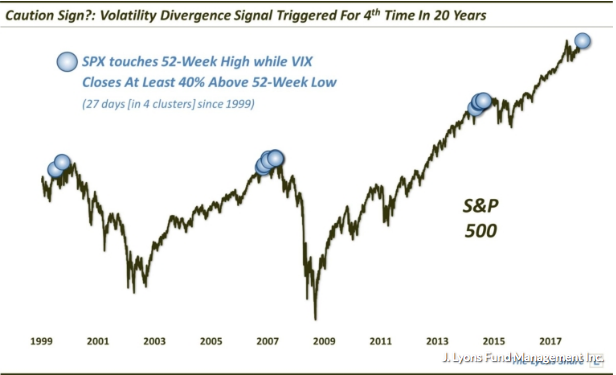
Similar divergences occurred from December 1999 to March 2000, April 2007 to October 2007 and December 2014 to February 2015, and short-term returns following those occurrences were dismal, with median returns of negative-11.3% in the following year, as outlined by Lyons.
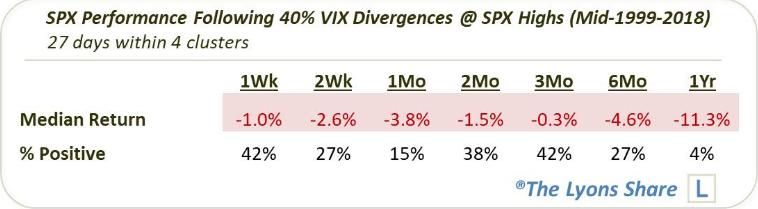
The data doesn’t look terribly promising heading into a historically bad month for equities, September. But Dana Lyons stressed that it’s only one data point and if the chart is extended further back in time, there were actually other incidences in the 1990s where the relationship between the S&P 500 and the VIX broke down without any negative consequence. The current signal may be the first of many, which happened during the mid-90s.
“While this signal may just be the first of several clustered occurrences yet to come, our analysis would lead us to believe that this signal will indeed eventually have negative ramifications for the stock market.”
Taking the confluence of data points and structural divergences presented, traders have more information to consider with regards to how to position their respective portfolios. The month of September usually proves a poor month for equities regardless of the subject being discussed within this narrative. When we look at possible rationale for which risk premium is elevated it may have to do with upcoming mid-term elections. We could literally name a half dozen or so risks the market is currently pricing in, but knowing which risk is less important than identifying the activity. While Dana Lyons is of the opinion that equities are ripe for a pending bear market cycle, Finom Group believes the current bull market cycle will have legs to grow into 2019 and see future S&P 500 record levels in 2019. Earnings growth is simply too robust and forward-looking earnings are still expected to grow in the double-digit range in early 2019.
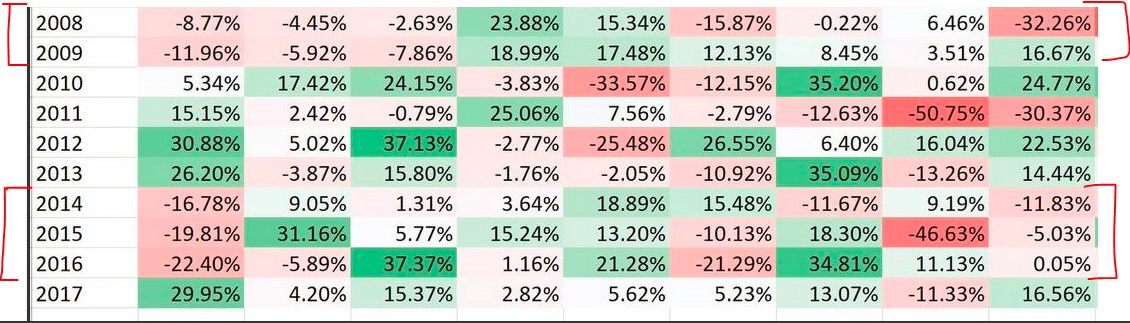
So will this September be an outlier year for the S&P 500 or equities in general? It’s hard to say, but history is siding with the bull’s camp. “It’s interesting to note that for the last 10 years, if January was hot… September was too. The only exception was 2009 and that was coming off a market crash.”
With that being said, we foresee near term bouts of volatility that center on yield curve inversion and political concerns. The market has climbed tirelessly out of a correction over the last 2 quarters and may be in need of a breather soon enough.
Moreover we will leave you with one more stat to consider. The VIX has risen alongside the S&P 500 for two consecutive trading sessions. Since 1990, there have been 102 cases in which the VIX went up 2 days in a row while the S&P went up 2 days in a row. Forward returns were quite random for these occurrences with the market going up on various occasions and down on various occasions. As detailed by Troy Bombardia, here are the historical dates whereby this anomaly occurred:
- 11/06/2018
- 12/01/2018
- 9/01/2018
- 17/10/2017
- 4/10/2017
- 29/08/2017
- 27/12/2016
- 8/12/2016
- 12/07/2016
- 8/06/2016
In the wee hours of Wednesday morning, the VIX is showing some early decay from a previous close of 12.50 to 12.30. Position appropriately traders.
*This article is delivered with great appreciation to our social media friends and family and for their significant contributions to the public. Russell Rhoads, Matt Thompson, Jin Seo, Pat Hennesey, Dana Lyons, Michael Listman, Troy Bombardia and David Lincoln.


