

Research Report Excerpt #1
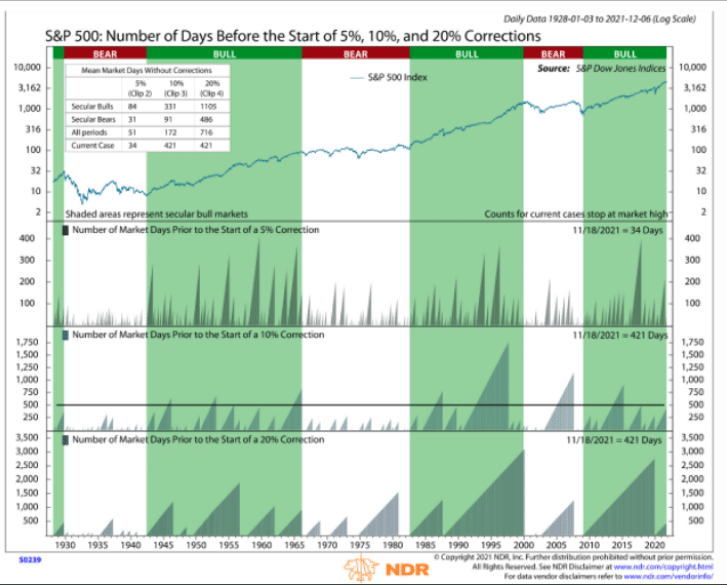
As detailed since late last year, this is the S&P 500’s fourth longest run without a 10% pullback (~22 months vs. ~1 per year). Since 1980, the S&P 500 has averaged a 14% drawdown annually. As of Friday’s close, the S&P 500 has traveled 460 trading days without a 10% correction on a closing basis. Nonetheless, it is also important to recognize that the market has no expiration or due date. Those who suggest otherwise do so for the sake of recognizing probabilities while others do so to satisfy comfort in their investing/trading process. Only 2 weeks ago, the S&P 500 was on the doorsteps of a 10% correction, but managed to only close down 9.2 percent. What I have stated since that day was that I’m not of the opinion the lows of the year have been found in the S&P 500. Does this make me bearish on the market? NO!
Research Report Excerpt #2
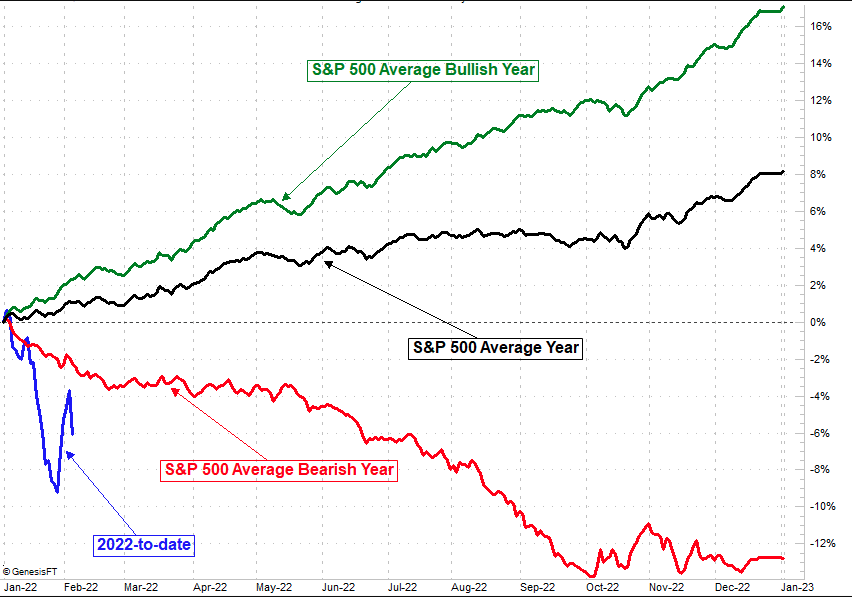
To-date, 2022 is not the average year as identified with the visual aid above. The good news, however, is as follows:
- If the S&P 500 delivers an average year from Friday’s close going forward, it would rally ~14%.
- If the S&P 500 delivers an average bullish year from Friday’s close going forward, it would rally ~22%.
- If the S&P 500 delivers an average bearish year from Friday’s close going forward, it would only fall another ~8%.
- “I like to keep it all in perspective and avoid irrational decisions.”
- Would another 8% drop from Friday’s close cause you to make irrational decisions or favor your long-term game plan?
Research Report Excerpt #3
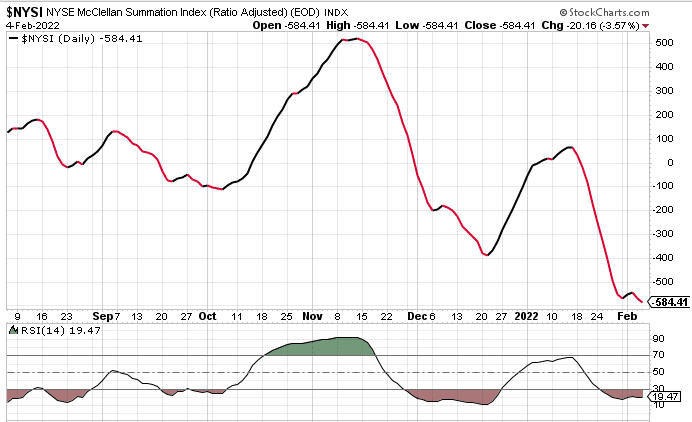
… and ultimately the NYSE Summation Index reverted to its downtrend reinforcing the cautious near-term outlook.
The Summation Index is based on work pioneered by Sherman and Marian McClellan. It is a longer-term look at the momentum of the underlying breadth of the market, adding each day’s McClellan Oscillator reading to the day before. Momentum is positive when it is above zero; below zero, it is negative. It also works as an overbought/oversold indicator when it pushes above +500 or below -1000. We are not yet below -1000, and rarely does it get there.
Research Report Excerpt #4
Now, lets see what measures of breadth have improved for the Nasdaq in the past week by firstly reviewing the Nasdaq’s New High – New Low indicator from our previous Research Report:

“As we can see, the pace of Nasdaq New Lows relative to New Highs remains a concern near-term. This is more in-keeping with the Nasdaq’s extremely modest .01% gain for the week. Longer-term, we view this as a strong buying opportunity for Nasdaq and Growth-oriented investors i.e. Tech/FANMAG/Growth. Very rarely do we see this breadth indicator this weak without the Nasdaq higher 12-months later. The chart below of $NAHL goes all the way back to 1978, another year whereby the Fed hiked rates 15 times and yet the S&P 500 was positive for the year.”
On a week-over-week basis, this measure of breadth for the Nasdaq has greatly improved, as shown in the chart below:
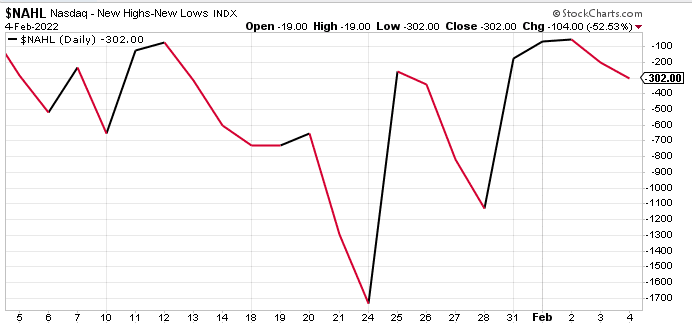
As it was with the S&P 500, however, the strong breadth improvement in the first half of the trading week gave way in the final 2 trading days of the week; this as the Nasdaq rallied on Friday.
Research Report Excerpt #5
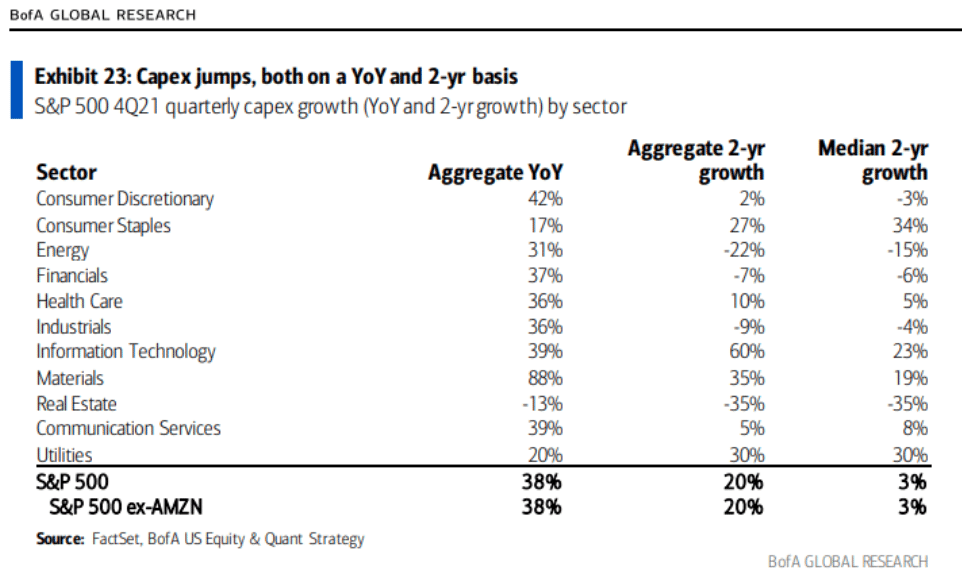
Strong aggregate demand, normalized consumer spending, increasing capital investment (table below), and improvements on the health front should help underpin solid growth for the U.S.
While we believe that the global recovery process should continue in 2022, global economic growth momentum has deteriorated amid elevated inflation, supply chain issues and a spike in coronavirus cases. The International Monetary Fund (IMF) expects global growth to moderate to 4.4% in 2022 from 5.9% in 2021. China’s growth outlook has been especially challenged as its zero-tolerance coronavirus strategy has led to restrictive shutdowns, weighing on consumption. Economic activity in Europe has also been hampered by the virus, with the services sector a major drag on the eurozone’s Markit composite Purchasing Managers’ Index for the month, bringing it to 52.4, an 11-month low. Manufacturing activity, however, remained resilient, a sign that supply chain bottlenecks could be easing and that the toll of this coronavirus wave could be more muted in Europe.
Research Report Excerpt #6
As I’ve conceded in the past, the economy is moderately slowing from an elevated rate of growth in 2021. Nonetheless, recessionary conditions have not been represented in any of the economic data delivered to-date. As it pertains to the labor market, job growth would need to weaken, and even decline, in order for a recessionary condition to be met.
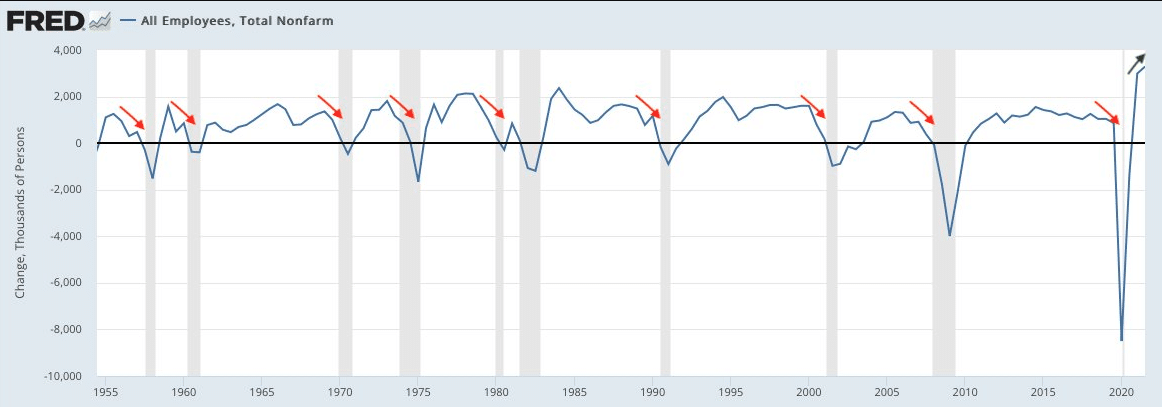
As the Nonfarm Payroll chart above indicates, most every single recession was led by a deterioration in job growth since the 1950s. The far right side of the chart is not working in favor of the recessionary fear-mongers.
Research Report Excerpt #7
The blended earnings growth rate for the fourth quarter is 29.2% today, compared to an earnings growth rate of 24.3% last week and an earnings growth rate of 21.3% at the end of the fourth quarter (December 31). That’s a mighty big jump in the earnings growth trend on a week-over-week basis, big jump indeed. Now ask yourself, “How reliable are the current consensus analyst estimates for the whole of 2022?”
Insight/2022/02.2022/02.04.2022_EI/sp-500-earnings-growth-q4-2021.png?width=920&name=sp-500-earnings-growth-q4-2021.png)
- For the full year, the blended earnings growth rate for CY 2021 is now 47.0%, up from the previous week’s 45.5 percent.
- Looking ahead to the first half of CY 2022, analysts expect earnings growth of 5.6% for Q1 2022 and 4.4% for Q2 2022.
- For CY2022, analysts expect earnings growth of 9.5%.
Research Report Excerpt #8
This is likely an anecdote that many who own the likes of PYPL, NFLX and FB will be referencing hence forth, and while the financial media offers narratives as to why the prices for the 3 stocks will never rebound to their prior highs.

The financial media will always paint a narrative around price action. If the price action is good, the bullish narrative will be emphasized and if the price action is poor, the bearish narrative will push to the forefront. We’ve all heard the bearish narratives surrounding Netflix for the better part of a decade now. The chart above depicts the December 2011 to December 2012 time period. In that time period, NFLX shares fell from $18.50 to $7.50, a more than 50% drop in ~ 6 months. How do I remember this specific example? I was performing research (by request) for a client who owned NFLX when it dropped. That was the last time he owned shares of NFLX, I’m sad to say and given the share price appreciation since. The stock has witnessed many drops of greater than 25% since its IPO, and even since this drop in 2011. The decade-long concerns over competition have only found the share price traveling ever-higher with time. Indeed, the same dramatic price moves can be seen in charts of PYPL and FB from past years. More often than not, investors don’t wait out the volatility in price, but envy those who had and benefited from a discipline that aligns with a company’s growth trend. All 3 stocks named showed growth YoY when they offered their most recent quarterly results.
Research Report Excerpt #9
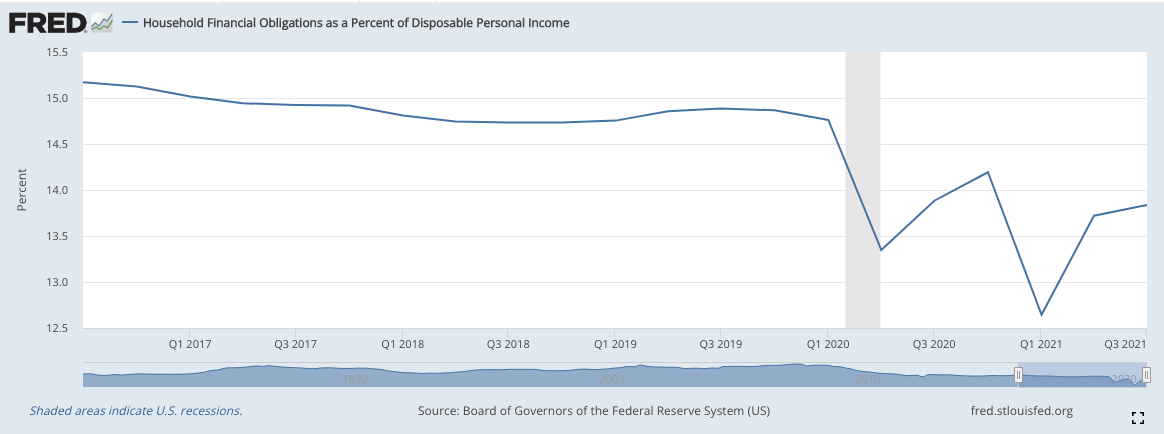
Then there is the average household, the consumer! Remember that the consumer contributes to ~70% of GDP. The chart above identifies what is more commonly known as the “consumer’s balance sheet”. At the end of the month, after all the financial obligations are accounted for, the consumer has left disposable personal income. This is income that can be spent or pushed into the economy via goods and services purchased. In general, the lower the level of Household Financial Obligations as a Percent of Disposable Personal Income, the better the household balance sheet.


