

Research Report Excerpt #1
This is not a sell-everything and run for cover moment. It’s mechanical, and if history is any guide, a longer-term opportunity for the bulls that I offered this past week:
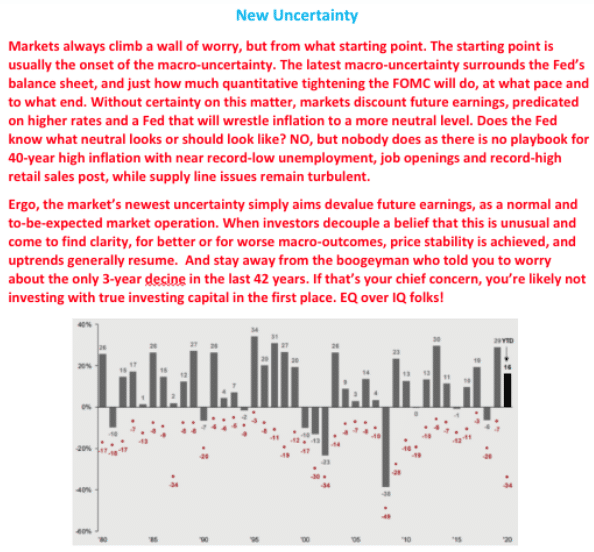
At this time, I’d invite investors/traders to go back and review where the longer-term equity market trend stands. Watching the day-to-day action will only add more fearful emotion to the equation. Reinforce that long-term view (good or bad) in your mind, because until that shows a decided change, making major portfolio changes could be premature and prove detrimental.
Research Report Excerpt #2
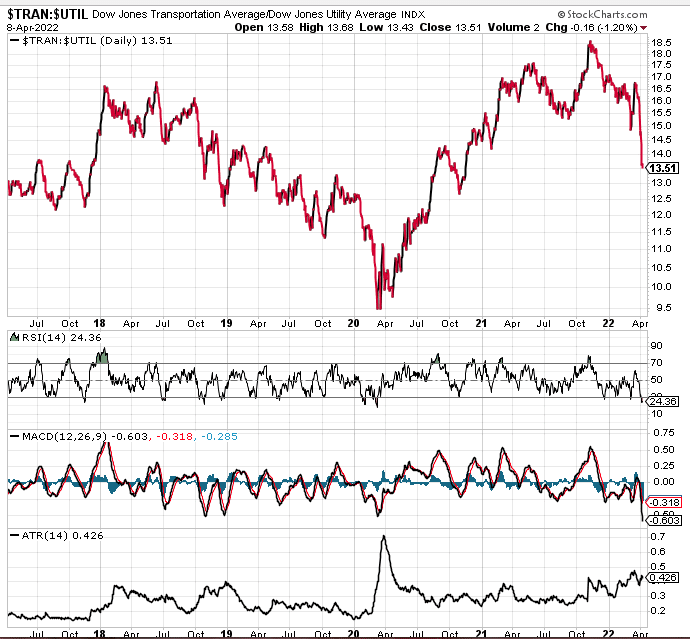
In the relative performance ratio chart of Transports:Utilities above, I’ve added a couple of stochastic metrics to the previously noted RSI. Last week, the RSI was at a bearish 30, dipping further to 24 this past week. What is also demonstrated is the lowest MACD histogram (middle panel) in the last 5-year period. Lastly, the Average True Range (ATR bottom panel) is the highest since the pandemic crash in March 2020. All combined, this identifies extreme risk-off for cyclicals such as Transports and risk-on for defensives such as Utilities. In order for this to persist, I would be of the opinion a more evidential breakdown of economic fundamentals needs to be expressed. That has not taken place to-date, but we also recognize that the economy and the market are 2 different things, with the market being a forward-discounting mechanism. As such, we should continue to monitor those macro-economic fundamentals on a weekly basis. For now, it wouldn’t be altogether surprising to see a relief-reversal of the technical dynamic above in the interim and given the extremes in the stochastic levels at the end of the week.
Research Report Excerpt #3
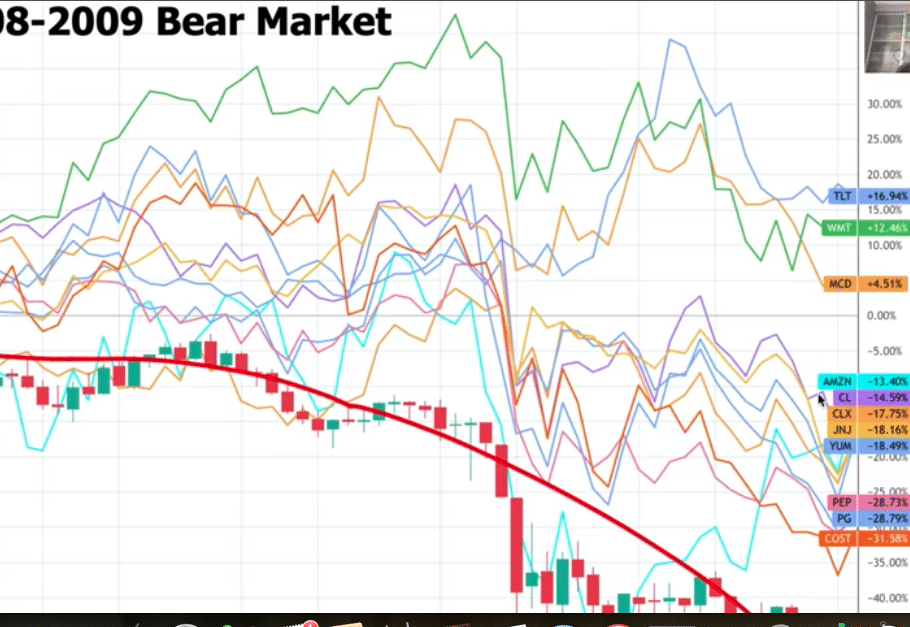
I’ve owned WMT shares in the Golden Capital Portfolio for the last 20 months, trading around and building the core holding since 2020. We’ve traded WMT shares as part of the Finom Group Trade Alert regiment over this time period, collecting the quarterly dividend as well. Since shares of WMT breached the former all-time high, I have been locking in profits and reducing my weighting to an Equal Weight in the Golden Capital Portfolio. In doing so, I’ve also rotated the profits into another defensive stock, Verizon (VZ). I’ve also owned VZ in the Golden Capital Portfolio since 2019, collecting a nearly 5% annual dividend and trading the stock with Finom Group Trade Alerts over the last 2 years. While VZ shares greatly underperformed the market in 2021, given defensive underperformance, the stock has greatly outperformed the S&P 500 year-to-date, this past week included. Don’t get me wrong, while these have been strong performers for the Golden Capital Portfolio in 2022, they are serving to offset some market and underperforming names in the portfolio year-to-date. Nonetheless, and as part of a well-defined and disciplined process, when I analyze the names in the portfolio I recognize certain names will continue to market perform and demand an extended time horizon to achieve their desired profits, while others may need to be culled from the portfolio for cyclical reasons. I encourage all investors to engage each name in their portfolio for the same purpose, to ensure the health and longevity of profitable outcomes.
Research Report Excerpt #4

While New Lows for both indices are creeping higher once again and is not a positive sign for maintaining the 50-DMA level for the indices, one would think that the Nasdaq would have a much higher level of New Lows given the outsized decline this past week and a 2-week decline for the index. But that just isn’t the case. The NYSE with a lesser decline this past week has far more lows over the course of the past week. I’m still assessing this interesting dynamic, but it could further validate that the lows are already in for the Nasdaq, barring macro-fundamental deterioration.
Research Report Excerpt #5
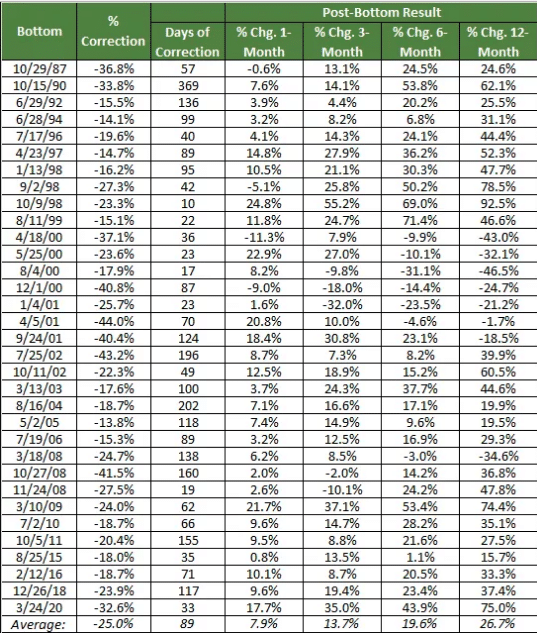
So what happens during and after the typical correction/bear market for the Nasdaq Composite. The results were not all that surprising. Perhaps most noteworthy is the fact that the market always bounces back, and usually sooner than you might expect.
- On average, the composite is nearly 8% above its correction low within a month of that low being made. That already happened obviously.
- Three months later it’s up on the order of 14%, which we’ll find out soon enough.
- Within 6 months the Nasdaq has recovered by nearly 20%, and within 12 months it’s up almost 27 percent.
- Cash, sidelines, how much you got?
There’s a catch! The catch is, that you don’t know when the bottom has actually been made. You can make reasonable guesses as to when it might have been made, again using averages.
Research Report Excerpt #6
2020 wasn’t the first time we’ve seen a higher stock market in spite of an economic downturn. The same thing happened in 8 other years since 1930…

The point of this outline was to simply recognize that the market and the economy don’t always do want you expect, as the 2 are not correlated in real time, but over the span of time.
Research Report Excerpt #7
Time to tighten the belt? “Faced with higher prices for items consumers really need like gas and food, they could either allow their total spending to rise to keep overall spending plans on track, or spend less on lower-priority ‘nice to have’ items to keep a lid on total spending. There are some signs that spending growth among lower-income consumers is indeed slowing for some more discretionary items. In particular clothing and furniture spending growth has slowed sharply relative to a year earlier according to Bank of America data. For now the level of spending compared to pre-pandemic times is still relatively high – but this drop-off in spending on more discretionary items could be indicative of lower income groups feeling some pressure.”
Research Report Excerpt #8
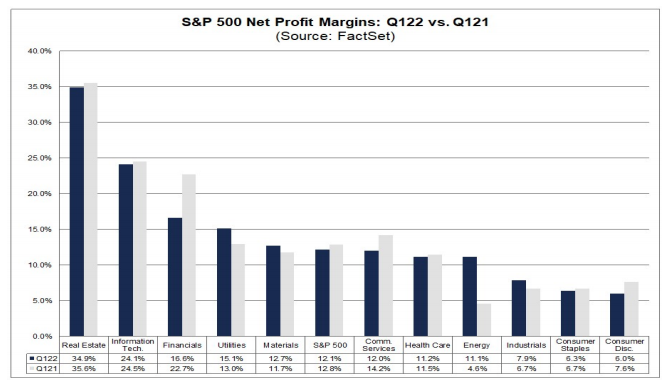
For Q1 Net Profit Margins are modeled to come in at 12.1% by FactSet. The current S&P 500 P/E ratio stands at 19.2%, the lowest levels since 2019.
- For Q2 2022, analysts are projecting earnings growth of 6.2% and revenue growth of 9.8%.
- For Q3 2022, analysts are projecting earnings growth of 10.7% and revenue growth of 8.8%.
- For Q4 2022, analysts are projecting earnings growth of 10.3% and revenue growth of 7.4%.
- For CY 2022, analysts are projecting earnings growth of 9.8% and revenue growth of 9.5%.
Research Report Excerpt #9
The chart below, from DataTrek, shows the 10-year history of outstanding credit card balances. Three points here:
- Balances topped out in March 2020, just ahead of pandemic-related shutdowns, at $859 billion. The compounded annual growth rate prior to that had been strong: 5.1% annually over the last 5 years.
- Many Americans used their stimulus checks to pay down credit card debt in 2020. Bank charge-offs for bad credit card loans were slightly higher in 1H 2020 (3.9 to 4.0% versus 3.5 – 3.8% in 2019) but came down to very low levels in 2H 2020 (below 3%). The drop in outstanding balances to a trough of $741 billion in February 2021 was largely due to cardholders reducing debt, not write-offs of bad loans.
- Balances started to increase sharply during the Holiday 2021 shopping season and are now within sight of the old highs, at $844 billion.


