
As we enter the 2nd week of earnings season having witnessed the 1st week of earnings season provide a relatively small boost to the major indices, I can’t help but to wonder what we will hear coming from the retail sector in the next couple of weeks. Retailers, by and large, won’t begin reporting their Q3 2017 results until early November and as the Thanksgiving Day holiday shopping season kicks into gear. As the Halloween period ends on October 31st, the real shopping begins with millions of Americans hitting their favorite shopping destinations, ramping up spending for Thanksgiving dinners and the all-important Christmas and Hanukah gift-giving seasons. It’s in this spirit of retail spending that this article aims to update investors and traders on the most recent and trending retail sales data.
On Friday 13th, how fitting, the U.S. Commerce Department reported that September retail sales rose 1.6% against economists’ expectations of a 1.7% rise in retail sales for the month. While this was a slight miss against expectations, it marked the largest rise in monthly retail sales in nearly 2 ½ years. The retail sales data for August was also revised to show sales slipping 0.1% instead of the previously reported 0.2% drop. Retail sales increased 4.4 percent on an annual basis. Economists polled by Reuters had forecast retail sales jumping 1.7 percent in September.
Hurricane’s Irma and Harvey played a large role in the September retail sales figures. The impact shows up mightily in the different categories for which make up the retail sales data.
Sales at gardening and building material stores increased 2.1 percent last month, the biggest increase since February, and followed a 0.6 percent rise in August. Receipts at auto dealerships soared 3.6 percent likely as residents replaced flood-damaged motor vehicles. That was the largest rise since March 2015 and followed a 2.1 percent decline in August. Retail sales were also lifted by a 5.8 percent surge in receipts at service stations. The increase was the largest since February 2013 and followed a 4.1 percent gain in August.
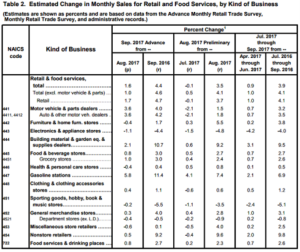
If we strip out automobiles, gasoline, building materials and food services, retail sales increased a scant 0.4% last month after being unchanged in August. These retail sales correspond most closely with the consumer-spending component of gross domestic product. The rebound in core retail sales from August to September also suggests the drag on the economy from the hurricanes will be very modest, but detract nearly .5% from total GDP. Below is a table of the individual categories that make up the total, monthly retail sales data:
As it pertains to the chart and correlates to investor decision making, the most glaring aspect continues to be the contracting Department Store retail sales and the growth in Non-store/e-commerce retail sales. During the month of September, Department Store sales fell .4% from August and .5% year-over-year. As a complete offset and in stark contrast, Non-store sales rose in September .5% from August and 9.2% year-over-year. Another sore spot reported in the September retail sales report came from Sporting goods, which fell .2% since August and 5.5% year-over-year.
Department stores have continued to struggle through much of 2017 and that struggle will likely continue into 2018 as more and more retail consumption is conducted through e-commerce and digital facing channels. Most national retail chains nowadays have largely positioned for growth in the digital retail space, but even as such and with relatively high growth, it simply hasn’t been enough to offset what is occurring at physical storefronts.
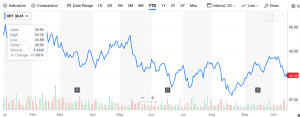
Given the aforementioned and well chronicled struggles for retailers of scale over the last few years, the share prices of many national retailers such as Target (TGT), J.C. Penney (JCP) Kohl’s (KSS), Macy’s (M) and more have born witness to large share price declines over the last two years. This has also played out in the Spider S&P Retail ETF (XRT) as shown below. The XRT is down roughly 10% year-to-date.
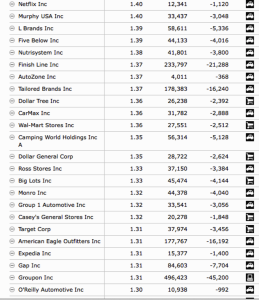
Some of the top holdings in the XRT are nothing to be terribly optimistic about either. The following table represents the top 25 holdings within the XRT according to Morningstar:
Reverting to my opening remarks, it will be interesting to see how some of the retailers have performed during the Q3 2017 period. More recently, we discovered that Bed Bath & Beyond (BBBY) had a rough Q2 2017 period. A period that I would offer many could have easily forecasted and for which I had previously done so. My following remarks and analysis was delivered earlier this year as I failed to understand why Bed Bath & Beyond had not already lowered its FY17 outlook.
Given the exacerbated EPS declines in the 1st quarter and with no clarity of improving metric performance by management for the 2nd quarter in view, I’m of the opinion that Bed Bath & Beyond’s CEO is putting investor capital at significant risk. The long-established trends for gross margin contraction and their increasing weight on earnings suggest that Q2 will find the CEO revising FY guidance downward for both sales and earnings. Below is what CEO Steve Temares had to offer on the Q1 2017 Conference Call with Investors and Analysts:
Unfortunately, my predictions and analysis came to fruition with management lowering their FY17 outlook. But my warnings to investors regarding the Bed Bath & Beyond struggles date back to 2015 and as I personally scaled out of my investment at $76 a share through my UBS managed holdings. At the onset of 2017 I reiterated my concerns for the retailer in the following statements and article titled Bed Bath & Beyond: A Retail Tale Of The Walking Dead.
Many analysts have reduced their expectations for shares of BBBY going forward. Given that most still reflect a bottoming in 2017 and a $40+ price target, it doesn’t seem as though the analysts are appreciating history or metric declines in perpetuity. In most every single analyst report I’ve read since Bed Bath & Beyond’s issuance of Q3 2016 results, none provide a reasonable solution to the ails of the business or reasoning for a bottoming in profits.
Bed Bath & Beyond missed analysts’ estimates for the Q2 period mightily. The retailer reported Q2 EPS of $0.67 compared to consensus estimates of $0.95. The company further reported revenue of $2.94B (-1.7% Y/Y), which missed by $70M. And for all the operational streamlining the company has and will continue to do, inclusive of employee headcount reductions, the retailer will not experience material cost savings impact.
Digital facing sales continue to outperform for Bed Bath & Beyond, growing above 20% in the most recent quarter and for about 13 straight quarters. But with that being said, e-commerce sales still only represent about 15% of total net sales for the home goods retailer. For many of the initiatives the retailer has in place regarding product assortment, it’s largest identified growth opportunity centers on furniture and décor. These categories still yet represent only 13% of the company’s total sales. The opportunity is obviously there to grow this category of sales, but it is able to scale these sales quickly enough to offset current sales woes outside of these categories. With same-store-sales falling 2.6% in the most recently reported quarter, an accelerated decline QoQ, the retailer will have to quickly ramp its furniture and décor initiatives.
Where it remains deeply concerning for Bed Bath & Beyond and shareholders of record is the gross margin performance. No matter which of my many BBBY-centric articles one chooses to read, the story never changes: Gross margins always contract for the retailer. As such, the Q2 period and forecasted Q3-Q4 periods will continue to show such margin contraction as offered by Bed Bath & Beyond’s Chief Financial Officer. In Q2 2017, gross margins fell another 100 basis points YOY to 36.4 percent. Be it the direct-to-consumer shipping expense or increased coupon redemptions, Bed Bath & Beyond can’t seem to offset these impairments to its total gross profit margin performance.
As I’ve offered many a time regarding the company’s many initiatives, Bed Bath & Beyond is not only suffering from a seismic shift in how consumers purchase goods and services, but the retailer is also suffering from a demographic shift. Bed Bath & Beyond, simply put, has not in the last decade found a way to replace its aged and expiring core Baby Boomer consumer. Gen-Xers didn’t fill this gap in demographic slippage and Millenials have an even lesser need for the retailer’s offerings be it due to slower household formation or general appetite for excess. So while Bed Bath & Beyond’s management team offers up a good deal of potential results from it’s many initiatives in it’s quarterly conference calls, do yourself a favor and find the one that attacks the consumer demographic problems facing the retailer. Then go visit a Bed Bath & Beyond location and try your best to find even a handful of Millenials shopping its physical store.
There was a time in the retail landscape when Bed Bath & Beyond could ignore television and other forms of mainstream marketing, but that time has long since passed. The retailer needs to rethink how to best and continually engage Millenials. In the absence of such actions and knowledge, investors in BBBY shares have the uninspiring position of hoping metrics have hit a near term bottom, a bottom low enough to modestly show improvement.
Moreover, Bed Bath & Beyond offered its updated guidance to reflect the following:
Comparable sales are estimated to decline in a similar percentage range as we experienced in the first-half of the year. We continue to model gross margin deleverage for the full-year, including increases in net direct to customer shipping expense and coupon expense. All of this considered, we are modeling net earnings per diluted share for the full-year to be about $3, with the balance of the net earnings per diluted share to be split roughly 20% in the third quarter and roughly 80% in the fourth quarter.
What BBBY shares have proven over the last 2 years is that cheap shares can become cheaper and value traps are still present in the marketplace today. BBBY shares are trading at roughly 7 X FY17 EPS. That’s the cheapest level it has traded in many years and significantly cheaper than where its peers are trading at present. But with that said, shares of BBBY are trading with this valuation for very reasonable and consistent reasoning related to its underperforming metrics. I couldn’t speak to whether the share price will breach $20 or not, but for a long side trade and if it does…be on the look out! Additionally, XRT recently dipped below $40 a share. If one were looking for a longer term trade in the ETF, I’d prefer to see how it reacts should it achieve $39 a share before initiating such a trade.


