Investors are hopeful that April proves a better month for equities than did March and after closing out a bearish quarter for the benchmark S&P 500. Through March, the Dow fell 3.7%, the S&P 500 lost 2.7%, and the Nasdaq fell 2.9 percent. In the first quarter, the blue-chip gauge fell 2.3% and the S&P lost 1.2%. Both ended nine-quarter streaks of gains; for the Dow, that represented its longest such streak since 1997. April and the start of the Q2 2018 period couldn’t come any sooner or be met with any greater hope and optimism from investors.
Good riddance to the first quarter,” Ryan Detrick, senior market strategist at LPL Financial, told CNBC’s “Trading Nation” this week. “The positive lining is April, historically, has been really strong for stocks. We’re back to the 200-day moving average on the S&P. This is fairly normal when you consider the fact that we just had nine consecutive quarters of gains for the S&P 500. All in all, maybe it’s just the market catching its breath for potentially more strength before the year is over.”
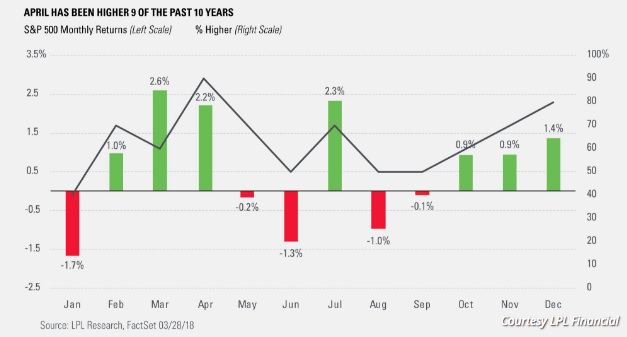
Since 1950 the S&P 500 has posted an average 1.5% gain in the month of April. That average is only surpassed by the typically bullish months of November and December.
The first quarter was maligned by several factors that brought about a surge in the fear gauge, the VIX. Be it the geopolitical rhetoric or FANG unwind, it was enough to keep the VIX above 15 for most of the quarter. According to WSJ Market Data Group, the VIX posted its biggest quarterly rise, up 81% since it jumped in the third-quarter of 2011 following Standard & Poor’s historical downgrade of the U.S. credit rating and European debt-crisis fears. Given the propensity of market moving headlines spurring the VIX of late, coming out of the White House, investors are prepping for earnings season.
Expectations are high for Q1 2018 earnings. They have been ramping higher through the Q4 2017 period and as corporations delivered strong results coupled with guidance that showed growth for 2018. S&P 500 companies are expected to post a 17.3% increase in earnings for fiscal 2018, according to analysts surveyed by FactSet. That would mark its strongest annual earnings growth since 2010. If we take a look at Thomson Reuters, Lipper earnings forecast for the S&P 500, the results are expected to be even stronger. First quarter earnings are expected to increase 18.5% from Q1 2017. Excluding the energy sector, the earnings growth estimate declines to 16.7 percent.
Naturally, rising expectations will make it harder for companies to surpass forecasts, but the recent declines for equities suggest the strong profit picture may not have been fully priced into shares. The forward 12-month price-to-earnings ratio for the S&P currently stands at 16.1, in line with the index’s five-year average, but above the 10-year average of 14.3.
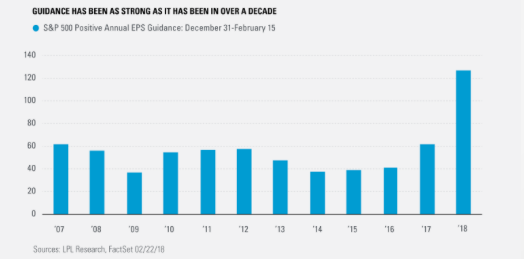
As shown in the chart below, the number of companies raising guidance for this year is double the highest levels of the previous decade for the same period.
The raised corporate guidance through the Q4 2017 earnings period forced LPL to raise their 2018 S&P 500 target and earnings forecast in late February. According to LPL Chief Investment Strategist John Lynch, “We expect earnings to continue to get strong support from accelerating U.S. and global economic growth, a pickup in business spending, and strong manufacturing activity. Our revised year-end S&P 500 fair value range of 2950–3000 represents a 19.5 price-to-earnings ratio on $152.50 in earnings per share in 2018.”
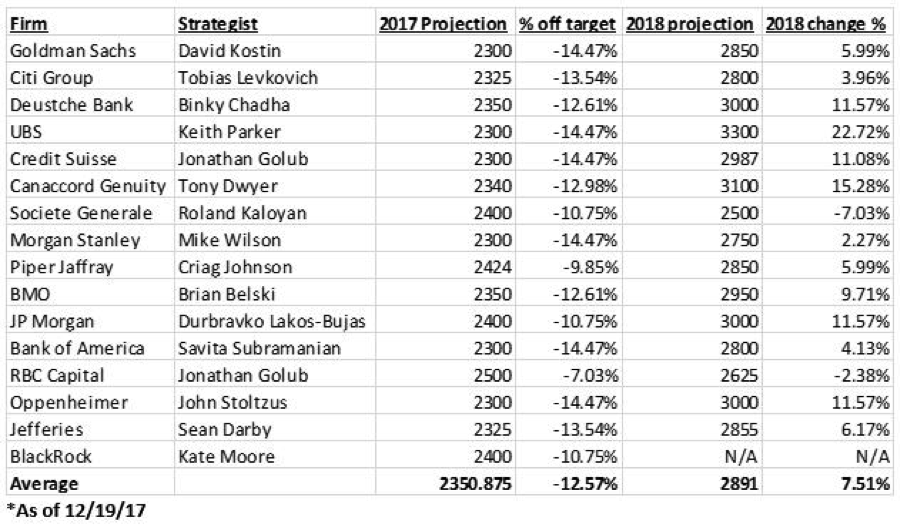
The following table identifies S&P 500 target levels by some of Wall Street’s largest financial and market institutions, as of late 2017.
Undoubtedly, the earnings outlook remains strong wherever one chooses to look in the market place, but the stock market has yet to regain sustainable traction, rewarding investors in kind. The strong corporate earnings picture and backdrop of an expanding economy have yet to replace or overcome the geopolitical issues that have mounted in recent weeks. This week, investors will be eyeing a critically important gauge of the economy, Nonfarm Payroll report. The mean estimate of analysts polled by MarketWatch is for 200,000 jobs to have been added in March. Average hourly earnings are seen growing 0.2%, far from the 2.9% growth seen in January.
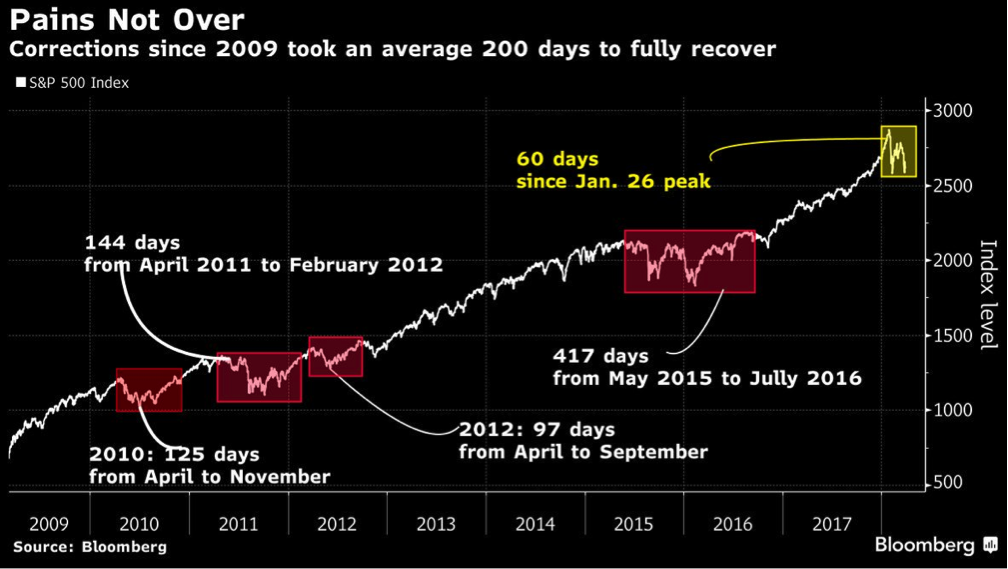
The S&P 500 is still in a correction phase and corrections can last for a while. As shown in the chart below, the typical correction can last 200 days before a full market recovery is achieved.