Welcome to this week’s State of the Markets with Wayne Nelson and Seth Golden. Please click the following link to review the SOTM video. In 2020, markets continue there seemingly endless melt-up. We all know that when valuations stretch too far beyond their historic average, unkind things tend to take place in the market. As it was in the previous week, sentiment and market breadth register at extreme levels, but the low liquidity market and lack of selling volume has found the bull with legs and reaching beyond 3,300 on the S&P 500 for the week. The S&P 500 is now up 3% in 2020 already. Comparisons between January 2020 and January 2018 have run rampant this week. We suggest the bull market will carry forward, but not higher in a straight line and not without a near-term correction. Without a recession on the horizon and with earnings projected to rebound in 2020, we anticipate a potential double-digit return year again for the benchmark index and as the typical return during an election year is roughly 11 percent.
If the S&P 500 doesn’t suffer a negative reversal today, it will close above its daily, weekly, and (so far) monthly Bollinger Bands while at an all-time high. That hasn’t happened since June 1997.
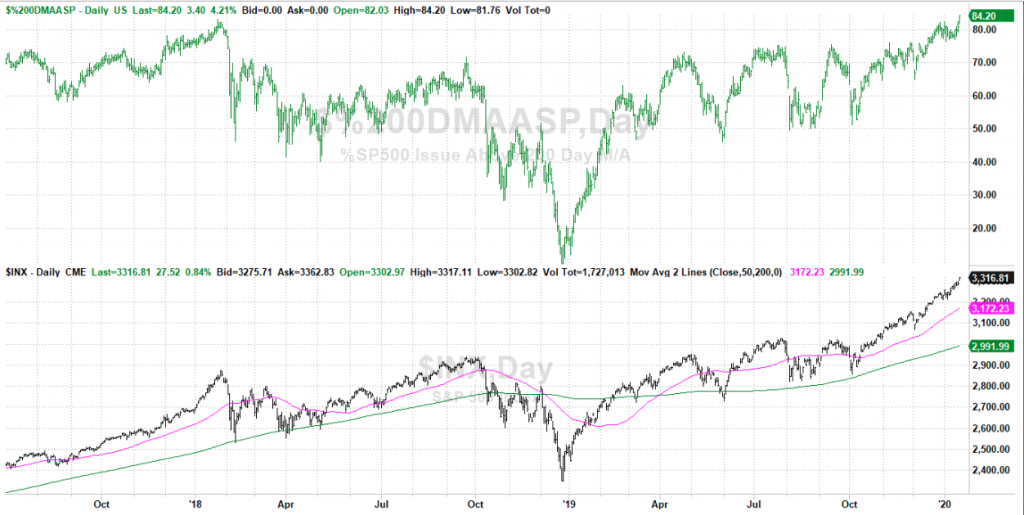
- As of Thursday, 84.2% of the S&P 500’s issues were above their 200-DMA. That’s just a hair more than the peak level we saw above their 200-DMA in January of 2018.
- That’s what’s indicated on the upper portion of the chart , with the S&P 500 and its 50-DMA and 200-DMA (pink and green, respectively) on the lower half.
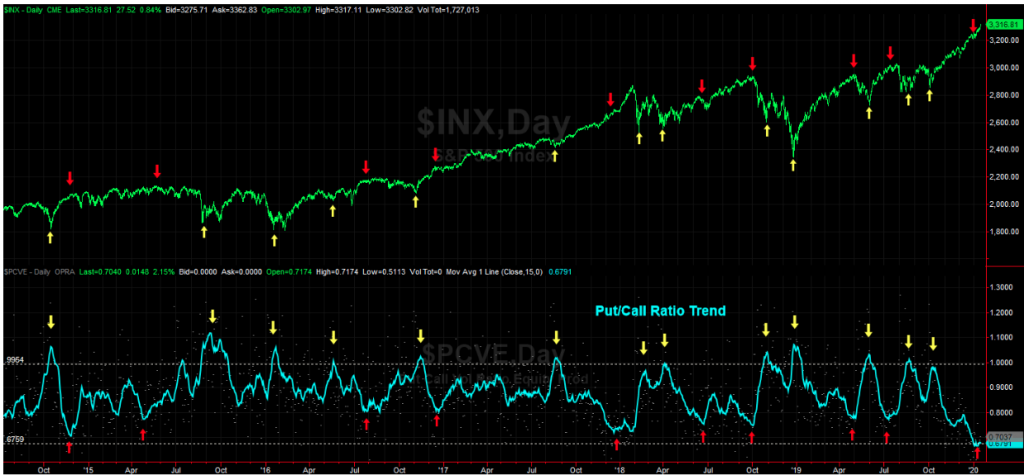
- The put/call ratio 15-day moving average line, which captures the bigger trend, is at 0.679. That’s lower than the put/call trend has been since the beginning of 2014.
- More often than not, a put/call ratio at an extreme indicates that traders’ presumptions have reached unsustainable levels. A reversal is increasingly probable for the market.
- Risk/Reward is unfavorable at such levels.
- Stock prices have continued to soar to new highs ever since the S&P 500 last exceeded its 9/20/18 high of 2930.75 on 10/10/19. As of Tuesday’s close, it was up 12.0% since 9/20/18 and up 39.6% from the Christmas Eve 2018 massacre low of 2351.10. It’s definitely been a melt-up since then, led by the forward P/E multiple, which rose from a low of 13.5 back then to 18.5 on Tuesday
- The forward P/E is at a cyclical high, though still well below the tech bubble high of 25.7 on 4/12/99.
CITI: moving more defensive on the “reaching the summit of the wall-of-worry” theme
- Global growth rebound is consensus.
- The phase one deal is behind us.
- Risk markets are overbought.
- We are therefore getting more defensive.
BofA: “We stay irrationally bullish until peak Positioning and peak Liquidity incite spike in bond yields & 4-8% equity correction.”
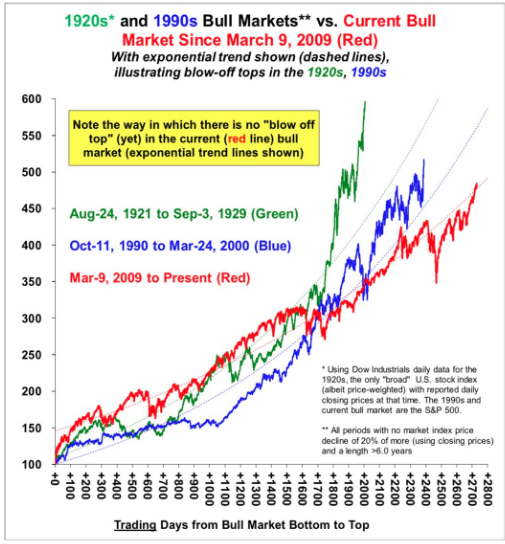
- As Strategas points out, the current uptrend/melt-up is actually quite linear, comparatively speaking.
- Election years tend to be favorable for markets.
- David Tepper: “I love riding a horse that’s running. We have been long & continue that way. At some point, the market will get to a level that I will slow down that horse & eventually get off.” He did not specify when that would be.
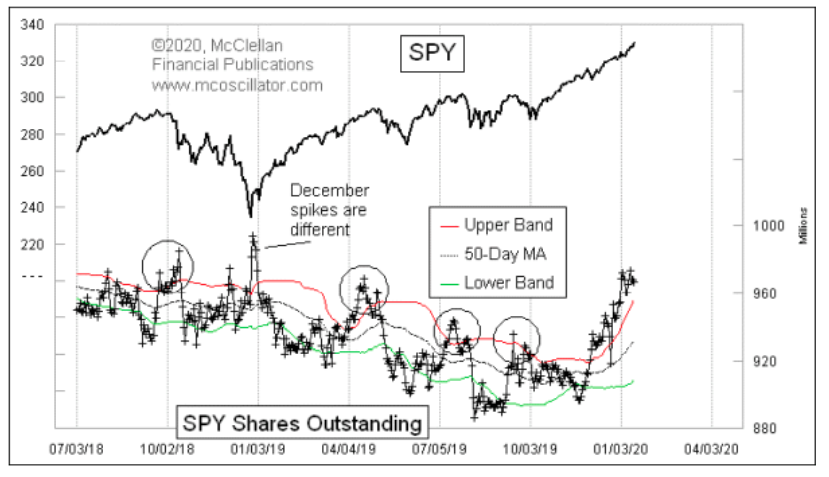
- From Tom McClellan: The number of SPY shares outstanding is above its upper 50-1 Bollinger Band, and continuing to rise.
- When this indicator has gone above that upper 50-1 band you will notice that all of them in this chart except 1 were associated with meaningful tops leading to noticeable corrections.
- When more people want to buy into the market, they bid up the price of SPY which triggers the sponsoring firm (State Street Global Advisors) to issue more shares to get the share price nudged back as close as possible to the net asset value. That results in more shares outstanding, and the firm invests the cash it receives in more of the underlying stocks.
- The principle does not work in late December, because of something that big portfolios do.
- Around Christmastime, trading volume in the stock market generally dries up. A big mutual fund or other portfolio which gets in new money to invest does not necessarily want to put that money to work by buying more shares of its preferred list of holdings, since that would adversely affect prices in the thin trading environment. So they maintain “market tracking” by other means, by either using stock index futures or by trading ETFs like SPY.
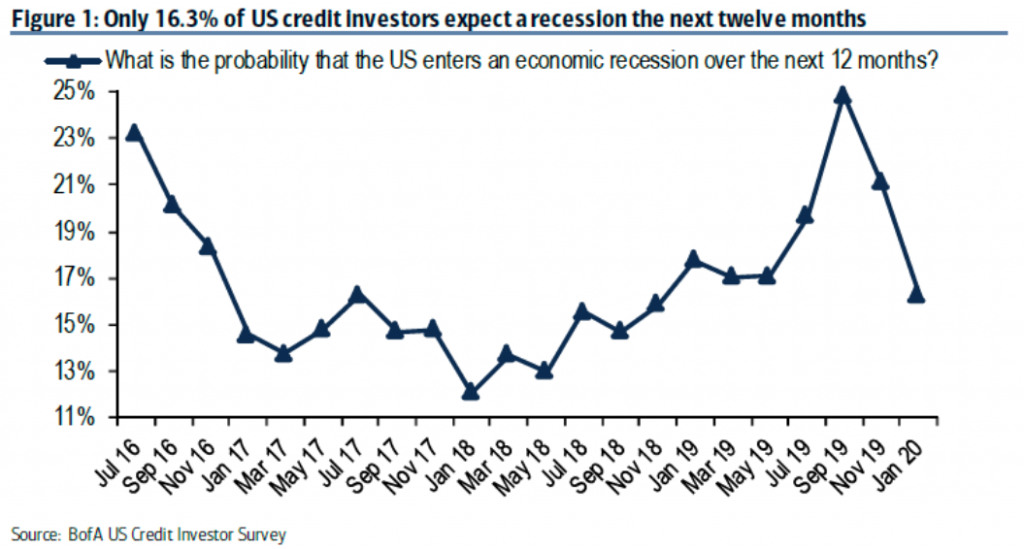
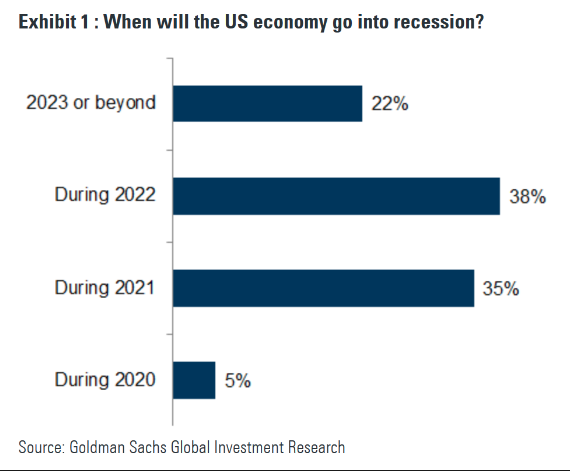
- A recession is not forecasted for 2020.
- Recession risk has been canceled by credit investors. Via BofAML’s January credit investor survey:
- The Nasdaq Composite is currently 36% above its 200 week moving average. At the 2000 peak, it was 150% above. This market is not like the Dot Com bubble.
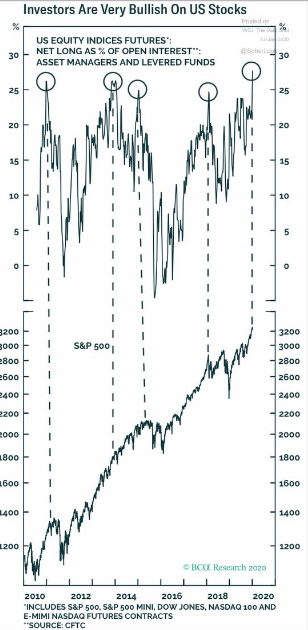
- Bullishness, measured by nearly all sentiment measures, extremely high, per Lizz Ann Sonders
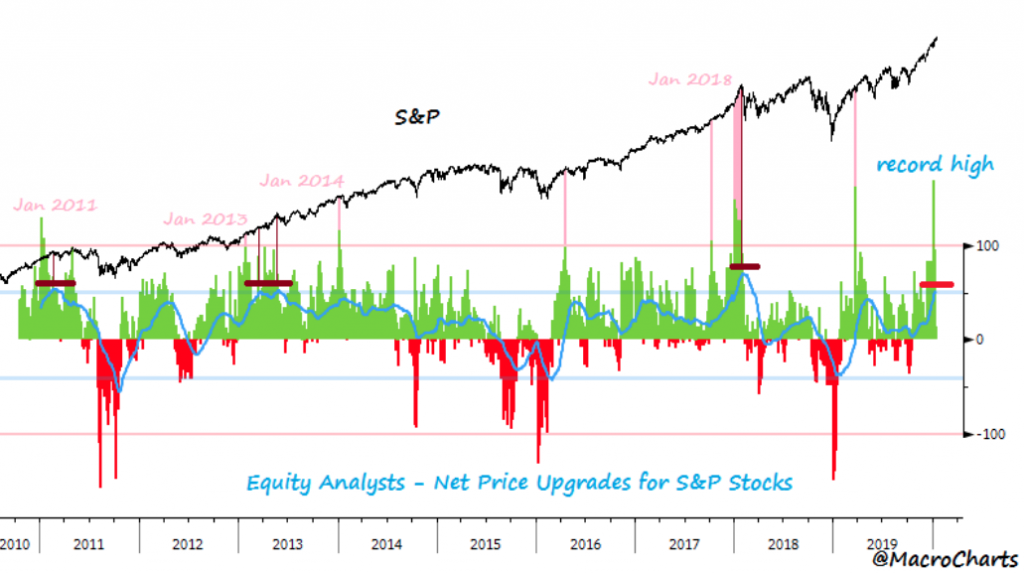
- Stock Analysts are upgrading “Price Targets” at a record pace (data starts 2010).
- Doesn’t mean “Short everything”, but certainly shows how far *expectations* have come since 2018 lows.
- Further, the 3M average has been this elevated only a few times, some led to big Volatility.
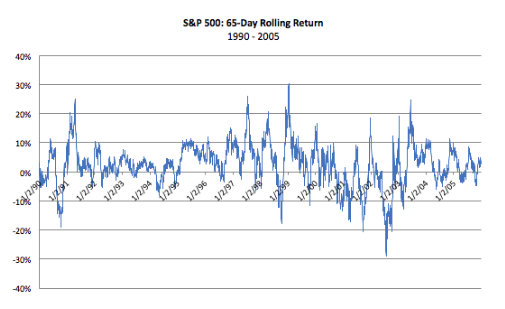
- The S&P 500 is up 11.4% over the last 65 trading days (roughly 3 calendar months). That’s more like a whole year’s typical return, not just a quarter’s performance.
- To assess how unusual an 11%, 3-month return really is, lets look at the S&P 500 daily return data back to 1990 and run rolling 65-trading-day returns.
- Since 1990, 3-month returns have averaged 2.2%. Compound that into a year and you get 9.1%.
- The standard deviation of those quarterly returns is 7.3 percentage points. That means any 3-month return between -5.1% and +9.5% is in the meaty part of a normal return distribution.
- Yes, the current 11% return over the last 3 months is well outside the normal bounds for quarterly S&P 500 performance.
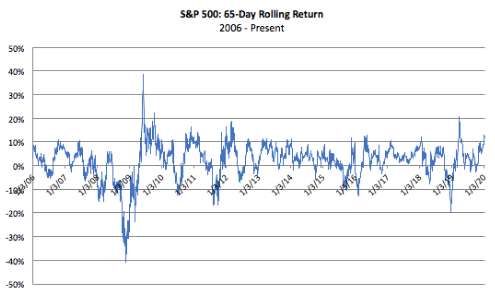
- A look at just the last 15 years (2006 to present) shows the S&P 500 has rarely rallied much more than 10% (the 1 standard deviation upside level) unless it is snapping back from a serious prior downdraft in the recent past.
- The chart above shows that 10% is usually a hard cap on 3-month returns, either before or after the Financial Crisis.
- The only real exceptions are mid 2009, late 2010, late 2012, and early 2019. In each instance the S&P 500 had recently pulled back more than 10%.
- The current 11%, 3-month return does not come after a 10% pullback, because at its worst levels in early October the S&P was only down 3% in the previous 30 days.
“You have to go back to the 1990 – 2005 experience to find a period when the S&P managed to rally materially further after a +10% 3-month advance without the requisite prior near-term +10% decline.”
- Mid 1997 was the first instance, with a peak 25% 3-month return.
- It happened again in Q1 1998, with a 20% 3-month return.
- Important: annualized S&P earnings growth was accelerating during both periods. From Q1 to Q3 1997, it went from 7% to 11%. From 1998 to 1999 earnings growth accelerated from 1% to 20%, so Q1 1998 was looking forward to that improvement.
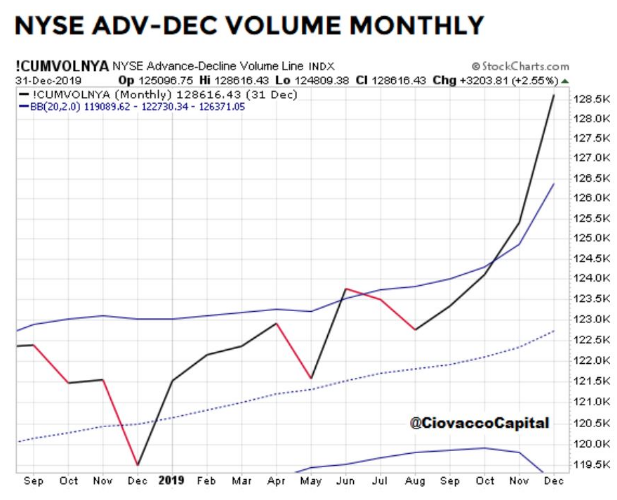
- Chris Ciovacco says that that investors should prepare for several more years of this bull market, albeit with some “scary pullbacks occurring along the way.”
- Ciovacco made the case in May and October that equities have at least two more years of gains ahead.
- The above chart that shows “rare and lopsided market breadth that has marked the early stages of stock moves that began in 1982, 1985, 1991, 1995, 2003 and 2009.” Market breadth refers to the number of stocks advancing versus those declining, and when more stocks are rising it can confirm an uptrend and that bulls are at the helm.
- “Consensus has been saying ‘late cycle’ for a few years now,” said Ciovacco. Indeed, some have been worried that markets and the economy have had a good run, but it is reaching the end. “History says we should be open to early-to-mid cycle in terms of a secular stock market trend.”
“Per our estimates, nearly 36% of the total $Gamma across strikes is set to drop-off following Friday’s expiry, which should then allow us greater freedom to move in either direction”
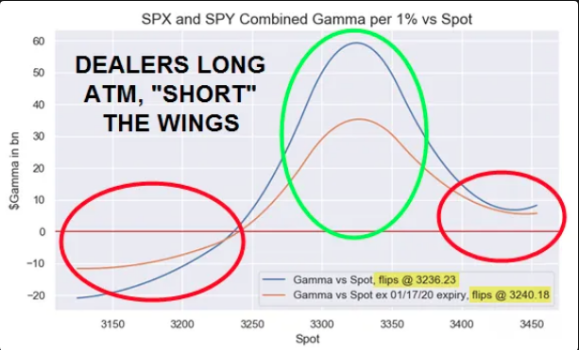
- Charlie McElligott continues in his latest piece,
- “This is particularly important because although we see such an epic Dealer “Long $Gamma” position in aggregate, it’s very much focused ATM—but in the wings, they look “Short” so IF we were to see an impulse LOWER in $Gamma from the post-expiry “roll-off,” we have scope for sloppier price-action ($gamma flips negative to the downside ~ 3240, with Dealers too “a lot less long / potentially short” to the upside around 3400 as well)”.
- “CTAs have been relentlessly net-buying S&P 500 futures & Nasdaq 100 futures w/o any self-imposed checks on how large their net long positions become…CTAs are inclined to chase the market up as far as they can, while employing increasingly risky methods in doing so”
- TME comment, volatility at these levels is not dirt cheap given the realised vols, but volatility here is pricing very little risk of anything “unexpected” happening, be it geopolitics, earnings etc.
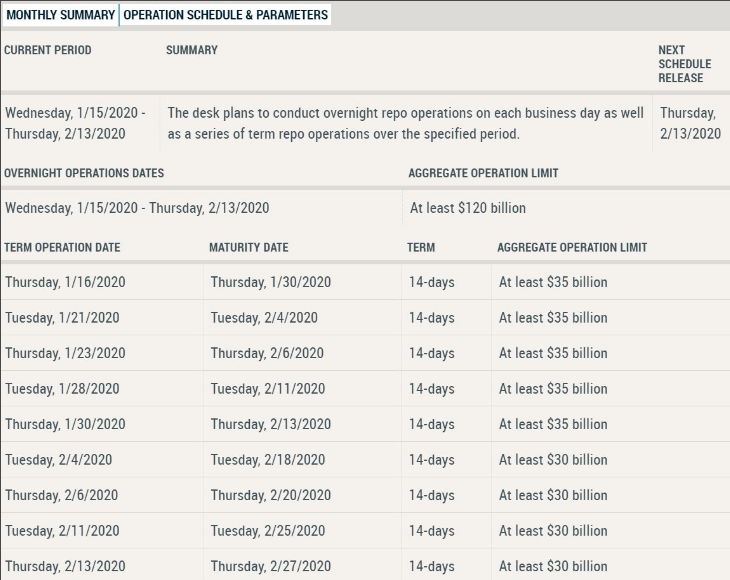
- Repo provision to be tapered starting 2/4, at a rate of $20Bn/month.
- This is a very slow tapering
- Market doesn’t seem disturbed by the new scheduled Repo provisions.
- We measure liquidity through the funds that flow through both the traditional banking system, and through the repo and swap markets.
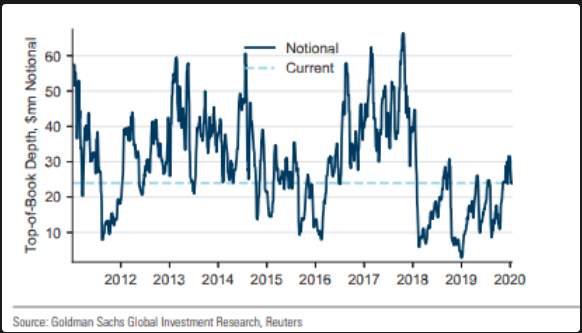
- The global credit system increasingly operates through these latter wholesale markets, and often with the active participation of central banks.
- For some years now, the wholesale money markets have been fueled by vast inflows from corporate and institutional cash pools, such as those controlled by cash-rich companies, asset managers and hedge funds, the cash-collateral business of derivative traders, sovereign wealth funds and foreign exchange reserve managers.
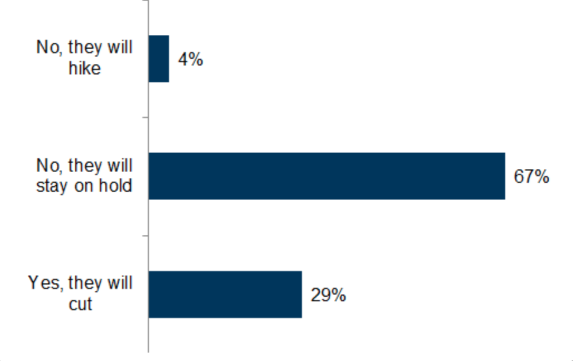
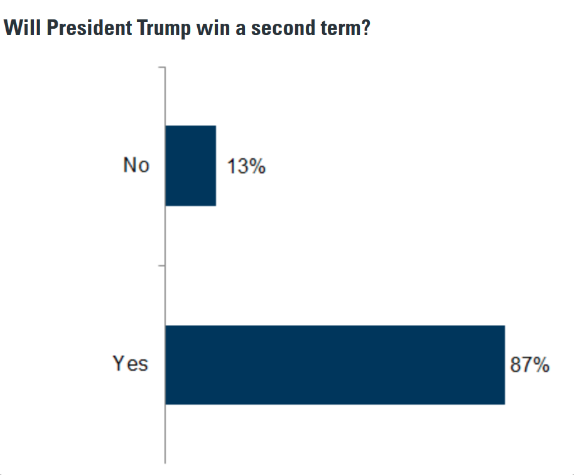
- 250 investors surveyed at Goldman Sachs strategic conference.
- Only 19% think the market can go down this year.
- As we get closer to the election, there are a few things financial markets will really care about, including candidates’ positions on tax and trade policies and regulation.
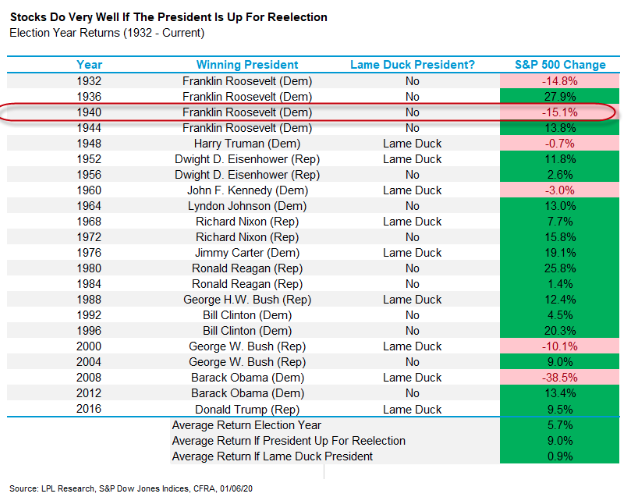
- Historically, stocks have produced average returns of nearly 11% in presidential election years, and the market has risen almost nine out of 10 times.
- The last time that stocks were lower when a President was up for re-election was in 1940.
- Remember that when you hear how 2000 and 2008 were election years that saw big drops.
- Those years had lame duck Presidents not up for re-election.
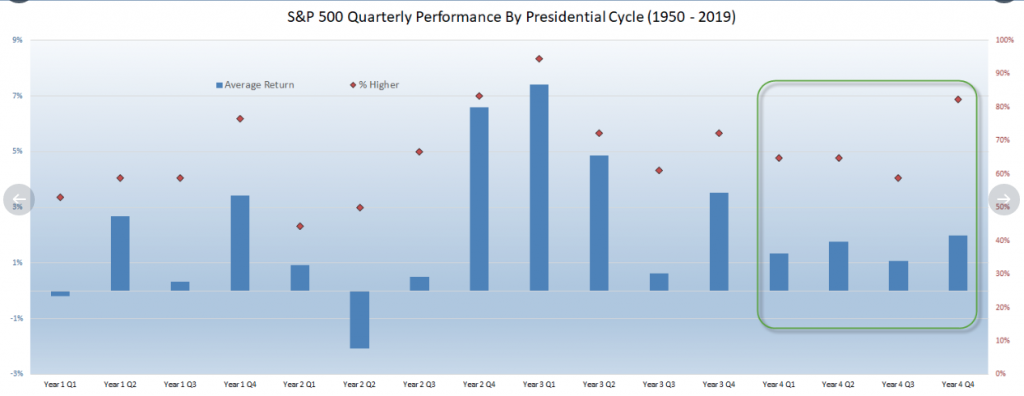
- Stocks tend to do pretty well Q1 and Q2 of a Presidential election year, then little weaker in Q3.
- What really stands out though is Q4 (aka the Presidential election) is higher more than 80% of time, making it one of the most likely quarters out of the 4 year cycle to be higher.
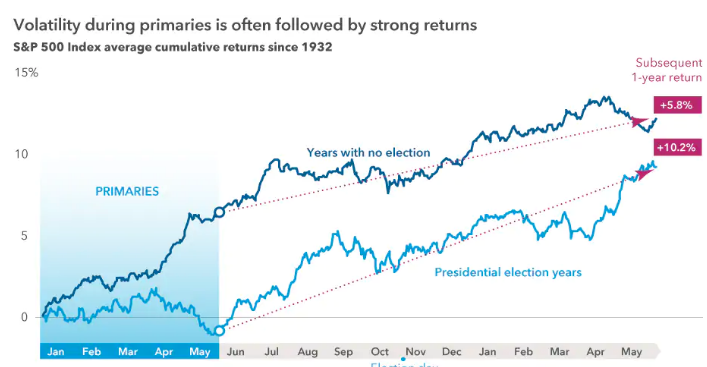
- A look back at every presidential election cycle since 1932 shows that U.S. markets have consistently trended upward after presidential elections, rewarding patient investors — regardless of who occupies the White House.
- “Investing during an election year can be tough on your nerves,” explains Greg Johnson, a portfolio manager with American Balanced Fund®, but it’s mostly noise and the markets carry on. Long-term equity returns are determined by the underlying fundamentals of individual companies.”
- The bottom line: It may be better to stay invested than sit on the sidelines.
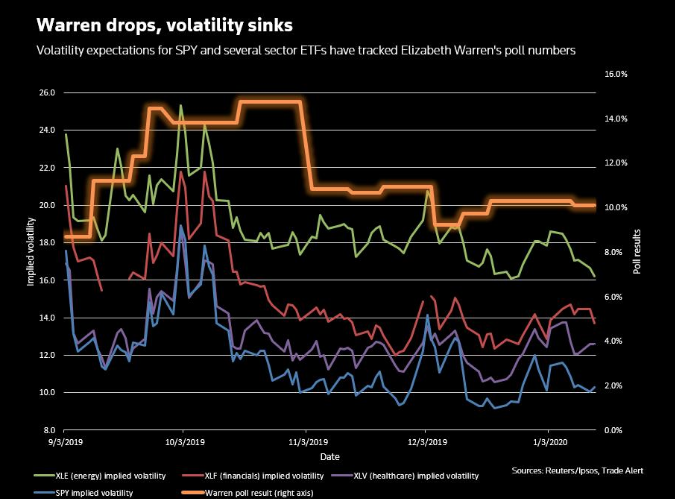
- Traders are less worried about political uncertainty in the run-up to the U.S. presidential election, with former Vice President Joe Biden remaining strong in the polls while Senator Elizabeth Warren has lost ground.
- The decline in expectations for volatility tracks the poll numbers for Warren, who is considered to be among the most left-leaning Democratic candidates. Warren’s standing peaked in October, according to Reuters/Ipsos polling, and has trailed off since then.

- 35 total seats are up for grabs in 2020. Republicans currently hold a 53-47 majority, which sets up Democrats for an uphill battle in order to make significant gains. Of the 35 races, 11 are currently considered “safe” Democratic and 18 “safe” Republican.
- This leaves only 6 “competitive” seats. The last time that control of the House or Senate flipped during a presidential election year was in 1980.
- Much attention will focus on the six races currently deemed to be most competitive and most likely to change party control.
- In our assessment, the seats most at risk in order of their potential to flip are as follows: 1. Alabama (D); 2. Colorado (R); 3. Arizona (R); 4. Maine (R); 5. North Carolina (R); and 6. Iowa (R).
- In the House, Democrats built a solid majority in the 2018 mid-term elections and Republicans would need to net 20 seats for the House to flip.
- Recent Republican retirements point to more potential pickup opportunities for Democrats, a sentiment that indicates rank and file members believe Democrats will maintain their majority after the 2020 election.
- However, Republicans have plenty of pickup opportunities themselves, given that 31 Democratic incumbents are from a congressional district that President Trump won in 2016.

White House officials are scrambling to produce an election year fiscal stimulus plan that is likely to include tax cuts to juice the economy and stock market ahead of the 2020 presidential contest.
- The stimulus would be a way to have an alternate message to the proposals from nearly every Democratic candidate looking to unseat Trump in the November election. Top-tier democrats are proposing massive increases in the size of government, with programs like Medicare for all, coupled with tax increases that will likely fall on the middle class.
- These people say Larry Kudlow, Trump’s director of the National Economic Council, is leading the effort. He and his team are weighing the proposals and they are consulting with members of Congress on the appropriate package of tax cuts. The measures being discussed with Congressional leaders include options like increasing the earned income tax credits, which is a subsidy targeted at lower-income workers with families, and cutting corporate and individual tax rates, these people say. There has also been talk of proposing payroll tax cuts, Congressional sources tell FOX Business.
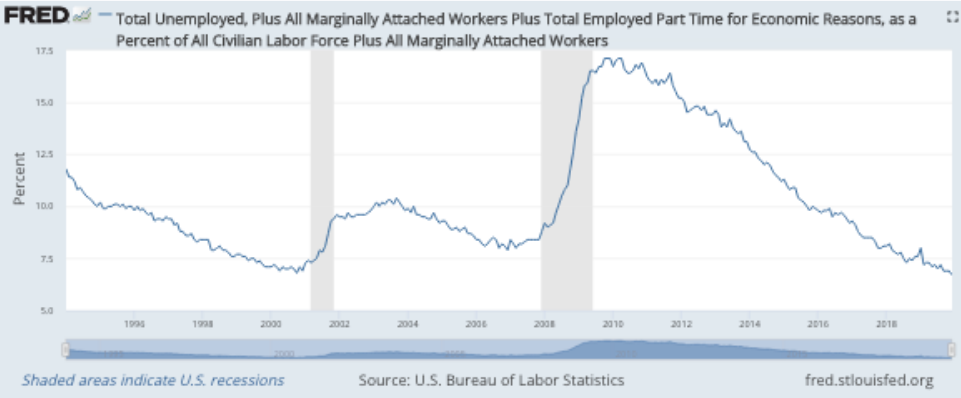
- The U-6 unemployment rate captures a broader swath of workers, those working part time but who want full time positions as well as those who drop in and out of the workforce.
- In December 2019 U-6 dropped to an all time low of 6.7% (back to 1994, when the Bureau of Labor Statistics first started collecting it).
- The prior low was in October 2000, at 6.8%.
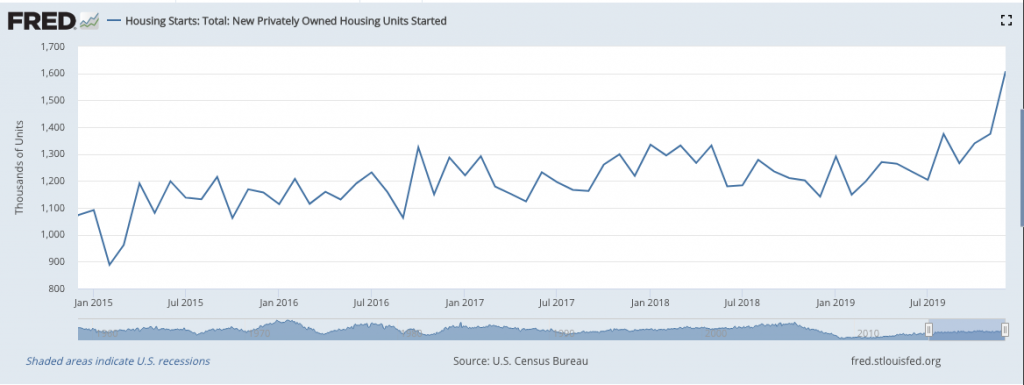
- U.S. homebuilding surged to a 13-year high in December as activity increased across the board.
- Housing starts jumped 16.9% to a seasonally adjusted annual rate of 1.608 million units last month, the highest level since December 2006. The percentage gain was the largest since October 2016. Data for November was revised higher to show homebuilding rising to a pace of 1.375 million units, instead of advancing to a rate of 1.365 million units as previously reported.
- Housing starts soared 40.8% on a year-on-year basis in December. An estimated 1.290 million housing units were started in 2019, up 3.2% compared to 2018.
- Building permits fell 3.9% to a rate of 1.416 million units in December after hitting their highest level in more than 12-1/2 years in November.
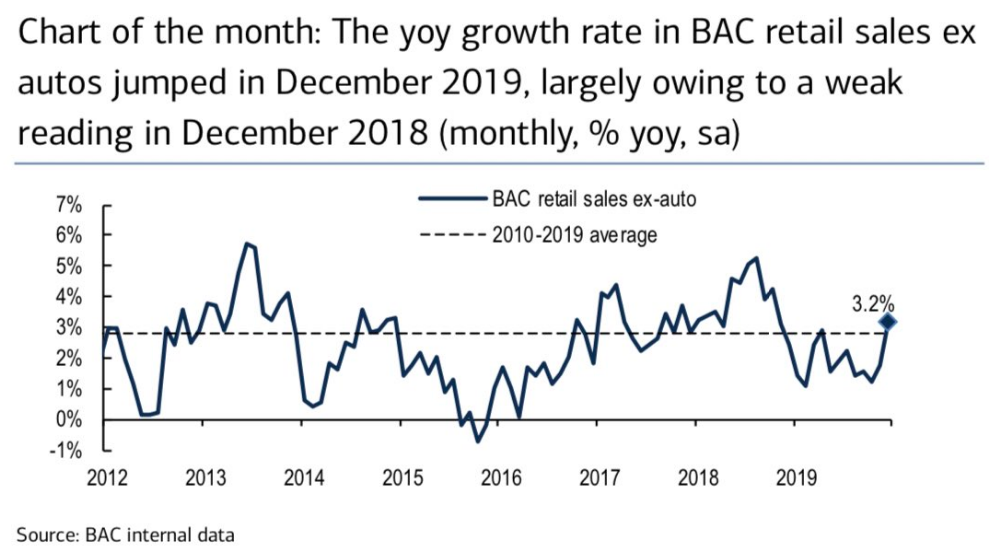
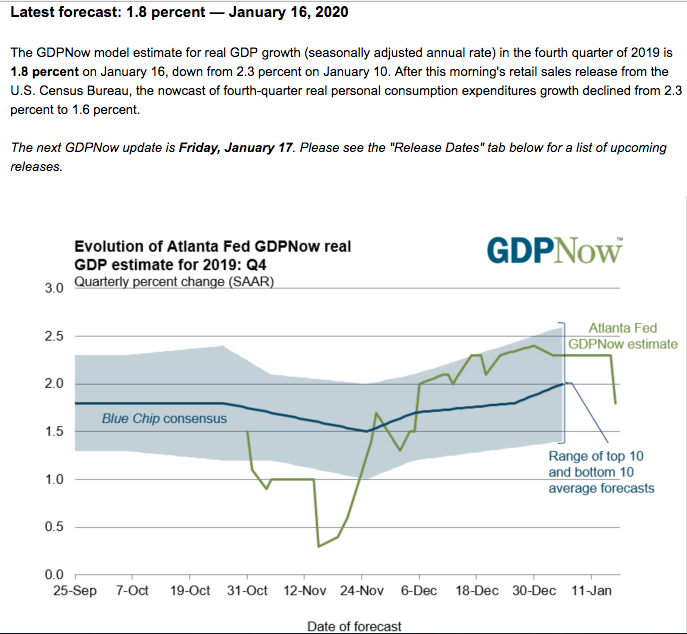
- Patti Domm: “Assuming our forecast is correct, Census Bureau holiday sales, which are defined as retail ex auto & gas for November and December combined, would reveal a 4.7% yoy gain. The consumer was happy to spend at the end of 2019, kicking off 2020 on a good note.”
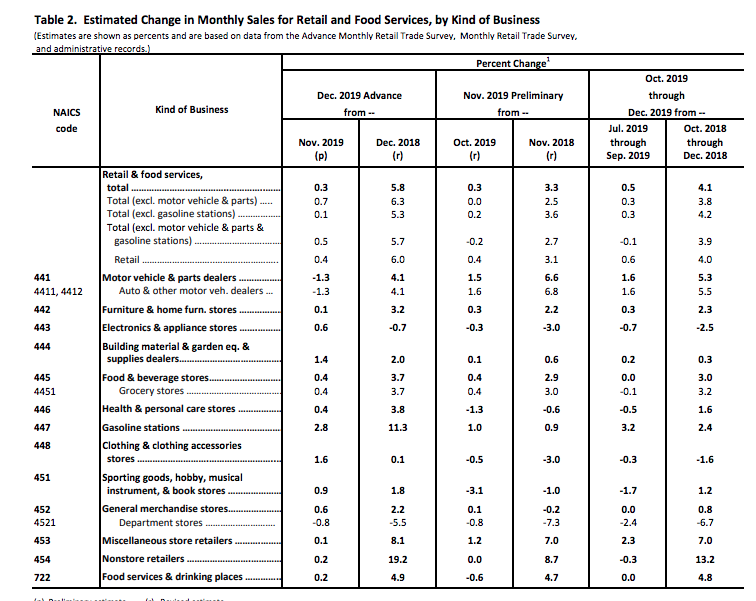
- Retail sales increased 0.3% last month, the government said Thursday.
- If auto receipts are set aside, retail sales rose a robust 0.7% in the final month of 2019.
- For the full year, retail sales climbed a healthy 5.8%, slightly above the average for the past 30 years.
- Internet sales surged almost 20% in 2019.
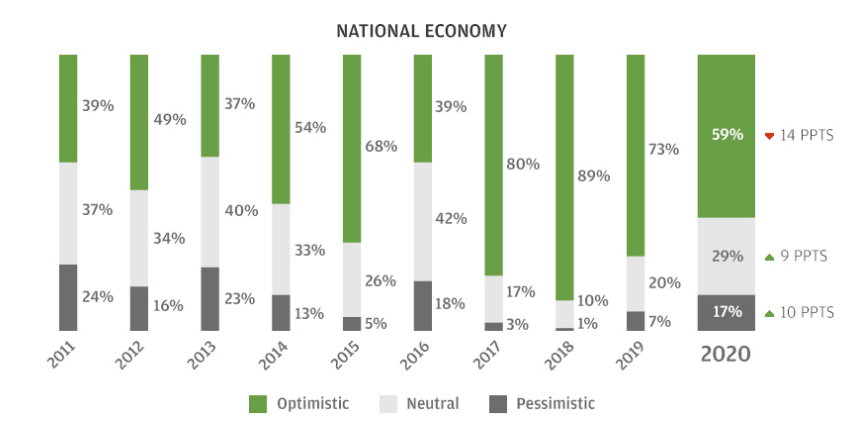
What leaders see: J.P. Morgan Business Leaders’ Outlook
- Going into 2020, business leaders are less optimistic the further from home they look, with the sharpest declines on the global, national and industry fronts. However, if businesses are retreating to caution, it’s an incremental shift; there’s a nearly even split in the increased share of those who are neutral versus pessimistic in their global, national and industry outlooks.
- Indeed, a majority of leaders—albeit a smaller share than last year—are still positive about their own company’s prospects for revenue and profit growth.
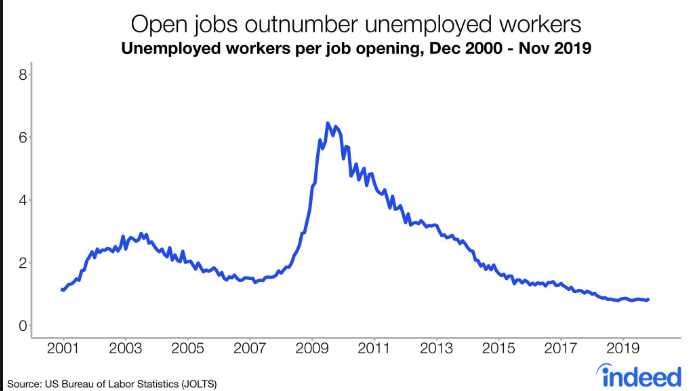
- The good news: job openings outnumbered unemployed workers for the 21st straight month.
- The bad news: the ratio jumped in November to 0.86 from 0.8 in Oct.
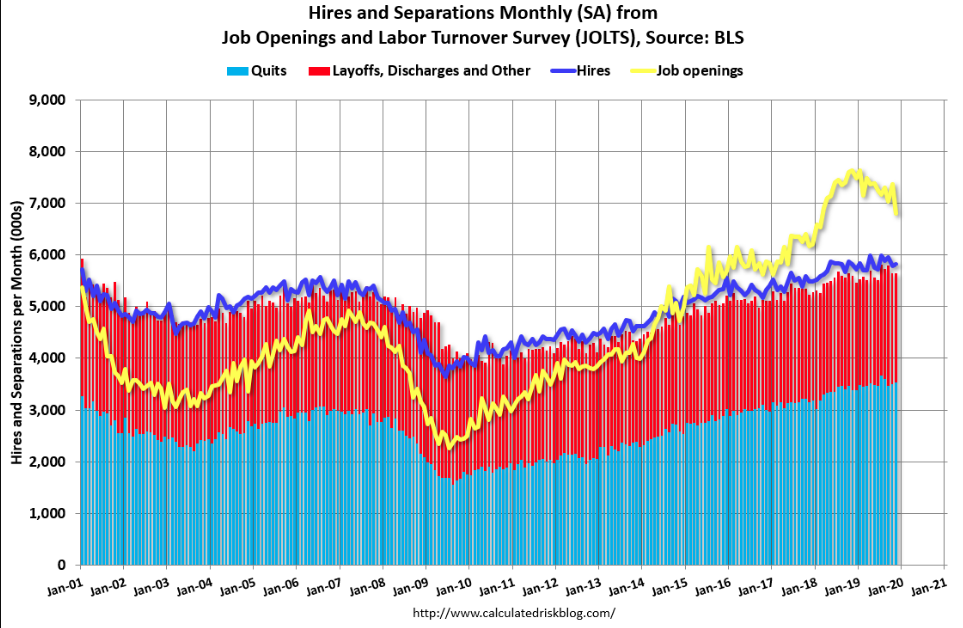
- The number of job openings fell to 6.8 million (-561,000) on the last business day of November, the U.S. Bureau of Labor Statistics reported today. Over the month, hires and separations were little changed at 5.8 million and 5.6 million, respectively. Within separations, the quits rate was unchanged at 2.3 percent and the layoffs and discharges rate was little changed at 1.1 percent.
Business Optimism Jumps: Philly FedManufacturing Index rebounds with increases in new orders, shipments, and employment.
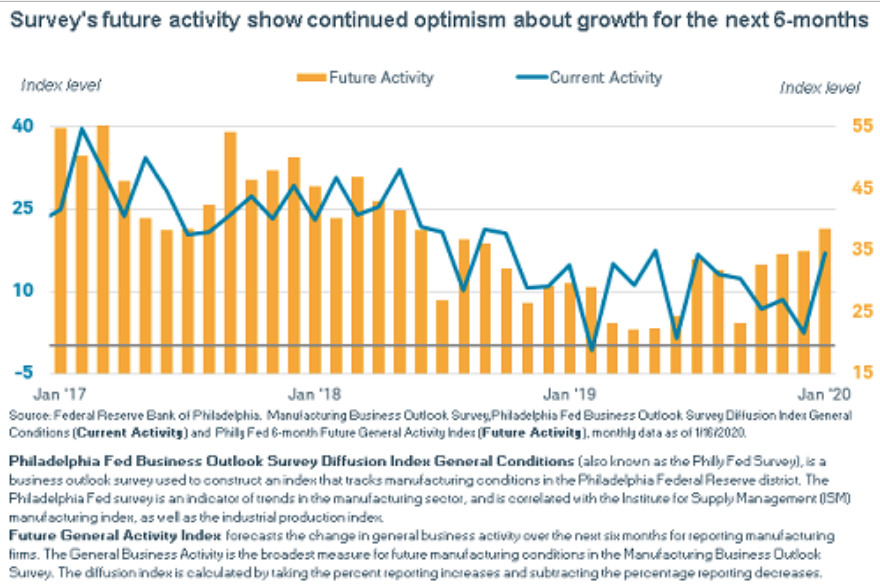
- The diffusion index for current general activity increased nearly 15 points this month, from a revised reading of 2.4 in December to 17.0 (see Chart 1).*
- The percentage of the firms reporting increases (39 percent) was greater than the percentage reporting decreases (22 percent).
- The indexes for current shipments and new orders also moved higher: The current new orders index increased 7 points, and the shipments index increased 8 points.
- The employment index increased 3 points to 19.3. Nearly 28 percent of the firms reported higher employment, while 9 percent reported lower employment. The average workweek index remained positive but edged down 3 points.