
Was the phase-1 U.S./China deal a good deal or a bad deal? Mr. Market hasn’t cared about a deal through all of 2019, which gets overlooked by a great many investors/traders. The main consideration throughout the escalated trade tensions between the 2 economic superpowers has always been… escalation, more tariffs. Anything that would bring about a no-more-tariff resolution is all Mr. Market desired. It’s for this reason, that a deal itself carries little weight amongst investors and holds greater impact on business confidence going forward. Investors have already spoken, given the December 15, 2019 tariff threat was removed, and with the S&P 500 traveling another 5% higher since then.
Moreover and within the phase-1 trade deal, China agreed to purchase an additional $200 billion in U.S. goods over the next two years as part of the “phase one” trade deal. The additional purchases will come on top of the 2017 U.S. export numbers.
The deal stipulates that Beijing will buy $77 billion in additional goods and services in 2020 and $123 billion in 2021 to meet the total $200 billion. China bought $186 billion of U.S. goods and services in 2017.
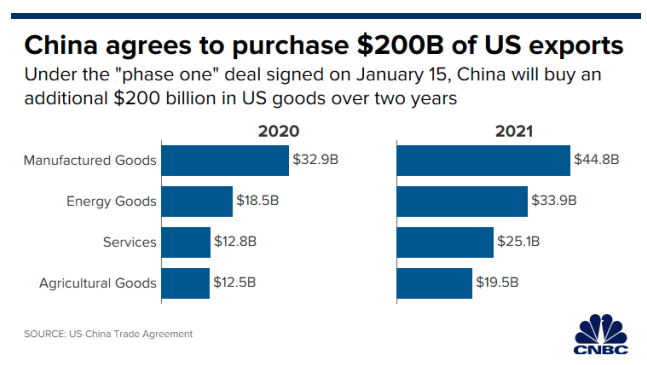
Combined with the new incremental agreement, U.S. exports to China should in theory climb to $263 billion in 2020 and $309 billion in 2021. Either amount would mark a record-breaking acceleration for U.S. exports to China.
As it pertains to the new partnership between the U.S. and China, phase-2 is already being pushed forward into the media headlines. I’m not of the opinion a phase-2 trade deal is probable over the coming 4-6 months. The 2 parties need time to assess the strength and adherence to the phase-1 trade deal. Secondly, the U.S. presidential election cycle will likely play a role in the timing of any additional trade deals. J.P. Morgan is also of the opinion a phase-2 trade deal is unlikely near-term.
JPMORGAN, on Phase Two: “While both sides expressed a desire to make progress in the next round of talks, nothing formal has been planned and these negotiations are widely anticipated to be significantly more challenging.”
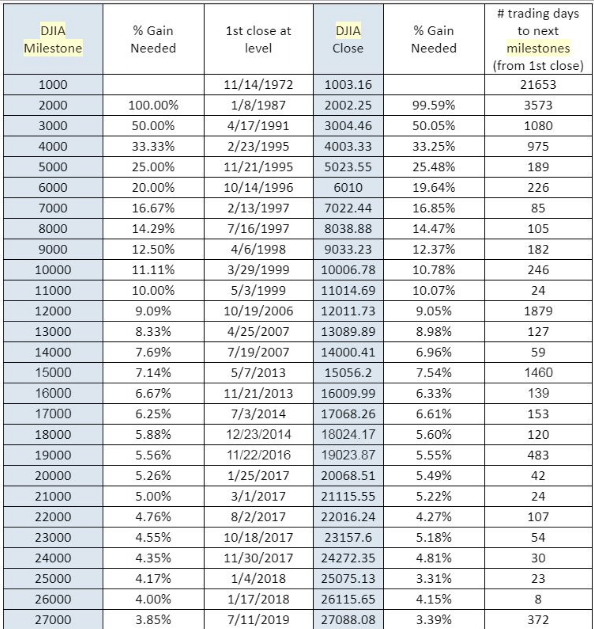
On Wednesday, markets continued to rally with the S&P 500 (SPX) achieving another record high as it marches ever closer to the 3,300 level. The Nasdaq (NDX) actually lagged its peer indices while the Dow Jones Industrial AVerage (DJIA) actually led the major indices with a .31% gain on the day, closing above 29,000 for the first time.
The gain marks the 40th trading day since its last milestone on Nov. 15, and the fastest such ascent for the Dow since January of 2018 when it took only eight trading sessions to close at 26,000.
There are seemingly a good number of comparisons being made from today’s market breakout and seemingly endless rally with that of January 2018. From equity market hedge fund and CTA positioning to the S&P 500’s ascent and distance from its 200-DMA, market participants are threatening to threaten a self-fulfilling prophecy of a February 2018 market event. Many investors recall the January 2018 melt-up that found the S&P 500 some 12% above its 200-DMA and before the BLS Nonfarm Payroll report showed an outsized wage inflation number that spooked investors into believing that inflation may prove to surge beyond the FOMCs target rate expectations/forecast. The S&P 500 fell roughly 5% intraday on February 5th, when the BLS Nonfarm Payroll report was released and after a significant rally in the market.
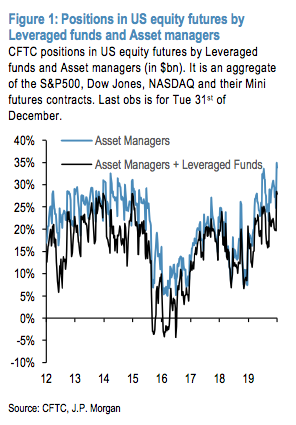
Regarding the present market melt-up comparisons with that of 2018, here is what J.P. Morgan’s Quant team analyzed and concluded:
- So overall it looks like speculative institutional investors increased their equity exposures significantly over the past two months, implying that their current equity exposures are not far from their previous January 2018 levels. As a result, equity markets, particularly US equity markets, look vulnerable to negative surprises. But this does not means that a February correction similar to that seen in February 2018 is looming. As we had highlighted at the time, the February 2018 correction was rather technical in nature and had at its core unprecedented losses and forced position shedding by CTAs and other momentum traders. This is because, at the time, not only had momentum signals reached extreme territory across all major equity futures but also across a wide range of asset classes ranging from the euro to oil prices to the 10y UST. So as mean reversion signals kicked in at the end of January 2018, pure momentum traders were hit on multiple positions. As a result they were forced to exit those positions and suffered the worst 4-day loss in their history during February 2018.
- At the moment we don’t have such a backdrop. The extremities in momentum signals are concentrated on US equity futures, rather than a wide range of asset classes. So an equity correction over the coming weeks, similar in nature to the February 2018 correction i.e. driven by CTA position unwinding and a reversal of momentum trends across a range of asset classes, does not look likely.
- This does not mean that an equity correction over the coming weeks is not possible. It is surely possible given how high the equity exposures by the above institutional investors are at the moment. But for this position vulnerability to manifest itself into an equity correction a trigger is required, such as a progressive candidate winning the Iowa primary on Feb 3rd or a significant negative macro surprise, rather than solely caused by position driven momentum reversal similar to that seen in February 2018.
Based on equity market positioning across multiple asset classes, it is clear that J.P. Morgan’s Quant team doesn’t believe the total positioning has a reasonable probability of exacting a February 5, 2018-like market reaction. Additionally, the team led by Marko Kolanovic discusses a necessary catalyst to produce any type of correction. A catalyst could come in many different forms, some of which are likely not even on the radar of most investors/traders. I don’t think a single person back in February of 2018 believed the wage inflation data would spark such a severe reaction from markets, but it did.
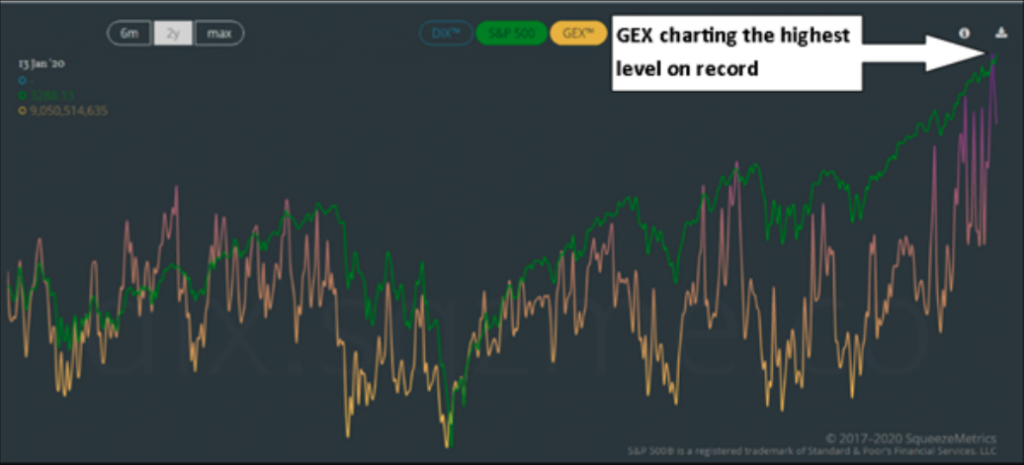
As records are being set, seemingly daily in the markets, hedging activity has shown up in some areas of the market while other areas identify limited hedging activity. On Thursday and ahead of a crucial economic data report from the Census Bureau, traders also recognize that Friday is options expiration, which could force investors to reshuffle their portfolios around the event. Gamma exposure (GEX), which is a dollar-denominated measure of option market-makers’ hedging obligations, recently hit an all-time high according to a chart by SqueezeMetrics.com. Again, just another example of record setting markets.
The website notes that “when GEX is high, the option market is implying that volatility will be low. When GEX is low, volatility is high, and while we expect a choppy market, further losses are unlikely.” High levels in the GEX have historically coincided with short to intermediate-term peaks in equity prices, particularly around option expiration events, which force portfolio managers to reshuffle the deck.
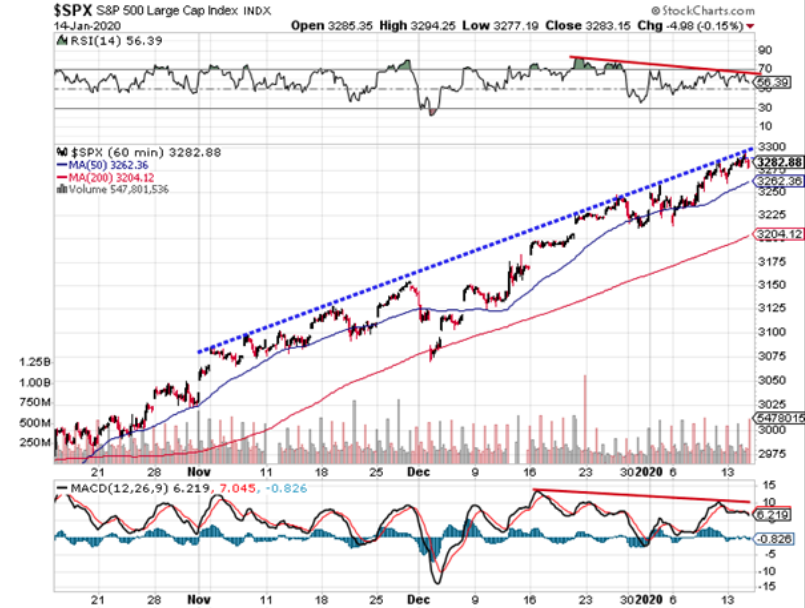
From a technical standpoint, the market continues to show strong breadth, but it is also found with certain divergences that have commenced. Looking at the hourly chart of the S&P 500, the index continues to grind along trendline resistance that has maintained a steep pace over the past couple of months. Momentum indicators continue to show bullish characteristics following the advance, but this does not mitigate the prospect of a near-term pullback as investors digest the gains from the past few months. Negative momentum divergences can still be picked out on the chart, suggesting waning buying pressures.
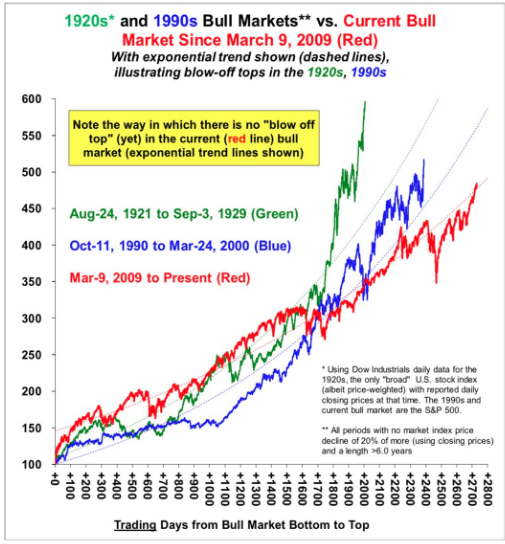
A great deal of market sentiment will remain aligned with the current market trend and belief that an earnings rebound is afoot for U.S. corporations. Thus far, the bank reporting season is proving out this positive sentiment. With the market looking forward to the release of Morgan Stanley’s Q4 2019 results and post the phase-1 trade deal signing, equity futures have found the S&P 500 tipping over the 3,300 level. Stifel Nicholaus offers the following with regards to the current blow-off top in markets, as another milestone is achieved:
STIFEL: “The current bull market “is more linear than the 1920s and 1990s bull markets, and is just starting the ‘blow-off top’ stage ..”
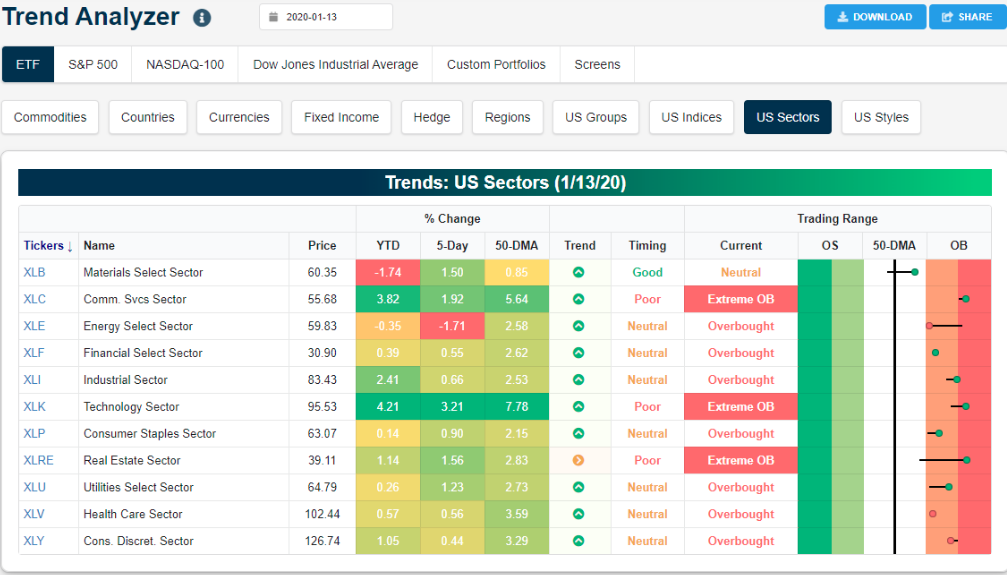
No matter where or what we look at and as it pertains to market conditions, it’s clear that markets are overbought and found with extreme sentiment readings. Every S&P 500 sector ETF is back above its 50-day moving average, and 10 of 11 are overbought relative to their 50-DMAs, according to the Bespoke Investment Group Trend Analyzer.
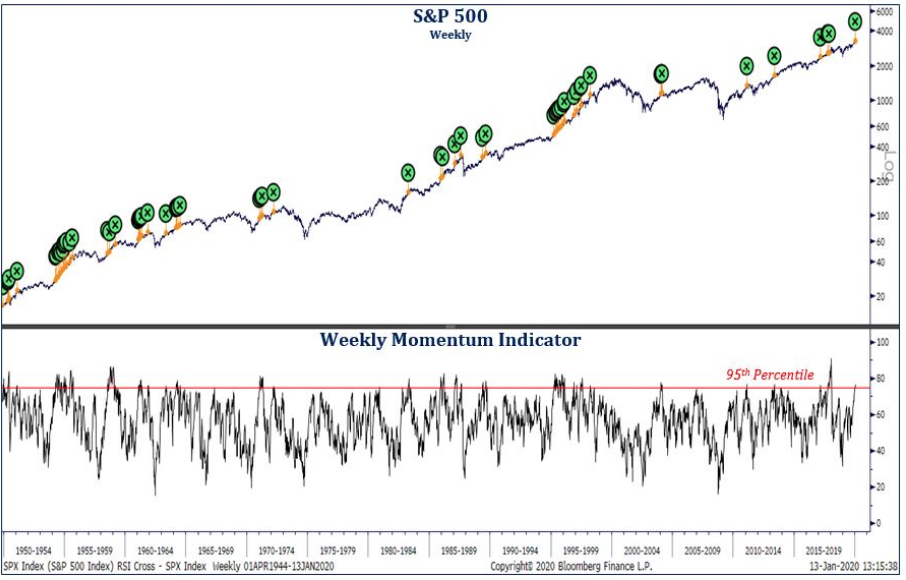
Additionally, it is historically rare to see the S&P 500 weekly momentum this overbought. Consolidations often occur from this condition, but more often than not, the longer-term trend ultimately resumes. It’s with this in mind that traders are invited to conclude on a market outlook for the year, rather than for the interim. While the market may prove to top near-term, a macro-fundamental outlook can breed confidence for which to “buy the dip” ahead. (Chart from Strategas)
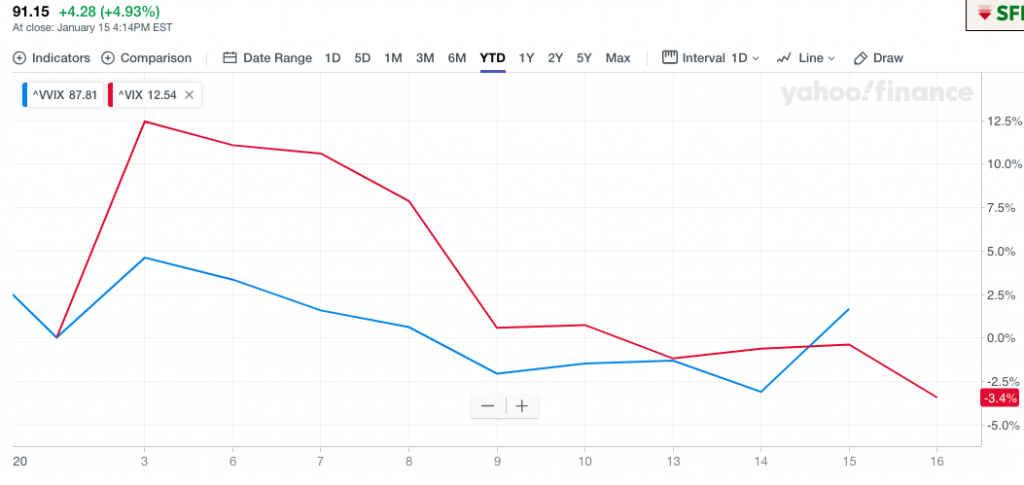
From sector ETF overbought conditions, new record index highs on the and momentum high indicators, the records just keep on coming in early 2020. It’s just a matter of time before the market makes a decision to digest some of the previous months’ gains. Protection has been relatively cheap for those who hedge via the VIX complex and with VIX options. With the S&P 500 continuing to achieve record highs through the first couple of weeks in the New Year, VVIX has remained in a tight range and somewhat disconnected from its usual price correlation with the VIX.
While shorting the Spiders S&P 500 index ETF (SPY) has proven out of favor during the 3-month+ rally in the market and into the New Year, protection against a market correction is being bought by way of VIX call options. The following chart identifies the aforementioned tight trading range in VVIX (blue line) and the surge in the VIX call options (VVIX up more than 4 points) on Wednesday, while the VIX (red line) only rose .03 on the day:
This is a very nervous time for traders, despite what we’re seeing in the overall index moves. Protection is often found in demand and as a signal of a near-term top in markets, although we have to recognize overbought market conditions can remain for an extended period of time. Protection bought since November would have proven nothing more than a tax on portfolio profits. I can recall hearing conversations on Twitter whereby traders were calling for a top at 3,100, and buying protection. Then protection was bought at 3,200… and now at 3,300.
Traders have kept VIX call options as a primary hedge through the duration of the melt-up phase. With the VIX at 12, VVIX usual holds a value in the high 70s to low 80s, but it is presently at 91.15 and indicating protection buying via VIX call options remains front of mind and a prominent means for hedging amongst traders.
As the 2020 calendar now forces a focus on the back half of January, investors/traders are also forced to recognize the strength of the market’s rally through the lens of drawdowns, which have been found lacking for any single day.
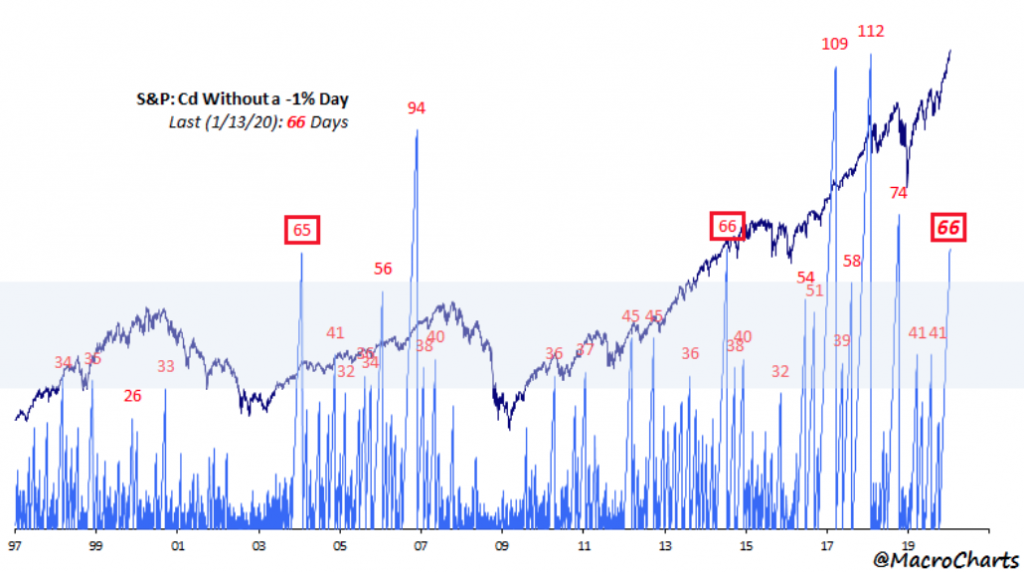
The MacroCharts depiction above identifies that we have now traveled 68 trading days without a 1%, single day drawdown in the S&P 500. We haven’t quite achieved the streak accomplished in 2018 or 2017’s 112-day streak without a 1% drawdown, but it’s quite the run nonetheless. What the chart identifies is that the underlying market breadth has been robust and past streaks of days without a 1% drawdown suggest we may still yet have room to run in the market without such a daily drawdown.
It remains to be seen what could trip up the market in January, if anything and with seemingly strong reports from the banks thus far. When we look at the currently market strength in the early weeks of January, we can do so through the lens of the January Trifecta, as termed by the Trader’s Almanac.
- So far our January Trifecta is two for two. Our First Five Day (FFD) early warning system came in positive up 0.7% on January 8 following up on a positive reading for our Santa Claus Rally (SCR) on January 3. The January Trifecta would be satisfied with a positive reading from our January Barometer (JB) at month’s end.
- The Incredible January Barometer: Only 11 Major Errors in 82 Years runs through the reasons behind the efficacy of January. The passage of the Twentieth “Lame Duck” Amendment to the Constitution in 1933 created the January Barometer. The January Barometer compares results along with the full year results, the following eleven months results, and the subsequent twelve months results to all other “Monthly Barometers” using the Dow Jones Industrials, the S&P 500 and the NASDAQ Composite
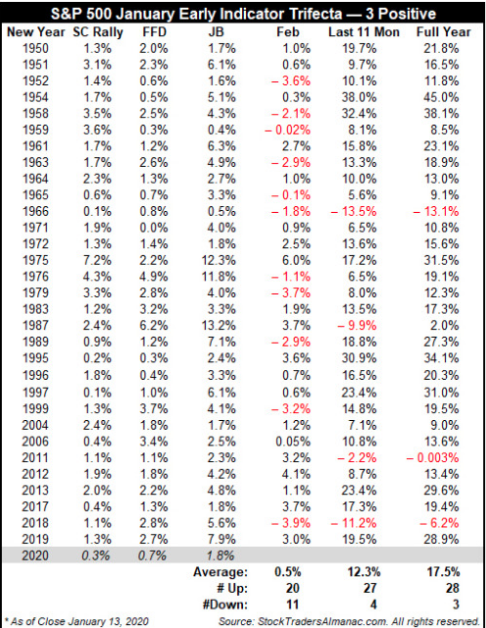
- The best case, most bullish scenario is when all three indicators, SCR, FFD and JB, are positive (in table below). In 31 previous Trifecta occurrences since 1950, S&P 500 advanced 87.1% of the time during the subsequent eleven months and 90.3% of the time for the full year. However, a January Indicator Trifecta does not guarantee the year will be bear or correction free. Of the four losing “Last 11 Mon” years, in the table, 1966, 1987 and 2011 experienced short duration bear markets (2011, S&P 500 –19.4% peak to trough). In 2018, S&P 500 retreated 19.8% from its September high close to its December low close.
It’s all well and good when it comes to identifying current market conditions and what investors/traders are doing with their positioning as markets achieve all-time highs, but to what end. A long-term outlook is where the greatest investor/trader confidence is found. Anything short of a long-term outlook is largely guess work, as I refer to the previously outlined VIX call option hedging activity that has proven a portfolio tax over the last few months.
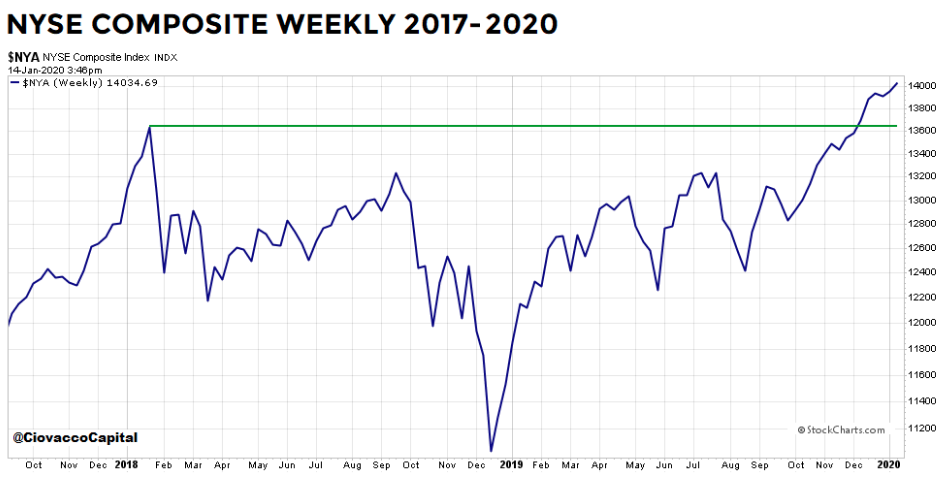
With the longer-term outlook front of mind, markets will simply follow earnings over time, and those earnings are expected to grow in 2020 and after what may prove to be a flat earnings year in 2019. To that point, it’s no wonder the market topped in 2018 and has consolidate from that point and through the first 6 months of 2019, before breaking out. The market being a forward-pricing mechanism, it corrected for time and price in late 2018 and before breaking out in late 2019 in anticipation of the next 12-month forward-looking earnings rebound. A char of the NYSE identifies the consolidation and breakout period that aligns almost perfectly with the earnings reality from 2017-present.
Given that Q4 2019 earnings season is underway, when we look at estimates for the Q4 2019, FactSet is forecasting a 2% decline in earnings YoY. While this may seem disconnected from the S&P 500’s bullish trend, we reiterate the forward-looking mechanism that is the S&P 500 and major indices. Nonetheless, we also aim to draw out a more detailed probability for earnings given the historic earnings beat rate.
According to FactSet data, over the past five years on average, actual earnings reported by S&P 500 companies have exceeded estimated earnings by 4.9 percent. During this same period, 72% of companies in the S&P 500 have reported actual EPS above the mean EPS estimate on average. As a result, from the end of the quarter through the end of the earnings season, the earnings growth rate has typically increased by 3.6 percentage points on average (over the past five years) due to the number and magnitude of positive earnings surprises.
It’s with the average beat rate in mind that Bank of America’s Savita Subramanian and colleagues offer the following in recent notes to clients:
“We expect a 2 per cent beat” in fourth-quarter earnings. Margin compression fears were “overblown.
Following five straight quarters of declines, Bank of America’s corporate misery indicator “ticked up” in the latest quarter.The indicator includes unit sales, selling prices and input costs and it “has been strongly correlated with, and sometimes leads, the profits cycle, and suggests that corporate profitability should start to bottom or improve from here.”
Morgan Stanley’s Michael Wilson said he too is expecting a 2% earnings beat in the fourth quarter which will support the view that the “earnings recession” has ended, at least for large caps.
“Furthermore, with progress made on trade and Brexit, recession fears extinguished and a strong stock market, companies are likely feeling more optimistic.
All of this is supportive of stock prices, but the question is have stocks run too far?”
As investors/traders, we don’t know when the market top will be achieved and, furthermore, we shouldn’t stress over timing a top. Following the earnings over time, after all, that is the market has proven to follow. And last, but certainly not least, is a reminder based on a historic stat from Ryan Detrick of LPL Financial: “Remember, if the economy isn’t in a recession or heading into one, the S&P 500 hasn’t been lower during an Election Year going clear back to WWII.


