
I can recall watching the S&P 500 (SPX) on Thursday as it retraced much of what it had gained from the previous snap back rally. As the market worsened throughout the day, it became increasingly clear that sellers were having a difficult time maintaining pressure on the market.
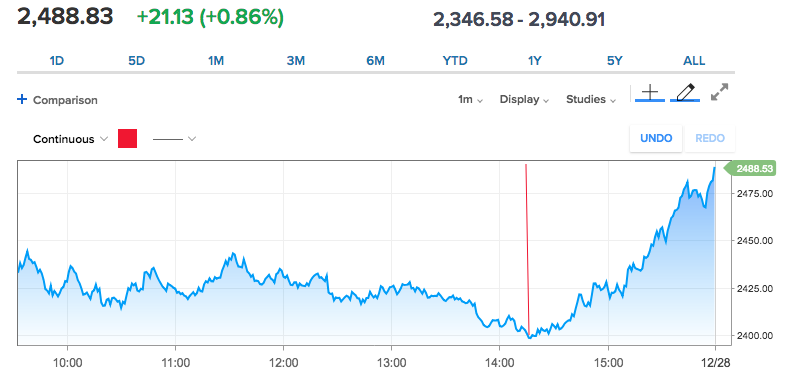
A quick look at the intraday SPX chart above denotes the steady decline intraday, but it is littered with bouts of “buying the dip” buoyancy. As I watched the tick by tick on SPX, around 2:30 p.m. (red vertical line) EST it became more apparent that if the SPX could hold the 2,400 level that would be a near term bullish sign for investors. Yes, SPX did break through 2,400 briefly to hit an intraday low of 2,397, but like a pillow supports one’s head when resting/sleeping support levels have some give before they solidify. And that is what we saw in the SPX yesterday, as buyers quickly came in and “bought the dip”.
It was quite the rally that found the SPX down roughly 2% on Thursday before rallying and closing at the highs of the day, up 21 points or .86% to 2,488. All three major indices rallied on the day with the Dow leading and closing higher by 1.14% on the day.
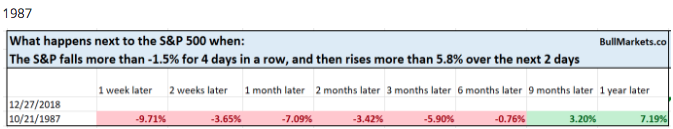
The severity of the market downturn over the last several weeks is extremely unique and definably concerning. From 1927 – present, there has been only 1 other case (other than right now) in which the S&P fell more than -1.5% for 4 days in a row, and then went up more than 5.8% over the next 2 days. That one time occurred in 1987. (See table below from Troy Bombardia)
While we can offer that fear of future economic weakness and corporate earnings weakness are the underlying reasons for the Q4 2018 market swoon, many, many market strategists believe this creates a good opportunity for investors.
“Signs of capitulation by institutional investors are creating a window of opportunity for equity markets into Q1 assuming the Fed reacts to market stress,” J.P. Morgan analyst Nikolaos Panigirtzoglou said in a note to investors on Friday.
To the extent that the current market correction is blamed on emotional fears and concerns over the future economic outlook, this aspect is extremely unique due to the fact we will likely finish 2018 with a 3% GDP growth, above potential growth. We will also witness this economic growth deliver 20% S&P 500 corporate earnings growth. This is a first time whereby these two statistical data points combine to elicit a double digit decline in the Q4 period since 1927.
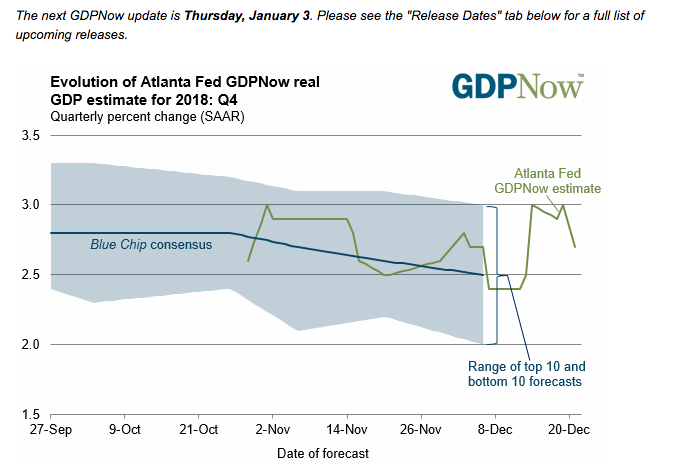
As shown above, the Atlanta Fed’s GDPNow forecast for GDP is expressing a 2.7% rate of growth. The forecast has fluctuated throughout the quarter from 2.4% to 3% as the economic data rolls out weekly.
Another variable that is unique to state of the economy that has produced the longest bull market ever is the strength of the labor market. On Thursday, we received further evidence of this strength through weekly jobless claims. Initial jobless claims slipped to 216,000 in the seven days ended Dec. 22, from a revised 217,000, the Labor Department said Thursday.
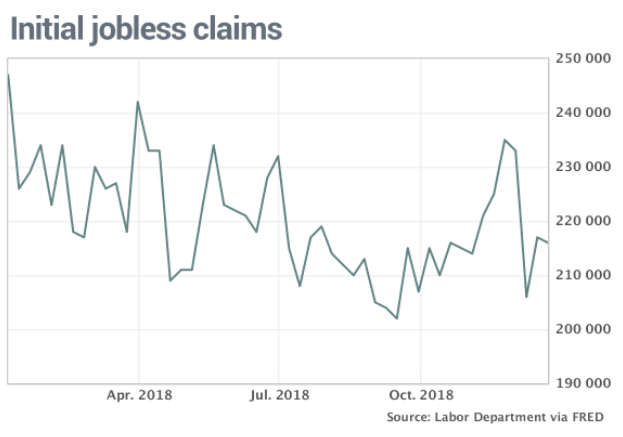
Claims are not as low as they were in September, but they remain near a 50-year bottom. The U.S. has added an average of 206,000 jobs a month through the first 11 months of 2018, the fastest pace in four years. Next week the government is scheduled to report how many jobs were created in the final month of the year with the release of the Nonfarm Payroll report.
Unfortunately, even as the labor market has proven to be a bright light within the overall economy, the equity market fears have proven to dampen consumer confidence of late. The confidence Americans feel in the economy fell for the second month in a row and touched the lowest level since last summer. The consumer confidence index dropped to 128.1 this month from a revised 136.4 in November, the Conference Board said Thursday.
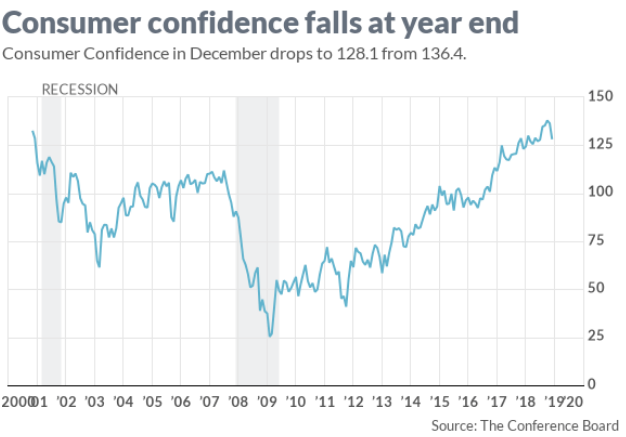
Within the Conference Board’s report lay the bigger worry concerning the consumer. The future expectations index, what Americans think the economy will look like six months from now, dipped to 99.1 from 112.3. That’s the lowest reading since October 2016. Between the seemingly endless trade feud between the U.S. and China, the Fed in rate hike mode and a stock market correction, consumer confidence is waning.
Stock market drops can have a poisonous affect on the economy in two ways. First, it can have a negative affect by simply reducing household wealth on paper. Even when that doesn’t dent incomes, it can cause people to trim spending, which otherwise reduces revenue for corporations. Furthermore, businesses facing higher financing and refinancing costs might also cancel investment plans or even trim headcount to maintain current levels of profitability. It’s the proverbial self-fulfilling prophecy whereby a fearful stock market that leads to a swift market correction, with no concurrent reasons to profess such fearfulness, produces an ailing economy. So for all those permabears constantly beating the extreme debt level drum, that’s not what has caused the current market conditions, not at all; it’s simply the fear of past market crises projected onto the market of the day.
As we explore the impacts of fear FOR the market and the proverbial self-fulfilling prophecy that can create an ailing economy we look toward a recent research report from Veneta Dimitrova, senior U.S. economist for Ned Davis Research. Dimitrova estimates that a 10% decline in inflation-adjusted household financial wealth in one period subtracts about 0.5% from real consumption growth in the subsequent period. Then there’s the psychological fallout from a market swoon that can affect people and firms not directly exposed to price movements in equity or debt.
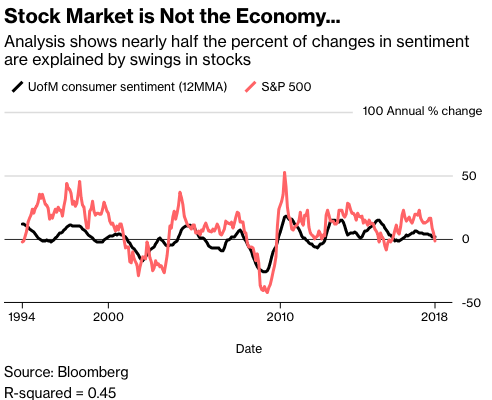
Consumer confidence and stocks are both whipped around by views on the economy, and the correlation between the two is notable. A mathematical process for calculating how much one set of data influences another shows that nearly half the percent changes in the sentiment gauge are explained by swings in stock prices over an annual basis.
Moreover, according to Mayank Seksaria, chief macro strategist at Macro Risk Advisors, markets are divorced from the economy. He plots the S&P 500 against the Institute for Supply Management Manufacturing PMI, which standing above 59, still fits strongly in growth territory. The comparison shows the equity market is the most disconnected from the economy in 30 years.
As we continue to mention in our daily market dispatches, the market has completely detached from the economy. We can see that from the economic data that pours out weekly.
- Early reports on Christmas suggest consumer spending is holding up — and consumer spending is still 70% of economic output. MasterCard reported that holiday spending growth was the best in six years, while Amazon.com said it had record unit sales, but didn’t disclose whether that meant big revenue gains
- Real-time crunching of the latest economic data from the New York and Atlanta Federal Reserve banks suggest that fourth-quarter growth kept up an annual rate of around 2.6%, which is still above the clip that most economists think is a sustainable, long-run average. U.S. growth will likely slow next year, but not disastrously, and not to any level below the 2.2% average we’ve seen annually from 2010 to 2017.
- Inflation is weakening, if anything, as oil prices plunge to $54 a barrel on international markets and about $45 for West Texas crude, down about 30% this year. Gasoline prices are under $2 a gallon in parts of the Midwest again, and futures prices point to a 2019 sag for natural gas that powers much of America’s heating and electricity.
- And while wage measures are improving, there’s still not much about them that points to overheating. The 3.1% wage gain workers got over the last 12 months is healthy, but not so healthy that it points to bidding wars that will soon be reversed. In fact, it’s still below peaks the U.S. saw in the late 1990s and mid-2000s, making Moody’s assessment that the economy is in mid-cycle, with little recession risk over the next year, perfectly defensible.
I can go on and on and on denoting points of strength or favor within the economic data, but fear can be quite the gripping emotion, much like love. As fear is seemingly driving current markets and producing underlying market volatility, it’s always a good idea to maintain a long-term perspective and participation strategy. Today’s market is not going to look the same as the future market. In an algo-centric/programmed trading marketplace, individual equities and indices can move awfully fast.
Thursday’s market moves, like the current market conditions proved another anomaly for the market that reinforces how prolific algorithmic trading has become. The Dow Jones Industrial Average (DJIA) ended Thursday’s trading session more than 250 points higher after enduring a 600-point intraday drop. On Wednesday, the Dow logged a 1,086.25-point gain, its biggest single-day point rally ever.
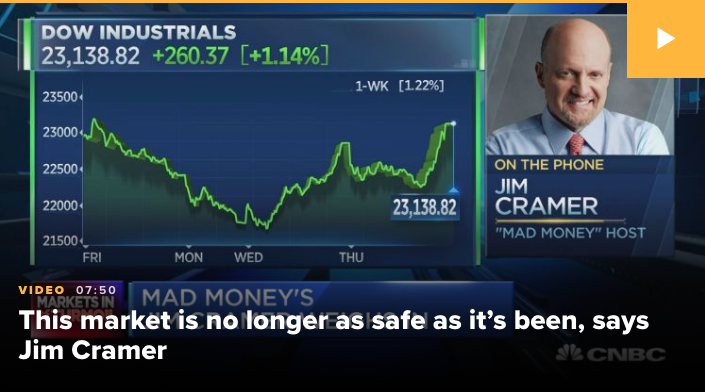
“It is not a market for the squeamish,” Cramer, host of Money,” said in an after-hours special on CNBC. Still, he said he sees “some positives.”
Excessive pessimism among investors and the broader market being oversold, Cramer stated, are conditions that tends to create bargains in individual stocks of top-notch companies.
“This market is no longer as safe as it’s been, because you don’t like when it goes up 1,000, then down 800,” Cramer said. “That’s not healthy.”
While the market has rebounded since the largest Christmas Eve sell-off in market history (another unique market condition to this bull market cycle), the path forward remains uncertain, as fear over future corporate earnings remains front of mind with investors. The latest American Association of Individual Investor survey identifies just how bearish investors have become.
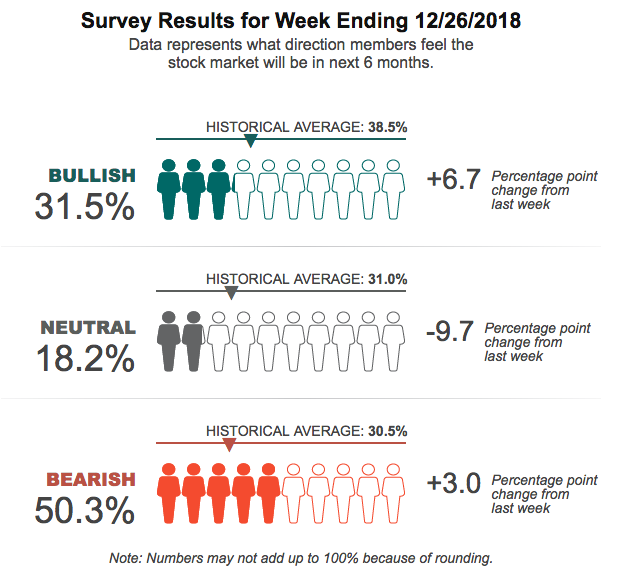
“Pessimism is above 50% for the first time since 2013, while neutral sentiment is at an eight-year low. Both readings are highly unusual. Plus, this week’s special question asked AAII members whether the Federal Reserve should continue to raise interest rates.”
What I can say and what we can all see in the market currently is the proverbial “fork in the road”. Are the lows in and will we retest the all-time highs once again, create a new high perhaps? It’s a binary question most investors are presently considering. With that question posed, the greater likelihood is for the market somewhere pointed higher than where it presently rests at the end of 2018. The economy and corporate earnings will ultimately determine where the market heads and while there is much consternation for both of late, we’ll have a great deal more information to formulate probabilities once Q4 earnings and guidance are issued come late January 2019.


