
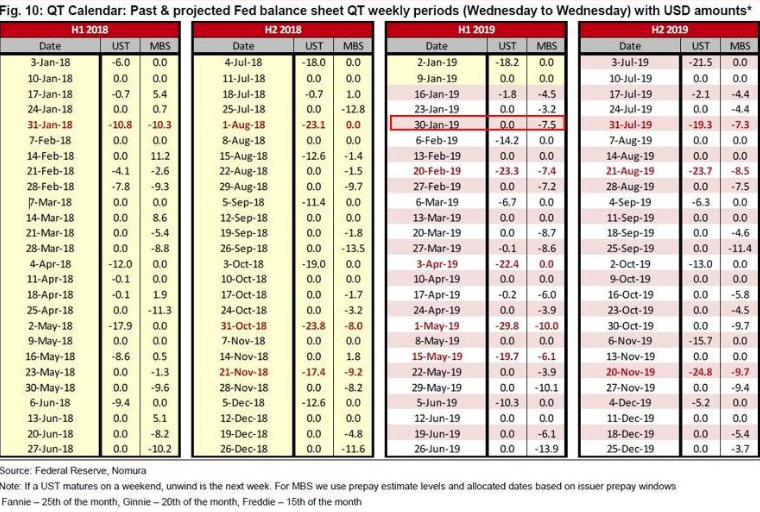
There is at least one key component of the market rally that will likely come into play today, liquidity. Today marks yet another quantitative tightening (QT) day for the FOMC as it continues to reduce the size of its balance sheet. The calendar of QT days is depicted below.
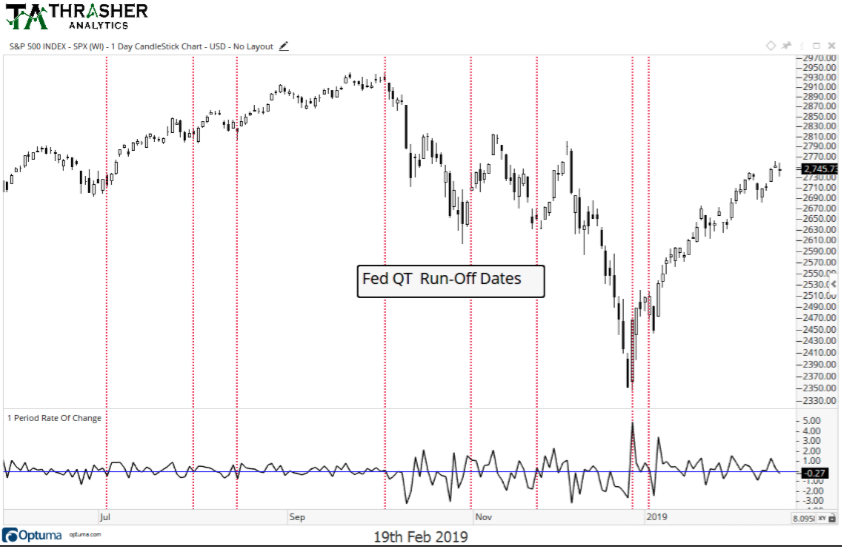
It’s a common and widely accepted understanding that as the FOMC reduces its balance sheet; this serves as a sentimental stimulant for draining liquidity out of the market. We’ve come to find market participants promoting this sentiment even in the wake of the seemingly disconnected bond-equity correlations of late. Nonetheless, we can review the impact from QT days on the S&P 500 from a composite chart of the S&P 500 (SPX) below, provided by Thrasher Analytics.
On a day where QT will be pervading or lurking beneath the surface of the equity market’s activity, the Fed will also be releasing its minutes from the last meeting at 2:00 p.m. EST. The release of the Fed minutes will likely cause a certain adverse reaction from the market and post a litany of Fed speeches of late.
New York Fed President John Williams on Tuesday said he was comfortable with the level U.S. interest rates are at now, and sees no need to raise them again unless growth or inflation shift to an unexpectedly higher gear.
In an interview with Reuters, Williams said he felt rates had reached his current view of a lower “neutral” level, with growth and unemployment leveling off and inflation, if anything, a bit weaker than hoped for. Asked if it would take some sort of shock to resume rate increases, he said it would require one or more of those factors to surprise to the upside.
“I don’t think that it would take a big change, but it would be a different outlook either for growth or inflation” to return to hiking rates, Williams, one three Fed vice chairs and a key voice on rate policy, told Reuters.”
Along with its rate-hike holiday, policymakers are currently finalizing plans on how they would end the reduction of their balance sheet, which includes holdings of bank reserves bulked up in part by the Fed’s need for cash to buy bonds to halt the global financial crisis a decade ago. Williams estimated the so-called balance sheet roll off could end when bank reserves get to “maybe $1 trillion of reserves or somewhat more than that,” about $600 billion less than current levels.
Not to belabor the subject of ending the Fed’s balance sheet run off program, but Cleveland Fed President Loretta Mester also supports ending the balance sheet run-off this year. After her speech in Newark, Del., Mester backed ending the balance sheet run-off this year, according to Bloomberg. Mester also said there was no need to “taper” the balance sheet runoff before halting the program.
As it pertains to the market on Wednesday, the focus is very much going to be on the verbiage within the Fed minutes and how they are looking at and discussing quantitative tightening. If the market finds the discussion of QT favorable, indicating a near-term end to QT, we could witness a breakout to the upside, but if the market doesn’t find QT dialogue amongst the voting members favorable it could make for an ugly afternoon in the markets.
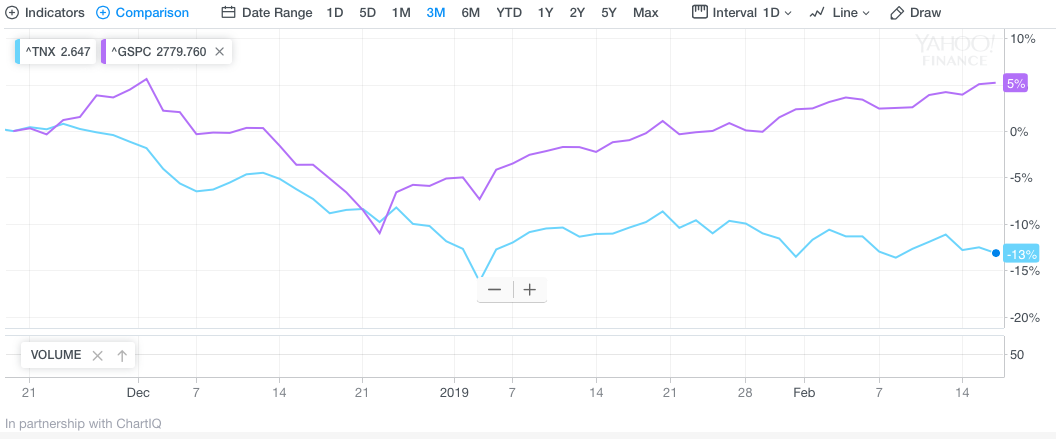
With the S&P 500 rising roughly 18% off of its December 2018 lows, analysts and strategist have become concerned that the bond market isn’t confirming the move in the equity markets. Typically, bond yields will rally with the market, yet the 10-year Treasury yield has not moved much off of its December lows and has deviated from the SPX path, as depicted below.
“One of these markets is going to be wrong, and it’s hard to know this time around which one it’s going to be,” said Art Hogan, chief market strategist at National Securities. “The bond market is betting we are not going to see stabilization of growth, and that the China trade war drags on.”
In Hogan’s view, the stock market is moving higher based on three assumptions: An end to the U.S.-China trade fight, an accommodative Fed, and continued economic stability in both the U.S. and China.
“I don’t think the bond market is behind that narrative,” Hogan added. “The bond market is looking at the economic data stream and reflecting on the negatives.”
Vinay Pande, head of trading strategies at UBS Global Wealth Management, said that the bond market is not trading as if it were reflecting the same growth expectations of the stock market.
“Most economists think the economy is slowing, but we don’t know how much it’s slowing. That’s a bit of an issue for the Fed, and that’s why they’re going to be on hold. Is the bond market expressing the longer-term consensus? No, it’s not. The bond market is really trading like it’s a reinsurance market,” where reinsurers will raise prices with each successive event: If there were hurricanes five years in a row, they would still charge as though another hurricane was expected in the sixth year. There’s a muscle memory to this.”
With the Fed on pause, halting rate hikes for the foreseeable future, yields tend to flatten out and remain without the need to rise. But there are also those factors outside of the U.S. bond complex keeping a lid on rates while equities rise. European yields are at or near their multi-decade lows; even Japanese yields fell into negative territory recently. John Briggs, head of strategy at NatWest Markets identifies that part of the reason why U.S. yields have remained low since the December route has been the decline in European yields.
“Part of it is the grind lower in European yields, the economic news continues to be poor and part of it is looking ahead to the FOMC minutes.”
U.S. yields often follow the German bund yields, which have moved lower on weaker European data and political uncertainty in Europe. The German 10-year bund yield was 0.10% Tuesday, while the U.S. 10-year has been in a recent range of 2.60 to 2.80 percent.
“One way to interpret the moves is an extremely dovish Fed is going to keep interest rates low, and let risk rise. The Fed’s goal at this point is to extend the expansion,” said BMO senior rate strategist Jon Hill. “If they’re able to do so, that means lower rates, higher equities. If they’re not able to do it we’re looking at the end of the cycle and looking back at zero rates,’ he said. “The Fed would start cutting rates, possibly as far as returning to zero percent.”
Hill said the mystery is the dollar and why it continues to rise as yields slide. One explanation is that the dollar is trading higher on the fact the U.S. economy is still relatively strong compared to other parts of the world.
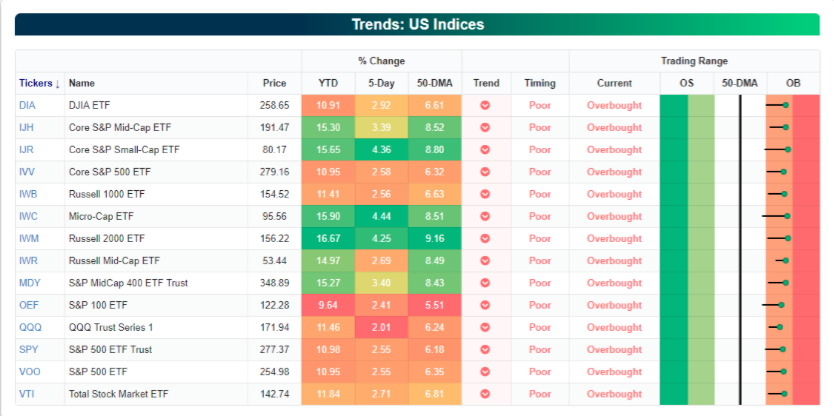
While the debate as to why the 10-year yield and SPX correlation has become disconnected during the SPX rally wagers on, all of the major indexes and index ETFs have found overbought territory according to Bespoke Investment Group’s Trend Analyzer.
Investors are continuing to rely on 2 main variables for a sustained market rally, a China trade deal of sorts and a dovish Fed that remains on the sidelines and potentially signals an end to quantitative tightening. Even with the possibility of an earnings recession in the first half of 2019, investors have been chasing the market higher.
“It seems a ‘panic buying’ mood, with purchases by investors who had been lagging the broader market, has strengthened,” Masanari Takada, a cross-asset strategist at Nomura, said in a note Monday. “Systematic trend followers that had temporarily suspended buying after the weak US retail sales print have also been compelled to follow the market by adding fresh longs.”
Takada’s comments mirror that from other analysts, including J.P. Morgan’s (JPM) Marko Kolanovich. On Tuesday, Finom Group offered these notes to subscribers and as follows:
“Another group of managers invest based on price trends. Interestingly, these investors are still short equities, despite the recent rally. With various trend signals turning positive (e.g. 3M and 12M for S&P 500, and 1M for various international indices) one would expect these investors to start adding equity longs. Note that trend following investors are currently long bonds, and the low equity position of volatility targeting investors also implies high bond allocations. This can help explain the current low bond yields despite an impressive equity rally. After record mutual fund outflows in December, the data doesn’t show any meaningful inflows in January. Given the market rally, dealers’ gamma positioning is neutral or long – this is favoring low and declining volatility, and further re-levering of various investors. In summary, important groups of systematic and fundamental investors did not re-risk and missed a significant portion of the rally. This includes volatility sensitive managers, trend followers, and to a large extent hedge funds and retail. If volatility stays contained (and this is favored by gamma positioning), re-risking should continue.”
Lastly, but certainly not least is commentary from Goldman Sachs (GS) that suggests the market has largely priced in an earnings recession and reflects fair value.
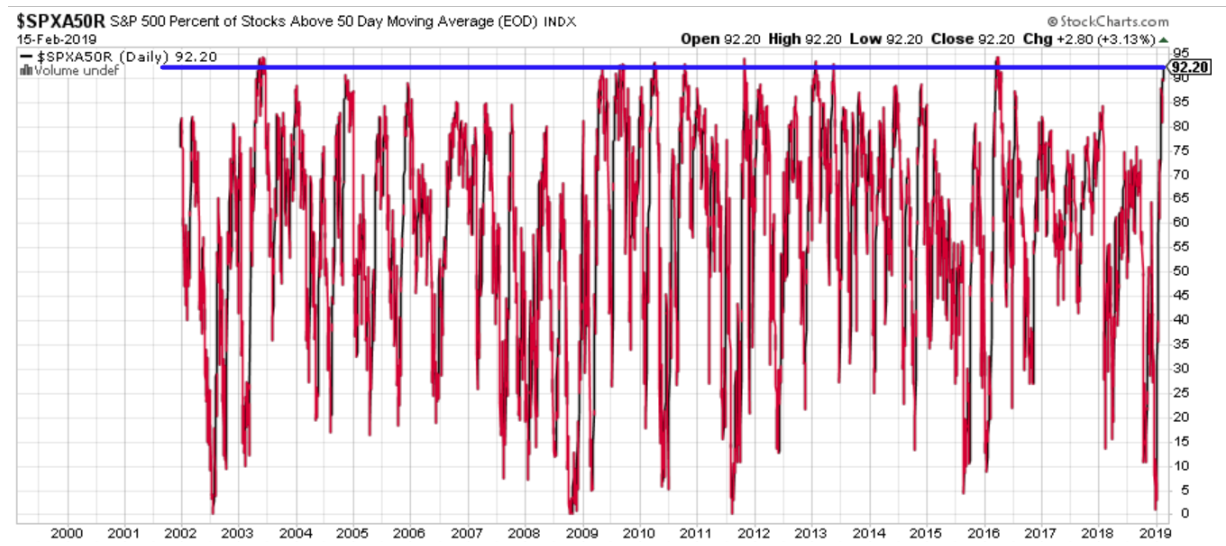
We can’t propose to know what the next move for the market is at any given time, but we can certainly look at market conditions and juxtapose them against history in order to extrapolate probabilities. At present, we have noted the market is largely overbought, but overbought with really strong breadth. That’s a good thing! As shown in the chart below, more than 90% of the S&P 500’s stocks are above their 50-DMA.
According to a study from Troy Bombardia, here’s what happens next to the S&P when more than 90% of S&P 500 stocks are above their 50-DMA.
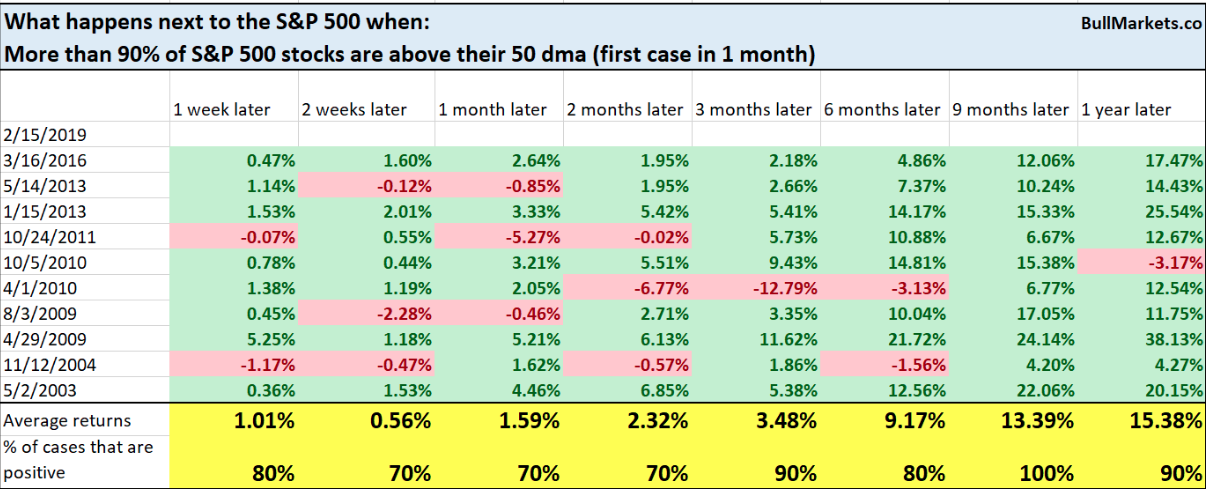
While the study certainly points to future gains in the S&P 500, we can’t be too certain of what will happen between now and the next 6-12 month period. As the market edges ever closer to the 2,800 level, SERIOUS RESISTANCE, we expect market participants to start taking outsized hedges. As such, one could see another market correlation start flashing yellow. Keep an eye on the VIX-SPX correlation going forward; especially with the VIX hovering at lows not seen since September 2018 and with the index having been cut by nearly 70% since its peak in December 2018. With that in mind and under the guise of the SPX expressing overbought conditions, we urge traders to recognize the following chart.
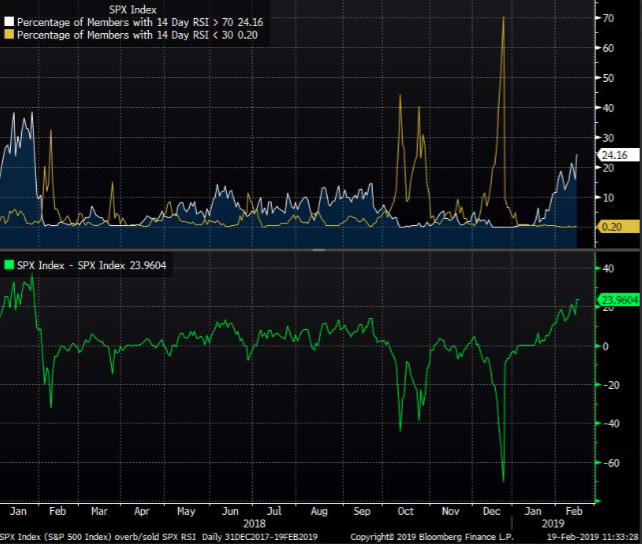
The chart above identifies the net share of S&P 500 constituents that are overbought according to their 14-day RSI. The net share of equities above their 14-day RSI is at roughly 25%, the highest percentage since right before the VIX blew up last year! In short, this chart matters because the only way to achieve the VIX dropping as sharply as it has in 2019 is to coincide with overbought market conditions. To reiterate, given the overbought S&P 500 conditions, relatively high level of market complacency as gauged by the VIX and with a critical resistance level for the S&P 500 within arms reach, we expect to see some further market correlations come under pressure. With that being said, the market has a funny way of surprising us all from time to time. We’ll leave you with a couple more notes of interest ahead of the market open today with respect to economic data points and or sentiment.
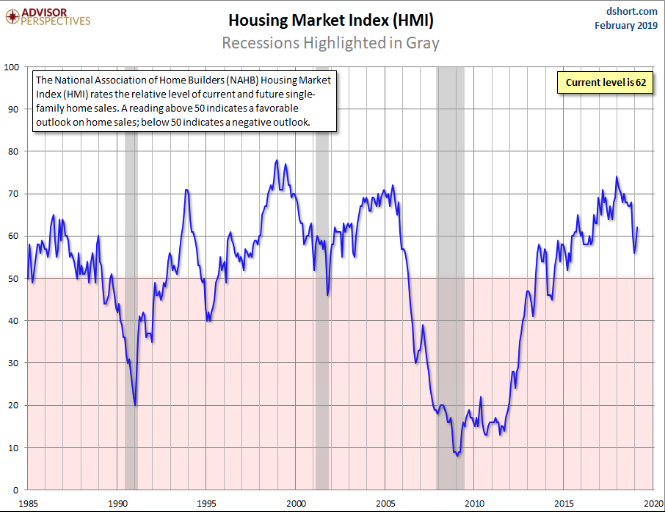
We’re all concerned about the housing market/sector, as the persistent declines in most metrics fell throughout 2018. But with mortgage rates hovering at 16 month lows now, sentiment may be showing signs of improvement. The National Association of Home Builders (NAHB) Housing Market Index (HMI) is a gauge of builder opinion on the relative level of current and future single-family home sales. The latest reading of 62 is up 4 from last month’s number.
“Builder confidence in the market for newly-built single-family homes rose four points to 62 in February, according to the latest NAHB/Wells Fargo Housing Market Index (HMI) released today in Las Vegas during the 75th annual International Builders’ Show.
Ongoing reduction in mortgage rates in recent weeks coupled with continued strength in the job market are helping to fuel builder sentiment,” said NAHB Chairman Randy Noel. “In the aftermath of the fall slowdown, many builders are reporting positive expectations for the spring selling season.” [link]
While the NAHB survey proved favorable recently, we’ll have to wait and see if a trend develops. In a recent research report and market update, Michelle Meyer – Head of U.S. Economics, BofA Merrill Lynch Global Research suggests that housing will prove to be a drag on the economy in 2019.
Lastly, how about those Wal-Mart (WMT) results from Q4 2018, released before the opening bell on Tuesday. The headline was that the company beat analysts’ estimates on both the top and bottom line. Here’s what the retailer reported for the fourth quarter of fiscal 2019 compared with what analysts were anticipating, based on a survey by Refinitiv:
- Earnings per share, adjusted: $1.41 vs. $1.33 expected
- Revenue: $138.79 billion vs. $138.65 billion expected
- Same-store sales in the U.S.: up 4.2 percent vs. growth of 3.2 percent expected
Wal-Mart reported net income for the quarter ended Jan. 31 of $3.69 billion, or $1.27 per share, compared with $2.18 billion, or 73 cents a share, a year earlier. Excluding one-time items, Wal-Mart earned $1.41 per share, 8 cents ahead of analysts’ expectations based on a survey by Refinitiv. Revenue climbed nearly 2% to $138.79 billion from $136.27 billion a year ago. That came in ahead of expectations of $138.7 billion.
Online sales were up 43% during the fourth quarter, matching growth during the previous quarter. Wal-Mart said that for the year, it achieved e-commerce sales growth of 40%, which it had been targeting. Wal-Mart didn’t change its sales outlook for fiscal 2020 from last October. Net sales growth is predicted to be at least 3%, hurt by deconsolidation of Wal-Mart’s Brazil operations and reduced tobacco sales at Sam’s Club. Wal-Mart still expects net sales to climb about 5 percent internationally. Wal-Mart is still calling for U.S. same-store sales to rise 2.5 to 3% for the year. Fiscal 2020 operating income is expected to decline slightly.
We have 2 key takeaways from the Wal-Mart results: 1. The Census Bureau’s reported December retail sales are further evidenced as having numerous errors, especially with regards to the Nonstore sales category (online sales). As mentioned in previous State of the Market videos, Seth Golden has gone on record as stating the December report was erroneous and would find itself with upward revisions in the subsequent months. The data simply doesn’t match even other economic data points that would have to resemble something of the magnitude of the Great Financial Crisis. The following chart of retail sales validates our thoughts and Seth Golden’s statements.
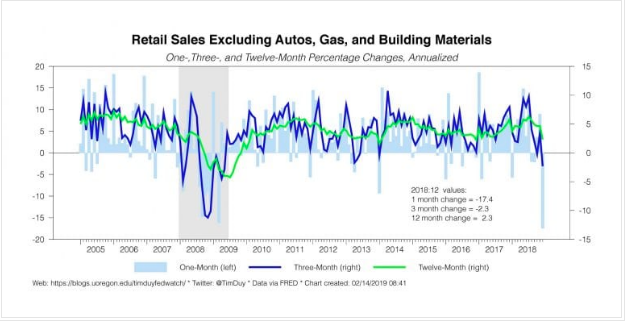
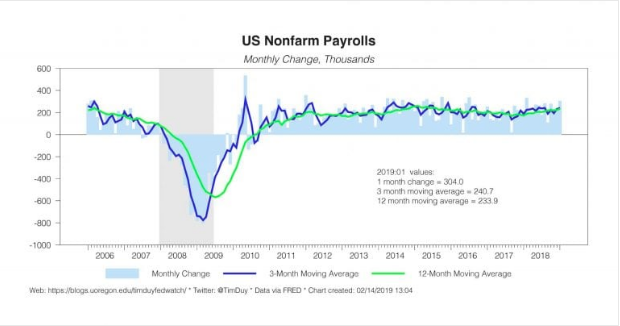
As one can see the drop in retail sales, that doesn’t match what has been reported by retailers and data tracking firms to-date, DOES match the 2008 drop in retail sales. Does this make sense given the fact that we added 300,000 Nonfarm Payrolls in January and over 200,000 jobs in December 2018?
Seriously, we dropped into the Great Financial Crisis/Recession again, that’s what happened in December? Certainly didn’t seem that way by ANY account of shopping activity.
Moreover and with regards to Wal-Mart’s online sales growth for Q4 2018 and forecast going forward…IMPOSSIBLE! You see, it’s virtually impossible to grow at that rate, let alone for any significant period of time. The issue with stating 43% online sales growth and forecasting 35% online sales growth to come is an operational and systems issue. It’s an impossibility to find shoppers gravitating in that manner and to that purchase behavior degree of scale. What is possible is operations and system errors, created by humans of course. Here’s how we explain it in another, you’ll only see this here detailed explanation.
“We’ve all heard of BOPUS by now right? And if you haven’t this only serves to validate the statements above. BOPUS is an acronym for buy-online-pick-up in-store. Essentially a shopper orders an item/s, but stipulates that they will pick-up the items at their local store. Many a time, some retailers suggest upwards of 40% of the times, once a shopper is in the store with the intent to pick up an online order, they actually shop more and add items to the total purchase. The issue with this transaction is that the additional item/s are then calculated into the original online order and completed, in total, as an online order, even though the items were shopped for and purchased within the physical store. At the point-of-sale (cash register) the clerk in many retail chains has a prompt whereby they can end an online sale and transact additional merchandise as a regular store purchase within the same total transaction. The problem with the prompt is that it doesn’t stop the clerk from his/her activity of scanning merchandise. More often than not, the clerk ignores the prompt and completes all scanning activity of items under the BOPUS transaction from whence the transaction originated. This is how you get to 43% online sales growth. It’s not a nefarious activity we’re outlining, just growing pains and system faults that will be remedied in years to come”


