The following charts and analysis were previously offered inside Finom Group’s weekend macro-market Research Report titled “From Good Overbought to Good Oversold.” This blog will serve to build upon our former, exclusive analysis and reporting to Finom Group members. As the chief market strategist for Finom Group and managing director for the Golden Capital Portfolio, we hope you enjoy this blog and have a great trading week!
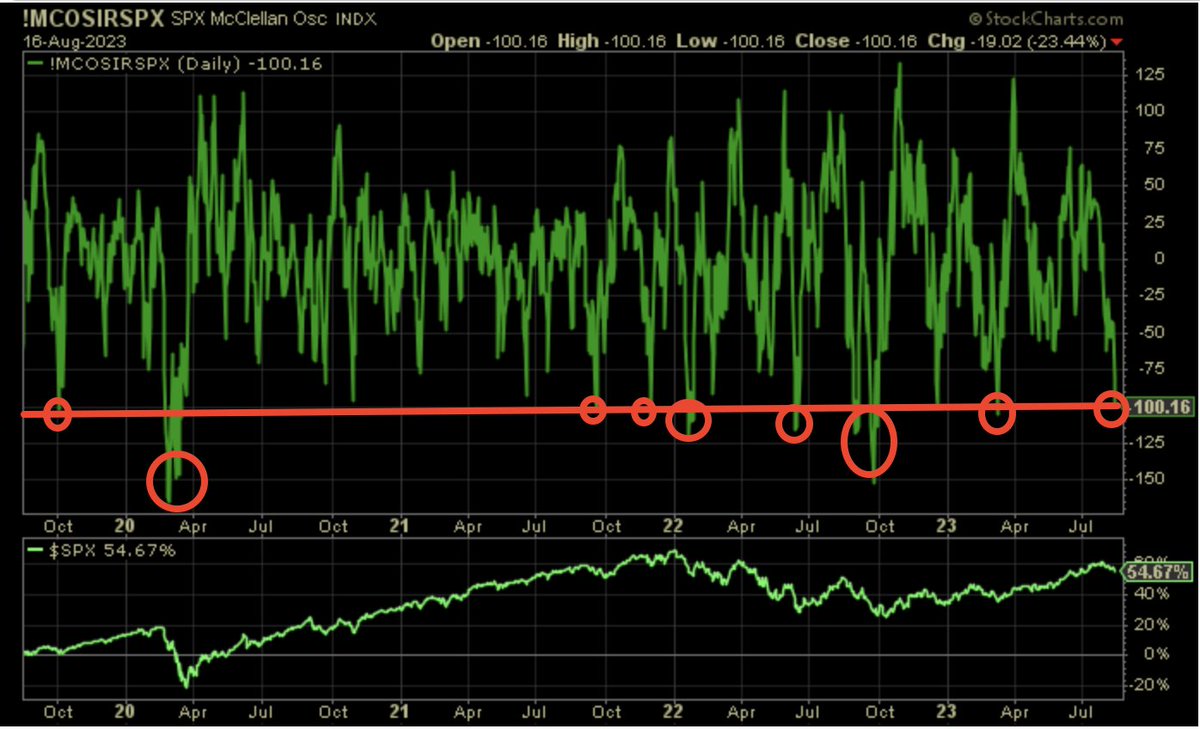
“With the major averages losing more than 2% this past week, the S&P 500, Nasdaq, and NYSE McClellan Oscillators all reached oversold territory.
Historically, when the S&P 500’s McClellan Oscillator achieves such oversold levels, it is a good time to start buying during normal and to-be-expected pullbacks or understood bull markets that are consolidating. In the last 4 years, only 1 time did the S&P 500 not rally 4%+ within the next 30 days after reaching such oversold levels. Respecting that this is a narrow time frame, Fundstrat broadened the basis of study, for the sake of validation and further detailing the probabilities going forward.
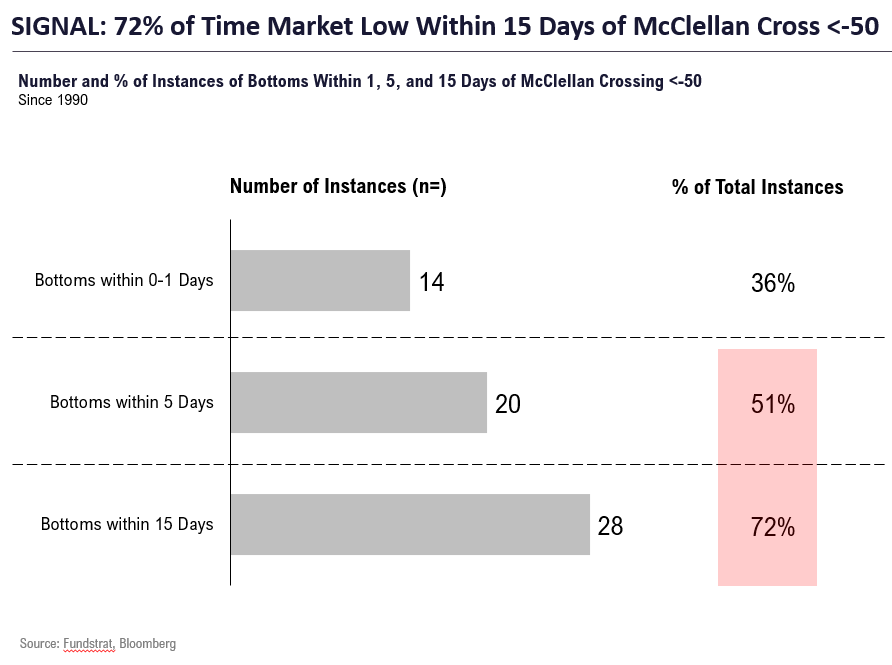
As shown in the Fundstrat table above (going back to 1990), when the McClellan Oscillator crosses below -50 the majority of market bottoms occur within 15 days, while very few occur within a day of the oversold condition. I think the more determining factor, that may suggest the consolidation period bottom has already or will occur more quickly than the 15-day period is the fact that the McClellan Oscillator achieved -100, a much more oversold reading than -50, obviously.
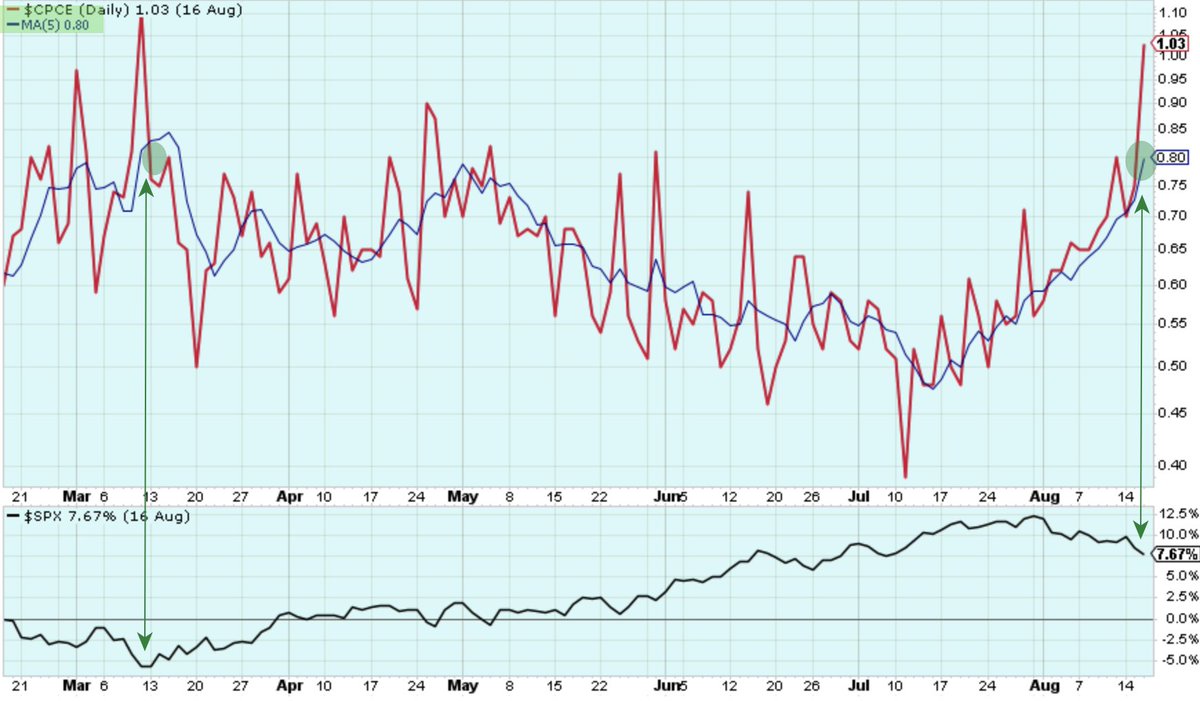
Another oversold condition recognized this past week occurred by way of the Equity Only Put/Call Ratio. We observed the first spike above 1.0 since March, which also marked the bottom of the Q1 2023 consolidation period.

There are two points of interest with respect to the conjoined chart and data set above. First, I believe the P/C Ratio is a better sentiment indicator than any of the so-called sentiment surveys. The P/C Ratio is not a Q&A survey, it is actual traders placing actual capital at risk. Now let me detail the chart/table above:
- I pulled the P/C ratio chart out for view-ability.
- While the spike in P/C ratio is notable, this can happen at any time and simply be a byproduct of an unfriendly headline.
- For this reason, we like to use the 5-DMA (blue line) to recognize whether or not the spike in the P/C Ratio is just a spike or has been building momentum.
- When the 5-DMA for the P/C Ratio gets to .75 or better, it has typically signaled oversold, risk-off bottoming is afoot, and has always marked the near-term bottom.
- The table above goes back to 2014, recognizing all P/C Ratio spikes above 1.0. As we can see, all 3-month forward returns from the signal date were positive for the S&P 500. The signals were not without their deeper drawdowns, also displayed in the table. Covid drawdowns were exceptional.

Another identifiable oversold conditions is represented in the chart above. At the end of the trading week, fewer than 14% of stocks in the S&P 500 are trading above their 20-DMA (blue trend line panel). Akin to the P/C Ratio spiking above 1.0 in March and marking a bottom, the percentage of stocks trading above their 20-DMA has not been this low since the March bottom (circled, chart from Fundstrat’s Mark Newton).
The setup for the coming week does seem more favorable than prior weeks, based on good oversold conditions and certain of our quantitative studies outlined.”
Alright folks, let’s get to it! With all the aforementioned oversold charts and analysis depicted from within the Finom Group macro-market Research Report reiterated above, the S&P 500’s resulting price action found some upside relief this past trading week. The benchmark index rose a little more than +.8% for the week, providing some oversold relief and dollar-cost-averaging benefits to the savvy investor/trader. I would not suggest that this past week’s market rally proves a resumption of the uptrend, as the S&P 500’s McClellan Oscillator remains in lesser negative territory than where it ended the prior week, whilst other market internal/breadth data continues to struggle. Having said that, investors would be encouraged to focus on the previously detailed Equity Put/Call Ratio, 3-month forward S&P 500 performance data. Remember, it is more about “time in the market, than timing the market.”
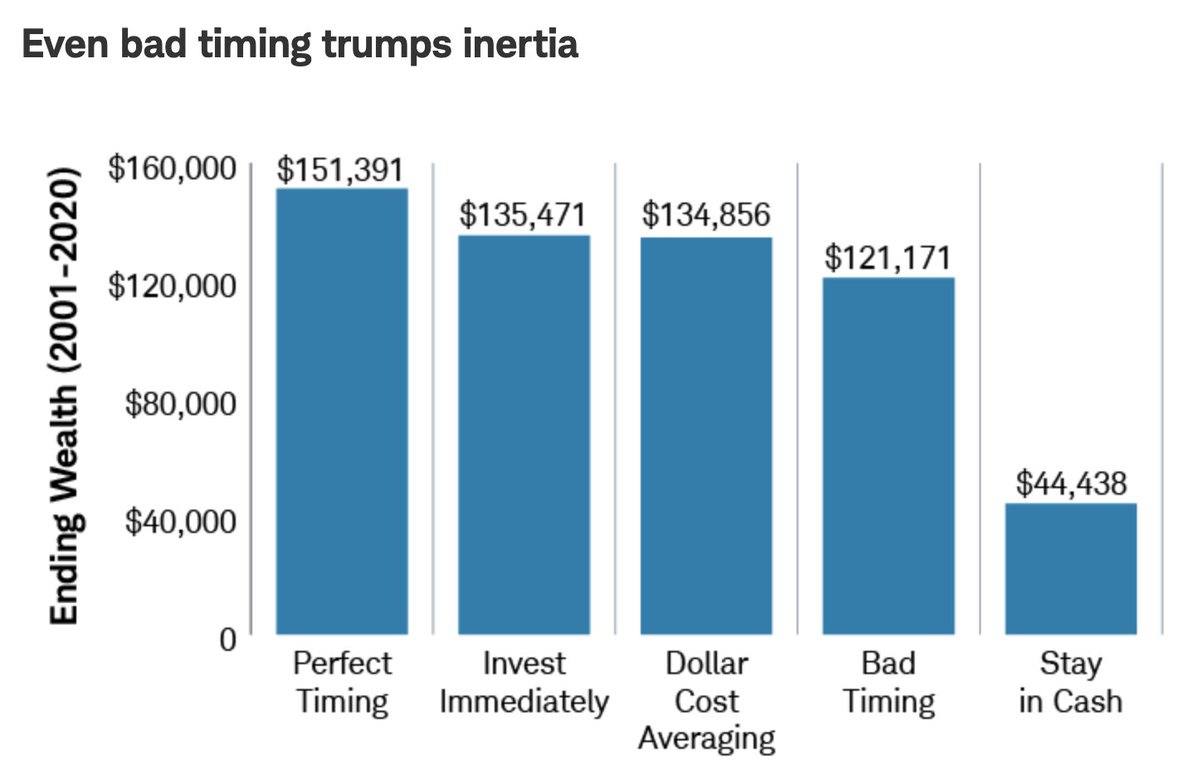
The lure of outperforming the S&P 500 with market timing is often a sign of ignorance or a “non-investor” altogether, putting on shows of analyzing market conditions on social media platforms (X), while maintaining a perma-cash pile. What the chart above from Charles Schwab identifies, however, is that even the best market timer has minimally better performance than Buy Any Time/DCA/Bad Timer. In other words, even if one was so presciently precise with market timing skills, it would prove of little–no advantage.
August has proven a rough road to travel for investors and traders alike. This had always been the expectation of Finom Group, given the seasonally weaker period for equities typically commences in August, lasting through much of the Q3 and Q4 period, according to the Ned Davis Research 2023 S&P 500 Cycle Composite.

The S&P 500’s price performance in 2023 has very much traveled the pathway of the Cycle Composite, although deviating in level somewhat. What is identified in the Cycle Composite is the sideways, corrective price activity that would normally arrive in August, which has been proven. While such cyclical analogues can and have proven a useful guide, helping to align investor/trader expectations, we should recognize that analogues are not a perfect guide for future price action. Now let’s revisit that Equity Put/Call Ratio, but through yet another lens…
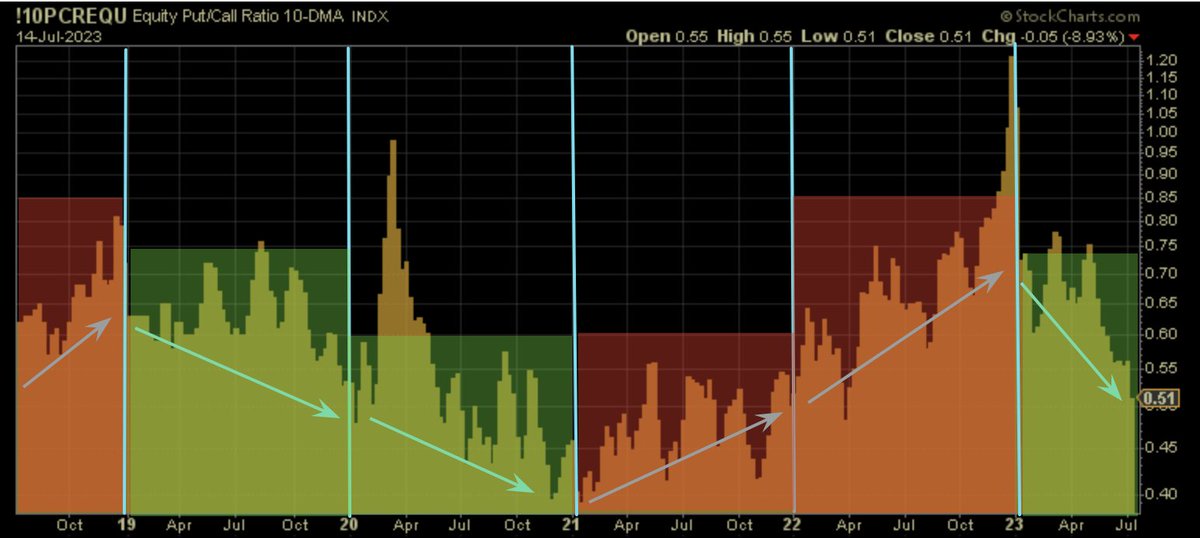
I’ve long since been of the opinion that the various Put/Call Ratio trackers are a sound depiction of investor/trader sentiment. The 10-Day P/C Ratio helps us to identify longer-duration sentiment regimes. The chart below annotates these such regimes.
If past is prologue, there was a 2-year downtrend regime before a 2-year uptrend regime commenced in 2021, suggesting that the current P/C Ratio 7-month downtrend regime may be in its infancy. To be sure, even within a downtrending P/C Ratio regime there are periodic spikes of fear or bearishness, where investors and traders alike are purchasing significantly more Puts than Calls. That is what we have witnessed of late, expressing overly bearish or fearful levels. With that in mind, the following 10-Day Equity P/C Ratio has achieved a level that may help to inform investors that oversold conditions on a shorter term basis may have found relief, but on a longer-term basis they have only become more oversold and or bearish.

The 10-Day Equity Put/Call Ratio chart above goes all the way back to 2009. It identifies the previous times (circled) that the P/C Ratio achieves the .80 level or better/greater. Such achievements have been rare during this time period, occurring only a handful (or so) of times over the last decade plus (during market downturns).
The bottom panel of the chart details the S&P 500’s price trend during the same period. The white perpendicular lines identify when the 10-day Equity Put/Call Ratio achieves .80 or greater, which has typically marked a trough/bottoming period for the S&P 500. As we can see within the stacked chart, such sentiment extremes usually arrive as the market bottoms and then resumes another sustainable rally in the S&P 500 (arrows).
The aforementioned technical and quantitative analysis is not a timing tool, but like former analysis and studies, at the very least it labels and identifies buying opportunities for investors and traders with longer-term time horizons.
Just as I was encouraging Finom Group traders to take advantage of the -4.6% drop in the S&P 500 and -6%+ drop in the Nasdaq two weeks ago, in order to capture “good oversold” conditions and before this past week’s rally in the markets…

… the more durable oversold conditions identify a more durable uptrend is likely still ahead for markets. Combining the sentiment extremes with the 2023 Cycle Composite, there may still prove some “slop and chop” near-term. I’m of the perspective that such price action would then deliver greater opportunity for investors, as earnings estimates and GDP continue to outperform expectations.
Looking ahead to the final trading week of August, which will also deliver some key economic data, the 5-month win streak previously held by the S&P 500 may also come to an end. It’s not the end of the world, but an end nonetheless?
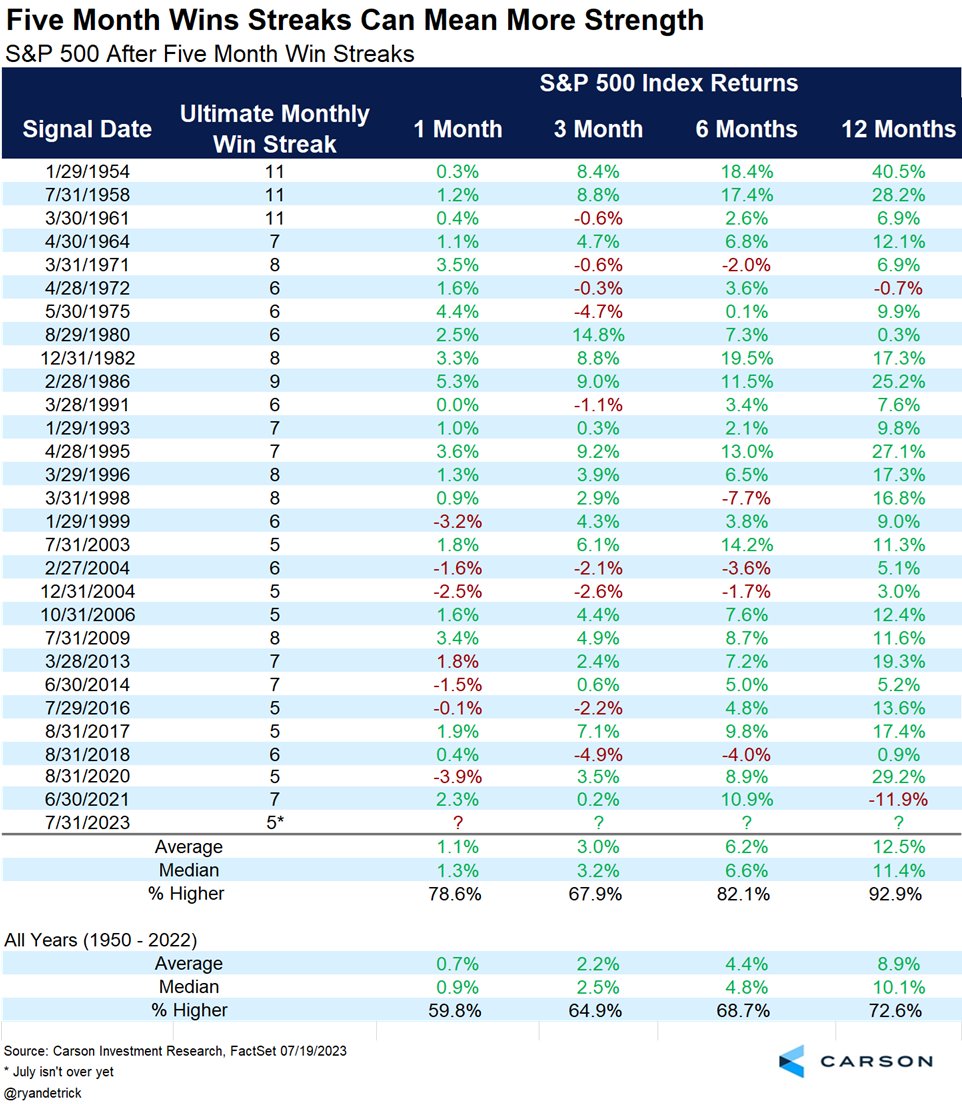
The data above from Ryan Detrick of Carson Investment Research details S&P 500 5-month win steaks since 1954 and the forward price performance of the S&P 500 from such occurrences. Typically, a 5-month win streak has led to a 6-month win streak some 79% of the time. Unfortunately, the most probable 6-month win streak does not appear to be replicating that probability in 2023. Can we dive a little deeper here, using the data from within the same study? If I’m asking, you know the answer already!
Based on the table above, if the S&P 500 finishes the month down -3% or greater, after a 5-month win streak, it will prove only the second time in history to do so besides 2020. Additionally, what I would encourage investors to focus on is that the forward S&P 500 performance 6 and 12 months after a 5-month win streak is extremely positive, up 82% and 93% of the time respectively. The average S&P 500 returns 6 and 12 months later are also 6%+ and 12%+, for which savvy market participants may relish in whatever slop and chop price action develops further and in the interim.
There are thousands upon thousands of investors, who with just a 5% pullback are willing to throw in the towel. I strongly hope that is not anybody who is reading this weekend’s blog… and why? The bull market was confirmed on 6/8/2023, when the S&P 500 advanced 20% from the bear market low. It took some 165 trading days, the 2nd longest bear-to-bull achievement since 1957’s, at 192 days. All but one of these former bear-to-bull markets lasted longer and delivered more gains than the current 9-month cycle. It would be very improbable that a new bear market has started at the 9-month mark, and doesn’t deliver more gains in the 12-month forward period.

So far as that one failure is concerned…If I’ve said it once I’ve said it hundreds of times, “The Dotcom – 9/11) period is littered with failed historic studies and quants.” (Table via LPL Research)
I previously mentioned that the earnings and economic pictures continued to outperform. Such trending outperformance triggered a signal from the SentimenTrader, which may also provide some forward context for investor.


The OECD Composite Leading Indicators for the United States reversed higher from contraction territory, triggering a buy signal from the S&P 500 as of July 31, 2023. Since 1958 and after similar reversals in leading indicators, the world’s most benchmarked index was higher over the next two months every single time. This suggests that there is a reasonably high probability that the S&P 500 would achieve new 2023-highs by the end of September. Or will this time prove a “first and worst” 2-month forward performance?
Here is something on the Finom Group radar, so to speak! A potential government shutdown by the end of September is on our radar, and a risk factor we think investors/traders should be monitoring closely. While such an event carries negative connotations, it has often resulted in “transitory”price action, pun intended. The table below provides some brief and concise historical data on shutdowns/market impact.
Back in February 2023, I offered a blog with commentary and sentiment leaning in favor of accumulating Large-cap, Growth areas of the market, as our carefully analyzed data pointed toward further market upside (alongside to-be-expected volatility). Click the link to review at your leisure. If we fast-forward to the present day, and look out some 6 months at least, the weight of the evidence within this blog and trending reporting/analysis performed by Finom Group informs of more market upside ahead. Taking advantage of any near-term market weakness may prove savvy. Happy investing/trading folks, and for our deeper-dive weekly Research Reports, subscribe here today!


