
Welcome to another trading week. In appreciation to all of our Basic membership level participants and daily readers of finomgroup.com content, we offer the following excerpts from our Weekly Research Report. Our weekly report is extremely detailed and has proven to help guide investors and traders during all types of market conditions with thoughtful insights and analysis, graphs, studies, and historical data/analogues. We encourage our readers to upgrade to our Contributor membership level to receive our Weekly Research Report and State of the Market Videos and take advantage of this ongoing promotional event today! With that have a great trading week, be in touch and take a look at some of the materials in this weekend’s published Research Report!

Research Report Excerpts #1
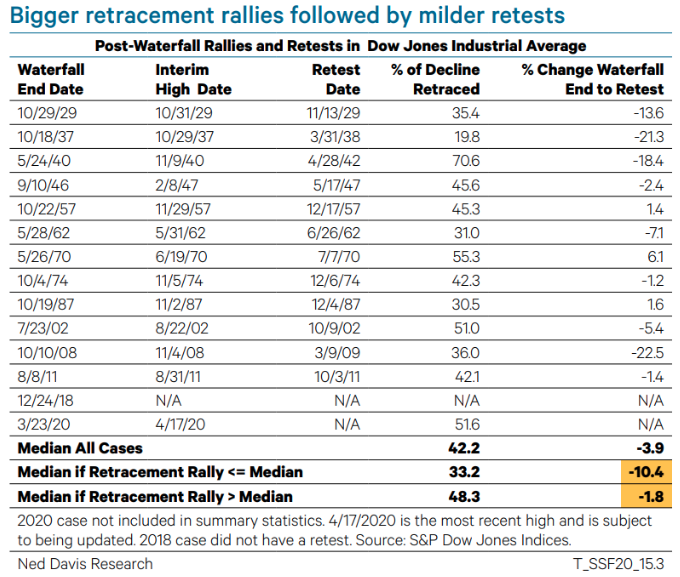
Based on the study above from Ned Davis Research, it’s clear that this is a greater than median retracement off of the initial waterfall low. We will only know the extent of the retracement in hindsight. There may be room to the upside still to come and as such we’ll remain flexible and open to a wide variety of outcomes. Additionally, based on the previous waterfall declines from the past and the median retracements associated with such declines, the study outlines that not only should the DJIA not fully retest the lows, but the downside from present levels is very, very limited. If just going by the median of all cases in the study, the downside has been just under 4 percent. To know the history of the markets is to better understand and prepare for the probabilities ahead.
Excerpt #2
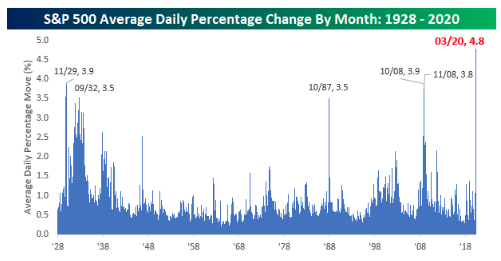
In terms of greater than 1% daily moves, as depicted in the MacroCharts graphic, the annual average is 53 days over the last +6 decades, and we’re not even a full 4 months into 2020. Stay nimble folks, stay nimble! Here are some more notable statistics regarding 1%+ daily moves in the market from DataTrek:
- Q1 2020: 30 one percent days versus the Q1 average of 13 since 1958 (first full year of data).
- Q2 2020: 12 one percent days, or just one away from the Q2 average of 13 with over 2 months left to go in the quarter.
Registering 30 one percent days in Q1 was a very unusual development and this quarter is setting up to hit it again. The S&P 500 has only had thirty +1% daily returns in a given quarter 18 times in the last +60 years, or just 7% of the time. Let’s look at those instances, along with the index’s price return and number of 1% days in the following quarters to help see what it signals. For the sake of brevity, we’ll discount the 1970’s cases and begin with the 1980’s on forward. Forward returns from the 1970’s were all positive just so ya know!
Excerpt #3
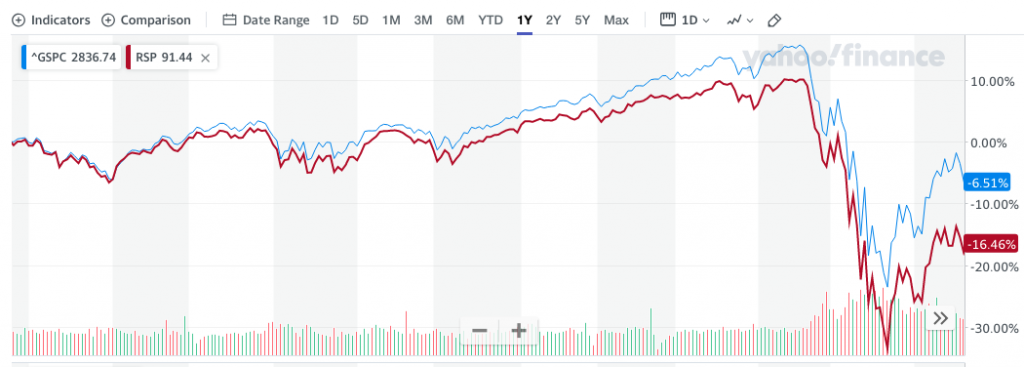
Not everything is “peaches n’ cream” in the market despite the strength expressed on Friday. Remember, all indices fell on the week, but tech still led with the Nasdaq (NDX) only down .18% for the week. The broader S&P 500 index falling more than 1% is better understood for it’s size and scope by way of the equal weighted index performance, which has greatly lagged the market-cap weighted S&P 500 itself. The chart above identifies the 1-yr performance for the S&P 500 market-cap weighted index vs. the equal weighted ETF (RSP). As we can see, the S&P 500 is down more than 6% while the RSP is down more than 16% over the last 12 months. There’s weakness out there folks, don’t let the relief rally lure you into a false sense of security near-term. Think long-term, utilizing a disciplined process and reviewing the game plan daily.
Excerpt #4
Under the umbrella of the SPV, the Fed effectively can buy corporate bonds, junk bonds, muni bonds, ETFs of all shapes and sizes, and even stocks in order to support markets. The other thing to consider here is that the Fed doesn’t act like a prudent money manager and move into positions slowly. No, when the Fed decides to buy, they do so with a big splash. They don’t care what price they get. Remember, the buyer of last resort has an almost limitless checkbook. And Jay Powell has said the Fed will “do anything it takes” to support the economy during this crisis.
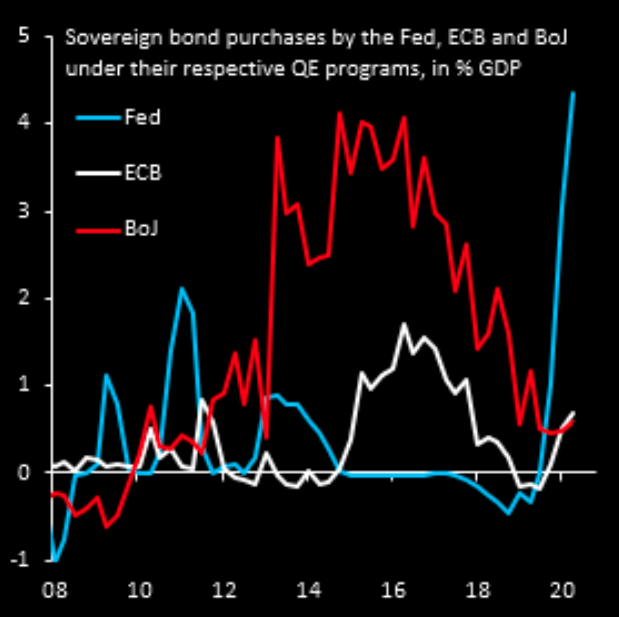
The Fed’s massive QE program has no precedent. We’re not yet done with April, but the pace of purchases already exceeds the 2013 start of QE by the Bank of Japan, which by the way has a meeting on Monday and for which the market anticipates the BOJ to announce a limitless bond-buying plan of their own. By the time Q2 2020 is fully done, Fed QE purchases will likely far exceed anything any other central bank has ever done, including the BOJ’s past QEs. How did the Nikkei do from 2013 and during the BOJ’s QE programs? It was up 30% in 2 years. Don’t fight the Fed folks!
Excerpt #5
It would appear as though Citi’s analysts agree, as valuations are rarely a good means for capital allocation decision-making during bear markets. One signal the Citi team advises not to look at are price-to-earnings ratios. During the March 2009 low, the trailing price-to-earnings ratio did fall to 9 times earnings, but in the 2000-03 bear market, the trailing P/E ratio was 21 at the bottom. Measuring prices against a 10-year average of EPS, known as the CAPE ratio, gives similarly confused results.
The Citi team is looking at four things:
- PMIs
- Infection data
- Earnings revisions from sell-side analysts and credit spreads.
Excerpt #6
Mike Wilson of Morgan Stanley: “With risk assets now overbought, the chance for a correction has increased. We see stocks as continuing to trade in a range between 2,600 and 2,300, noting that the S&P “will find strong support at the 200-week moving average, or 2650” and should markets continue to look through the near term bad news on earning, “it should face resistance at the 50-week moving average, or 2995.
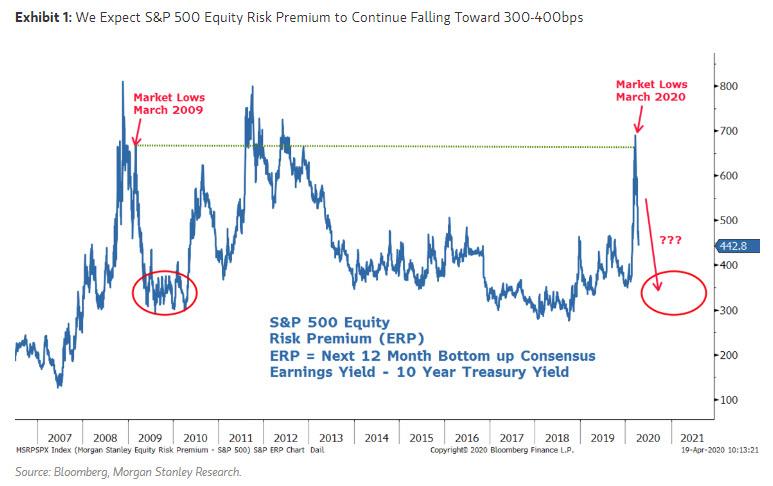
Our over arching view continues to be that the equity market bottomed in March on what amounted to a forced liquidation. The monetary policy response has been effective in stabilizing credit spreads and equity risk premiums which reached the same level observed at the lows of the Great Financial Crisis in March, 2009 (Exhibit 1). Therefore, it is unlikely we will approach such levels again any time soon. Meanwhile, fiscal programs appear to be getting the money to their desired destinations after a slow start which should support both consumers and small businesses until the economy can get reopened. In fact, the PPP program has already run out of money with increases now being debated in Washington.“
Wilson says he would “not be surprised if a correction in U.S. equities begins soon.” The reasons for this are that in addition to what is likely to be a partisan debate on more fiscal stimulus, the Morgan Stanley strategist expects more bad news from companies on earnings results as well as their outlooks for 2020.
Excerpt #7
Insight/2020/04.2020/04.24.2020.EI/S&P%20500%20Earnings%20Growth%20Q1%202020.png?width=920&name=S&P%20500%20Earnings%20Growth%20Q1%202020.png)
- Looking at future quarters, analysts predict a (year-over-year) decline in earnings in the second quarter (-31.9%), third quarter (-16.9%), and fourth quarter (-7.4%) of 2020.
- The forward 12-month P/E ratio is 19.1, which is above the five-year average and above the 10-year average.
- During the upcoming week, 172 S&P 500 companies (including 12 Dow 30 components) are scheduled to report results for the first quarter.
Excerpt #8
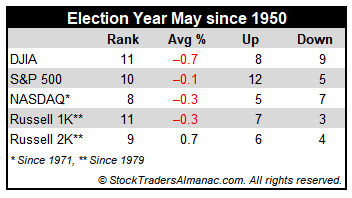
In the years since 1997, May’s performance has been erratic; DJIA up eleven times in the past twenty-two years (three of the years had gains in excess of 4%). NASDAQ suffered five May losses in a row from 1998-2001, down – 11.9% in 2000, followed by twelve sizable gains in excess of 2.5% and five losses, the worst of which was 8.3% in 2010. Election Year Mays rank at or near the bottom, registering net losses on DJIA and S&P 500 (since 1952), NASDAQ (since 1972) and Russell 1000 and 2000 (since 1980).


