
After a rough open for the tech-heavy Nasdaq and usually supportive FAANG stocks, the market quickly rebounded intraday. All major averages, on the heels of a worse than expected Netflix subscriber addition number and share price plunge near 12% overnight, finished higher on the day. What may be even more remarkable than the intraday reversal is the fact that Netflix halved its losses from the pre-market session on mixed analyst review of its Q2 2018 performance. The action left the bears scrambling for cover and likely with continued consternation and beating of the, “The market is being held up by FAANG” drum.
Of course the NYSE Advance/Decline line, which recently touched an all-time high refutes the FAANG-centric and bear prose as shown in the chart below.
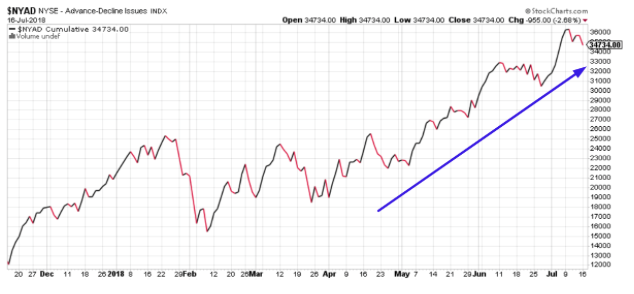
The fact that the Wilshire 5000 also recently hit a new high dispenses with the FAANG-centric market ramblings. The S&P 500 is a market-cap weighted index; hence large companies will have a bigger impact on the S&P than smaller companies will. This is a known fact so of course a few large companies will ALWAYS account for the bulk of the S&P 500’s gains in any given year. This is true in every single market cycle throughout history. As such, constant detracting from the market’s true compositional strength and appreciation is nothing new and nothing worthy of consternation or ridicule.
Given the longevity of the current economic cycle and bull market, bears seemingly loathe the market and its fundamental composition more and more with each passing day. When oil prices rise, it’s inflationary and they would have one believe that higher oil prices lead to higher gasoline prices, which ultimately would crimp consumer spending. Of course there is literally and not every any historical precedence for such a claim, but the drum beat marches on nonetheless.
Undoubtedly, higher oil prices lead to higher prices paid by consumers at the pump, but this is actually supportive to retail sales and the general economy. We witnessed, most recently in the monthly retail sales report, strong gas station sales, largely due to higher gasoline prices. But the higher gasoline prices didn’t amount to lesser/declining retail sales, ex-gas auto sales.
Gasoline prices have been marching higher for nearly a full year, but with crude oil prices possibly peaking for the season and heading into the lesser demand-side months, gasoline prices may be set to decline.
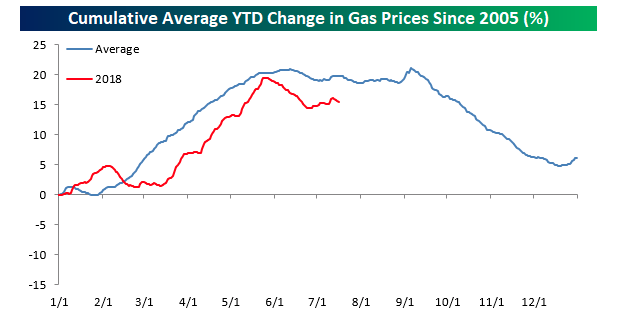
Based on the chart above, provided by Bespoke, we can see the trend analysis. The chart above compares the changes in gas prices so far this year to the average “intra-year” pattern going back to 2005. So far in 2018, the pattern of prices has been tracking the average pretty closely, and if that continues to be the case, it would suggest that prices would continue to drift lower or in a sideways range for the rest of the summer, and then steadily slump from Labor Day through year-end. Given the seasonal trends that point to lower energy/gasoline prices near-term, those inflationary concerns the bears always point to may require an alternative supporting argument.
One of the bear arguments may actually be an important one long-term and as the Fed is set on a course to gradually raise rates throughout 2019, at least. That argument or thesis is centered on the lack of wage growth or wage inflation. While the earlier readings on wage inflation at the onset of 2018 proved disconcerting to investors, the lack of wage inflation since is equally concerning when juxtaposed with the Fed’s rate hike path set in motion.
The issue of inflation-adjusted wages stagnating came up in the hearing with Federal Reserve Chairman Jerome Powell on Tuesday. Sen. Sherrod Brown, the Ohio Democrat, asked him whether the typical worker really is better off than he or she was a year ago. See Powell’s response below:
“I would say that the labor market has strengthened. The labor report will show that wages went up 2.7%, that’s significantly higher than trend inflation. There is a bit of a bump from gas prices going up, and consumers do pay that. But I would say workers are better off.”
The issue both bulls and bears have with the Chairman’s response is found in the following chart and dissemination recently released by the labor department.
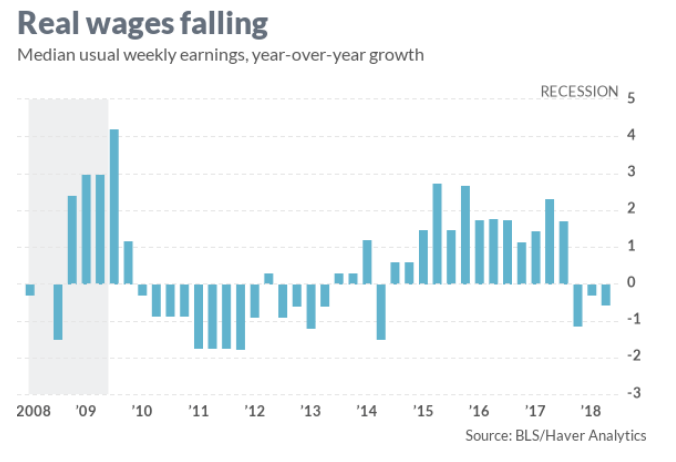
Wages aren’t growing when adjusted for inflation. According to the Labor Department, median weekly earnings fell 0.6% in inflation-adjusted dollars in the second quarter, compared to the same time period of 2017. That’s now the third straight quarter where inflation has outpaced wage growth.
Where the Fed Chairman’s response differs from that of the labor department data is what data is used when accounting for wages and inflation. Powell and the Fed utilize average hourly earnings, and not median weekly earnings. The Fed utilizes inflation as measured by the PCE price index, and not the consumer price index, which the BLS uses to compute real average wages. In a report last week, the BLS said real average wages were unchanged over the previous 12 months. So in terms of whether or not the average worker is better off than a year ago; the answer lay within the perspective one takes. At worst and based on the BLS’s metric correlations the average worker is no worse or better than a year ago. Having said that, the Fed is not finished with it’s tightening cycle. If all metrics remain as they are today and while the Fed continues to raise rates, reflation may impact the average worker and general consumption. Or maybe, maybe it won’t! What we’ve come to learn over the many decades is that where there is a reflationary cog in the economic wheel, there is always a deflationary cog of equivalence or greater weight.
The Fed Chairman began his 2-day semi-annual testimony in front of the Senate yesterday. In Powell’s prepared remarks, he offered the following:
“With appropriate monetary policy, the job market will remain strong and inflation will stay near 2 percent over the next several years,” Powell said in prepared remarks.
The Fed “believes that – for now – the best way forward is to keep gradually raising the federal funds rate” in a way that keeps pace with a strengthening economy but does not increase rates so high or so fast that it weakens growth.”
The economy is strong, supported by nearly every economic metric one can throw up against it. But bear market pundits will always have something or some negative perspective to offer as to why valuations are stretched and the bull market is about to end. Inflation or reflation is always there greatest ally in the fight against the bulls and history is on their side when it comes to signaling a bear market, as the Fed is raising rates. But the very notion of inflation they promote to cause or exacerbate bear market conditions isn’t found for discussion when it comes to risk. Let’s discuss this as it pertains to the Fed raising rates.
In general, investors seek the greatest rate of return with the least amount of risk. During the current economic and market cycle, that combination has largely been found in the equity markets. But with rising rates, bear market pundits would have the bulls believe that bonds and even cash can offer less risky and favorable yields. So let’s examine this notion given the fact that the Fed Funds rate is rising.
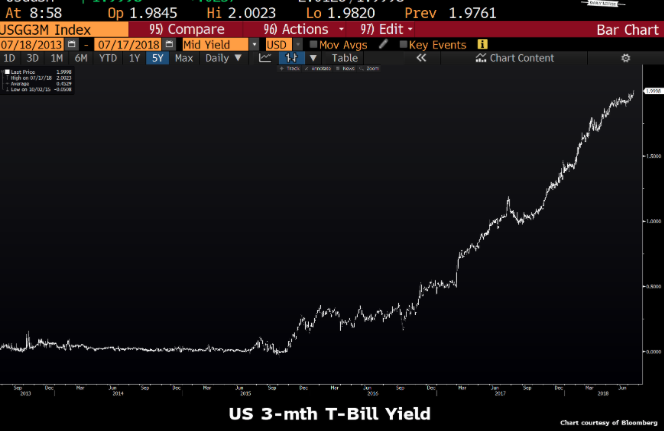
The chart above is the 3-yr Treasury note, which is basically what your savings account yield is based on. So that cash in your bank account is obviously better off than it was going back to the financial crisis. Just looking at cash without taking inflation into account is, well it’s wrong and the bears know this all too well as they constantly denote the need to adjust for inflation…in all economic data of relevance. So while there hasn’t been any meaningful inflation for quite some time, that doesn’t mean investors should stop thinking about the real level of interest rates. I mean, isn’t that what the bears suggest we should do when it comes to retail sales, consumer spending, wages et cetera? The following chart is the real problem with regards to the bear argument on risk/reward for investors and why cash still doesn’t offer itself as advantaged over equities, even as the Fed is raising rates.
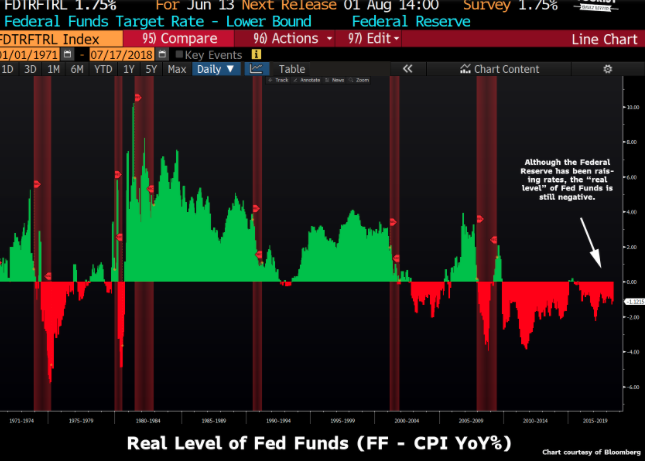
Accounting for inflation, Fed Funds are still negative! So while we can plainly see why cash is still not king for the sake of your investment dollars and on a risk/reward basis, we can also see why the Fed will need to stay the course with raising rates. Short-duration/term rates are higher than in previous years, but still not finding the Fed keeping pace with inflation. Interest rates are still low when adjusted for inflation, which means that the Fed’s monetary policy is still very easy.

Just using your own argument of inflation bears, just using your own argument.
So with all that being said and stocks looking to hold steady at the open on Wall Street today, we still have a great deal in the way of earnings to guide markets henceforth. Earnings season has just begun and while most companies have reported better than anticipated results, there are still some very heavily weighted earnings to come next week in the way of Amazon, Google and Apple to name just a few. Additionally, all has been quite on the China response-front with regards to tariffs. The S&P 500 is presently holding above the 2800 level and the VIX is showing strong complacency in the market at present.
One more thing to worry about, as we actually look to assist the bears with their drum beating. Yield curve inversion, yield curve inversion! A recession is coming, a recession is coming! Yet another drum beat by the bears that marches on in 2018, right? Did you know that the only time in the last 7 cycles where the market made “the” cycle peak ahead of the initial inversion was 03/30/1973. We have a very controversial, unorthodox and polarizing U.S. President in Donald Trump. The markets in the U.S. and around the world are attempting to balance the U.S. President with risk/reward. So go back to 1973 and see what caused that outlier in the cyclicality of markets over the stated 7 cycles. What do you find! Here’s a link for ease of discovery. Nice find by Tony Dwyer of Canaccord Genuity!!
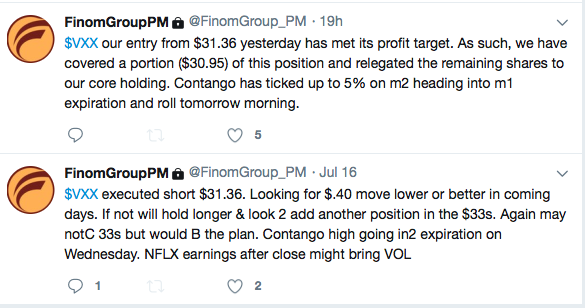
There is always a trade out there to be made as earnings come rolling in and our trade of the day yesterday was found within the volatility complex and as earnings produced some back and forth in the markets. Finom Group’s most recent trade was completed on shares of VXX as displayed in the screen shot below, taken from our subscriber, private Twitter feed.
Volatility or the VIX has been on a steady decline post the Q1 reporting season and is currently nearing levels not seen since the turn of the calendar year. From a present VIX reading below 12%, institutional investors may shortly be found buying “cheap” protection. Then again, after a long fought consolidation period that finds earnings growth strengthening, that protection buying may be put off until found necessary.


