
While investors, traders and all market participants await the latest Consumer Price Index (CPI), due out this Wednesday, here are some interesting thoughts and analysis from around the web.
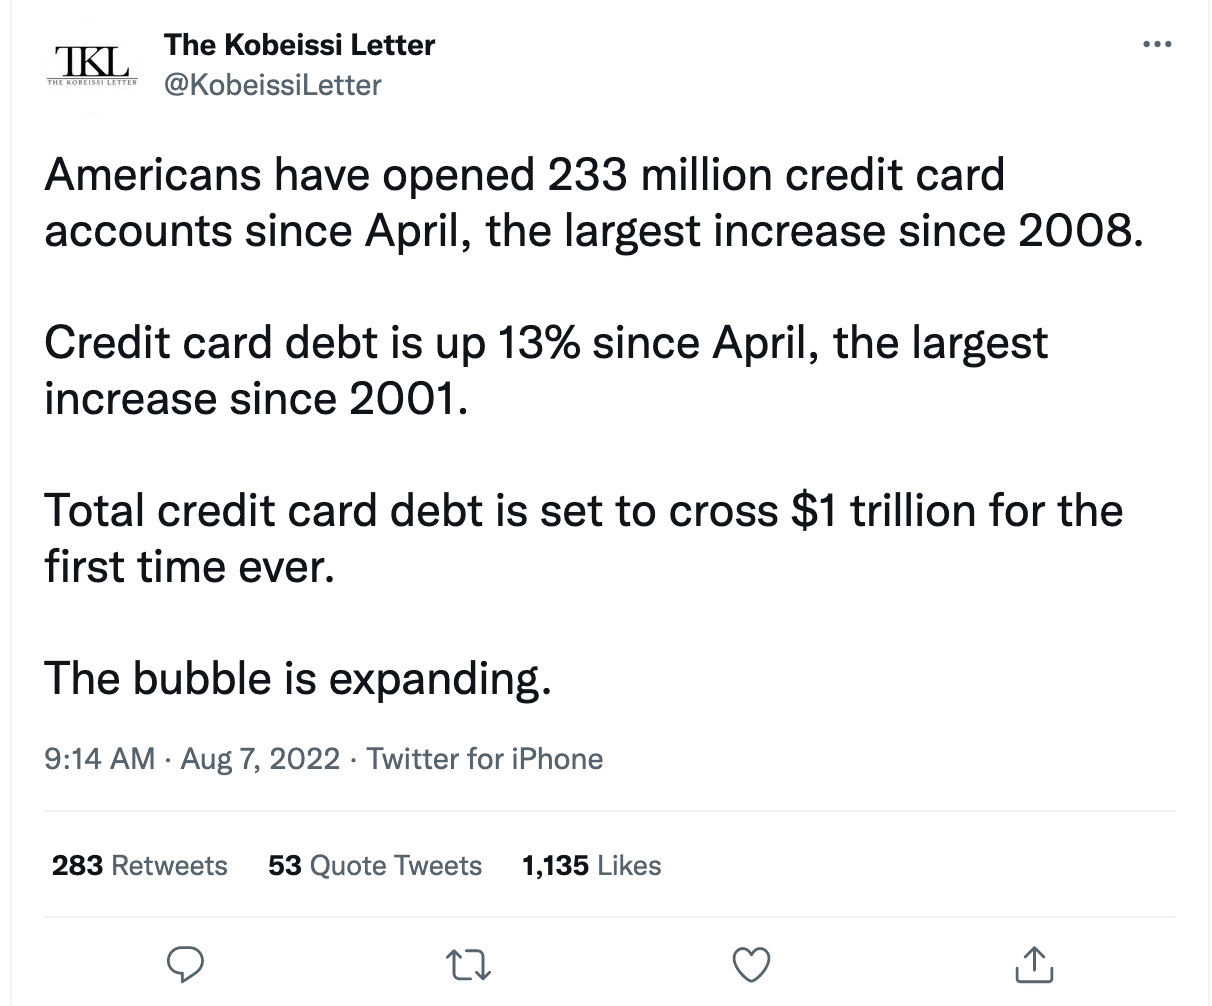
The above tweet from the Kobeissi Letter Twitter account is typical of the account holders bearish sentiment that pervades many investors. We strongly encourage avoiding such Twitter accounts and/or financial services. Debt grows, especially on a per capita basis. It is supposed to, based on our economic system, and has been doing so for some 50 years. Here’s the best way to rationalize higher levels of consumer debt…
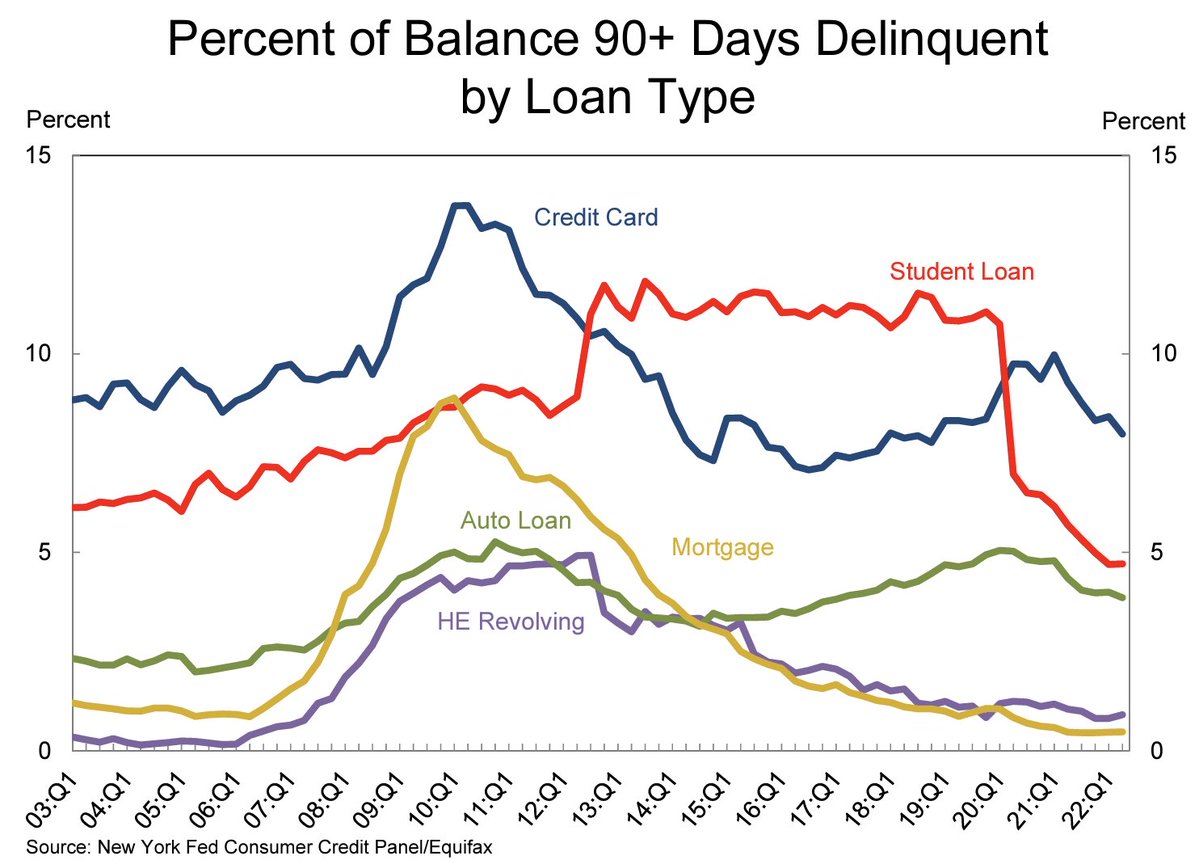
… If we accept that debt naturally grows, and is a sign of economic strength not weakness, what matters most is the serviceability of the debt accrued. One of the best measures of household debt serviceability is offered on a quarterly basis. It is known as the New York Federal Reserve Bank’s Household Credit and Debt report. As we can recognize within the NY Fed’s report, most every consumer debt categories has risen. More importantly is that the delinquency rates continue to fall. As shown in the chart above, the 90+ Days Delinquent rate for almost every loan type continues to fall. This informs that households that have been increasing their debt, are able to service it responsibly on a monthly basis. That was not the case in 2000-2001 or leading up to the Great Financial Crisis.

The U.S. added over 520K jobs during the month of June and the unemployment rate fell to 3.5% from 3.6%. This marks the lowest unemployment rate since February 2020. (chart and commentary from Sam Roe of Tker.com) Even so there appears to be no such thing as good sentiment for the labor market! The period after 2009 we spent years talking about a “jobless recovery.” Today we spend the majority of the time denouncing a “job-full” recovery. You cant please anybody unless you express concern and dissatisfaction with the economy, all the time if you want to partake in social media.
This is an almost unbelievable update from the BLS, considering how much U.S. economic growth has been cooling. However, it is in line with other labor market data, which shows layoffs remain low and job openings remain high. It also confirms that the U.S. economy is not in a recession, as employers continue to add hundreds of thousands of jobs month in and month out.
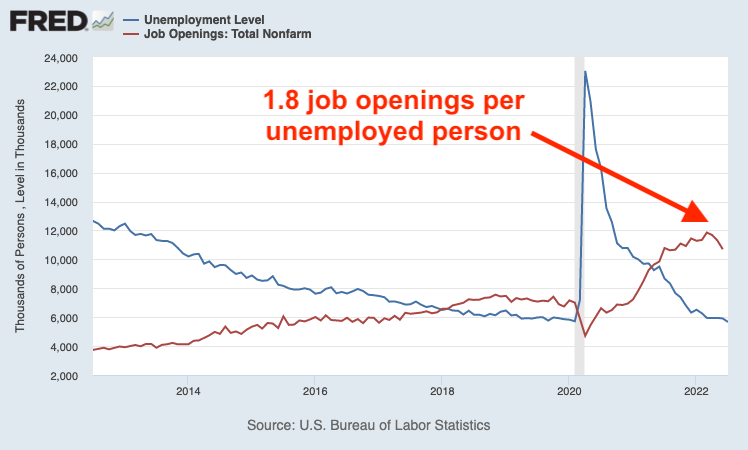
The number of job openings fell sharply in the latest JOLTS report/survey. However, there remain 1.8 job openings available for every unemployed person. These are definitely not recessionary conditions and it will prove very difficult to achieve a recession with these employment and labor market conditions.
Jeffries: “Forget recession; market narrative should be shifting to stronger for longer. Total income from wages & salaries is set to accelerate to 0.8% m/m, when inflation is slowing sharply. This will cause real wages/income/spending/GDP to accelerate sharply in Q3.”
The U.S has averaged 388k job growth over the last 4 months. This is the only time in history job growth has averaged better than 300k with 2 consecutive quarters of negative GDP. If there was ever a time to define “this time is different”…
Also, remember the Sahm rule…

… “Sahm rule” recession indicator is not even close to signaling a recession. The Sahm rule states that the unemployment rate will need to rise at least 50bps to signal recessionary conditions. the unemployment rate just fell from 3.6% to 3.5% in the latest BLS Nonfarm Payroll report, with forecast around 3.2% by year-end.
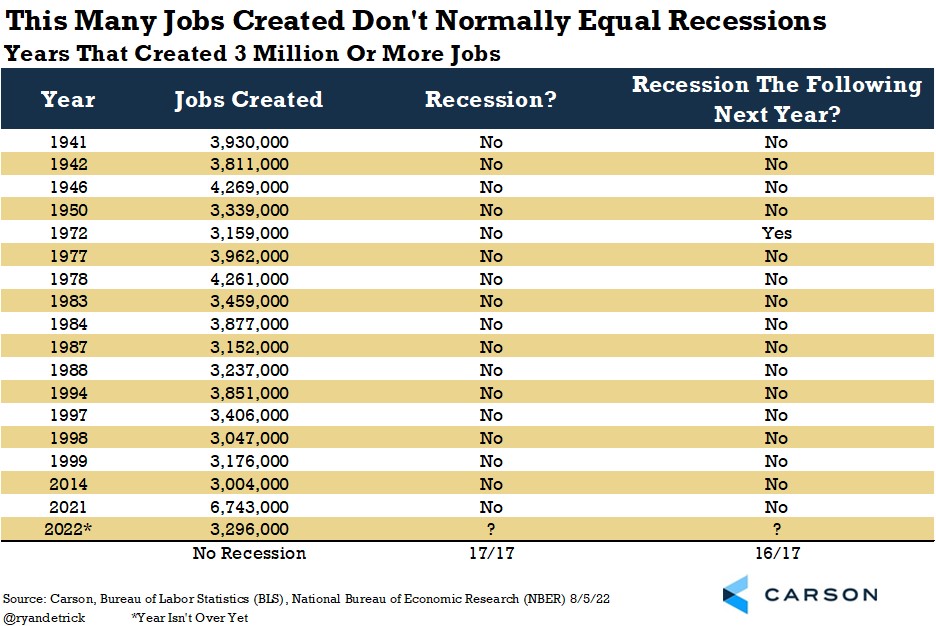
The U.S. Economy has created nearly 3.3 million jobs this year. There have been only 17 other times it made that many jobs during the year. Never once has it gone into a recession during that calendar year and only ONCE out of 17 did it go into a recession that following year, 1973. (Ryan Detrick)
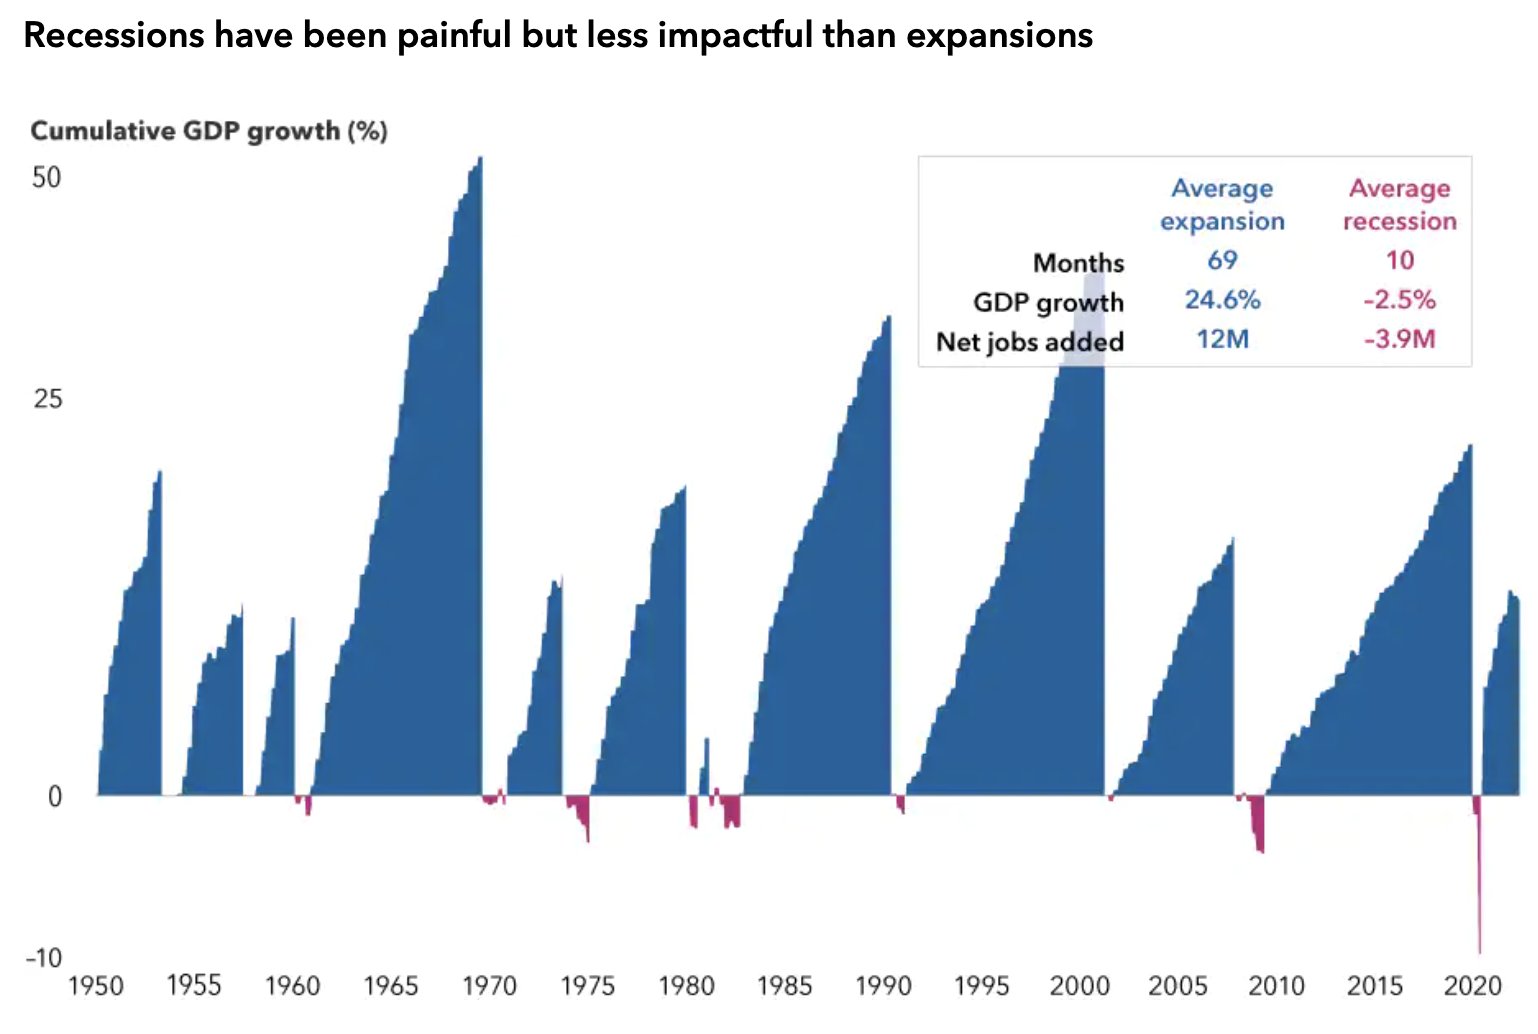
Recessions have the briefest life cycle of an investors’ career, yet many will spend the majority of their time worrying over a recession. Why do many investors fail to achieve their investing goals? Misappropriated time and emotions can often provide the answer.
Fundstrat’s Tome Lee:
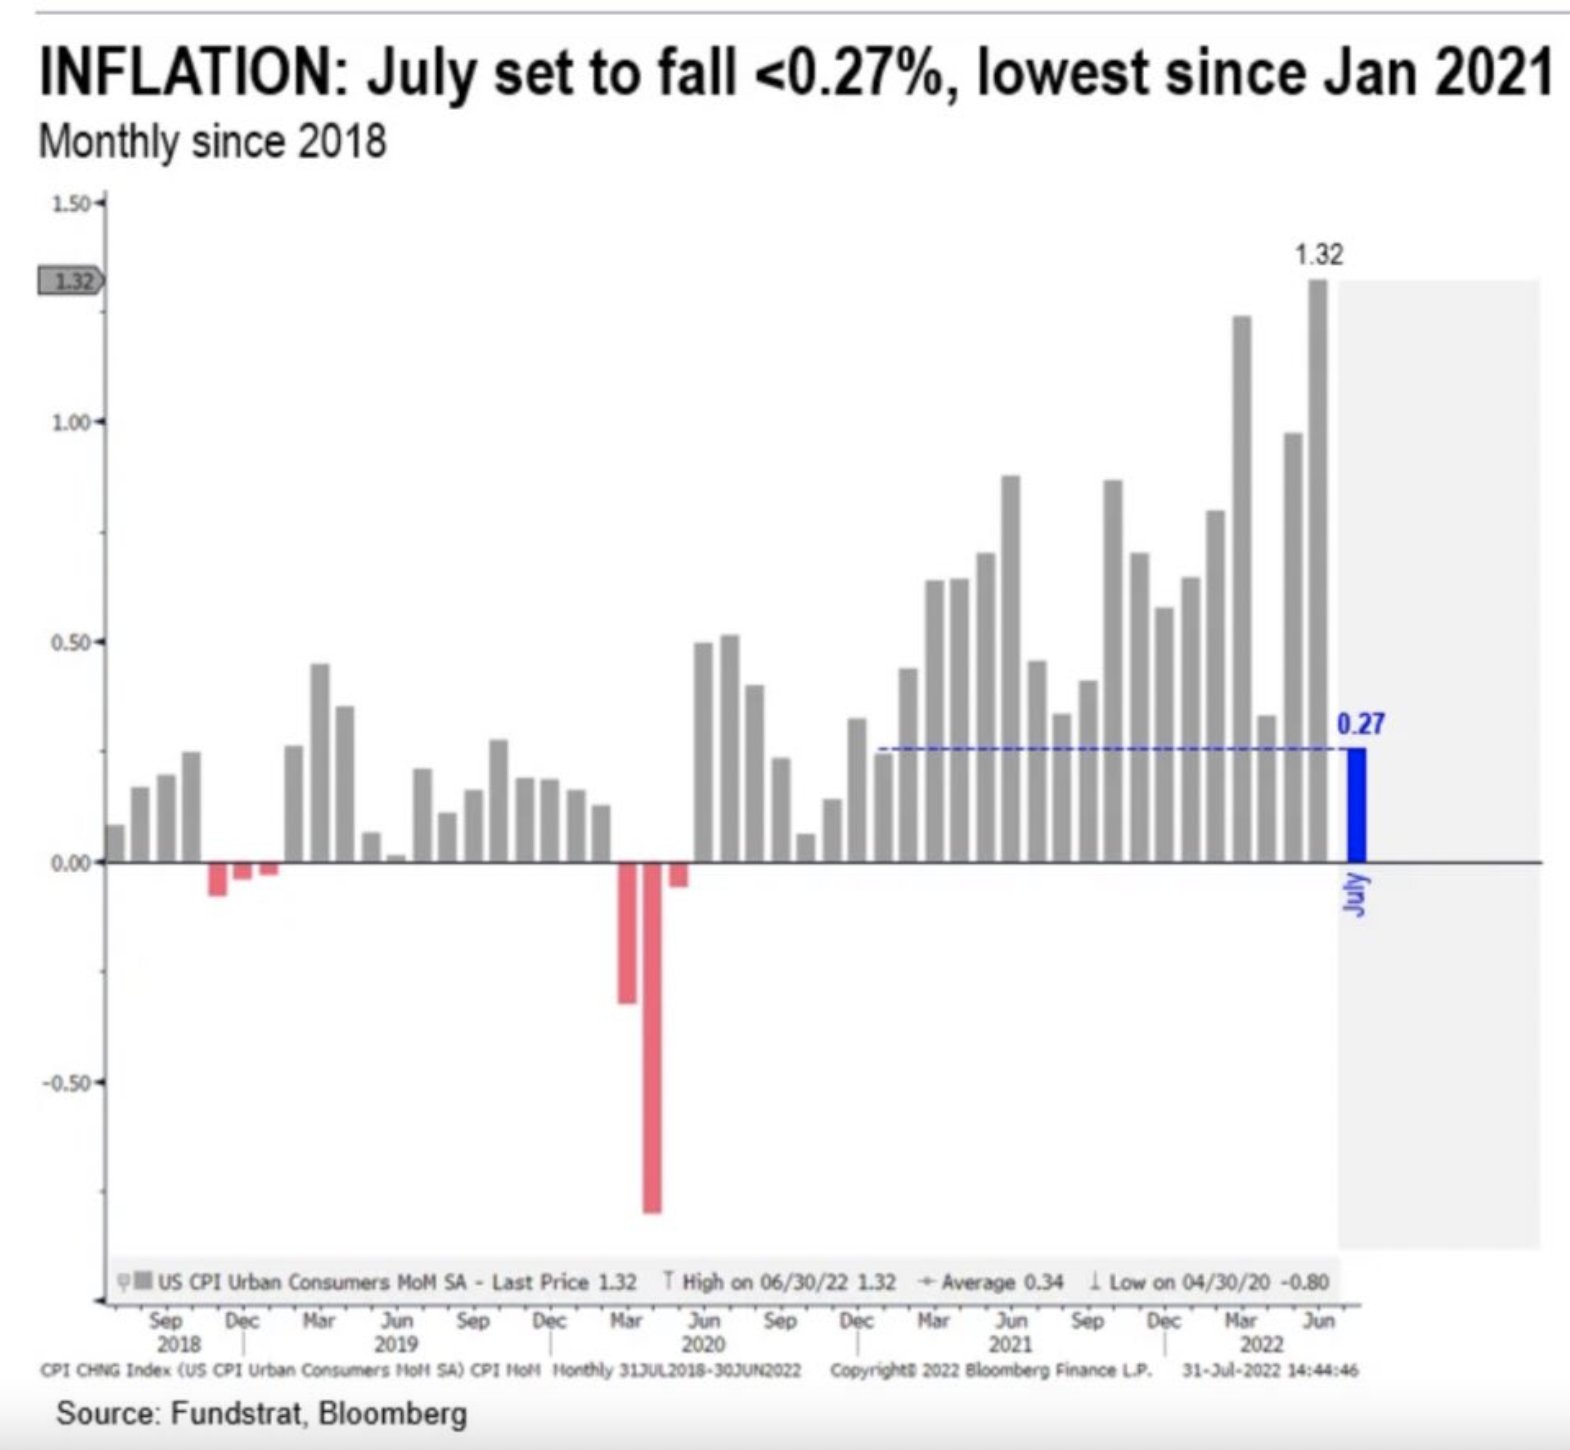
Inflation could have its biggest negative rate-of-change since January 2021. Also, there is still a good probability that the June low in the market was the low based on history of rate hikes.
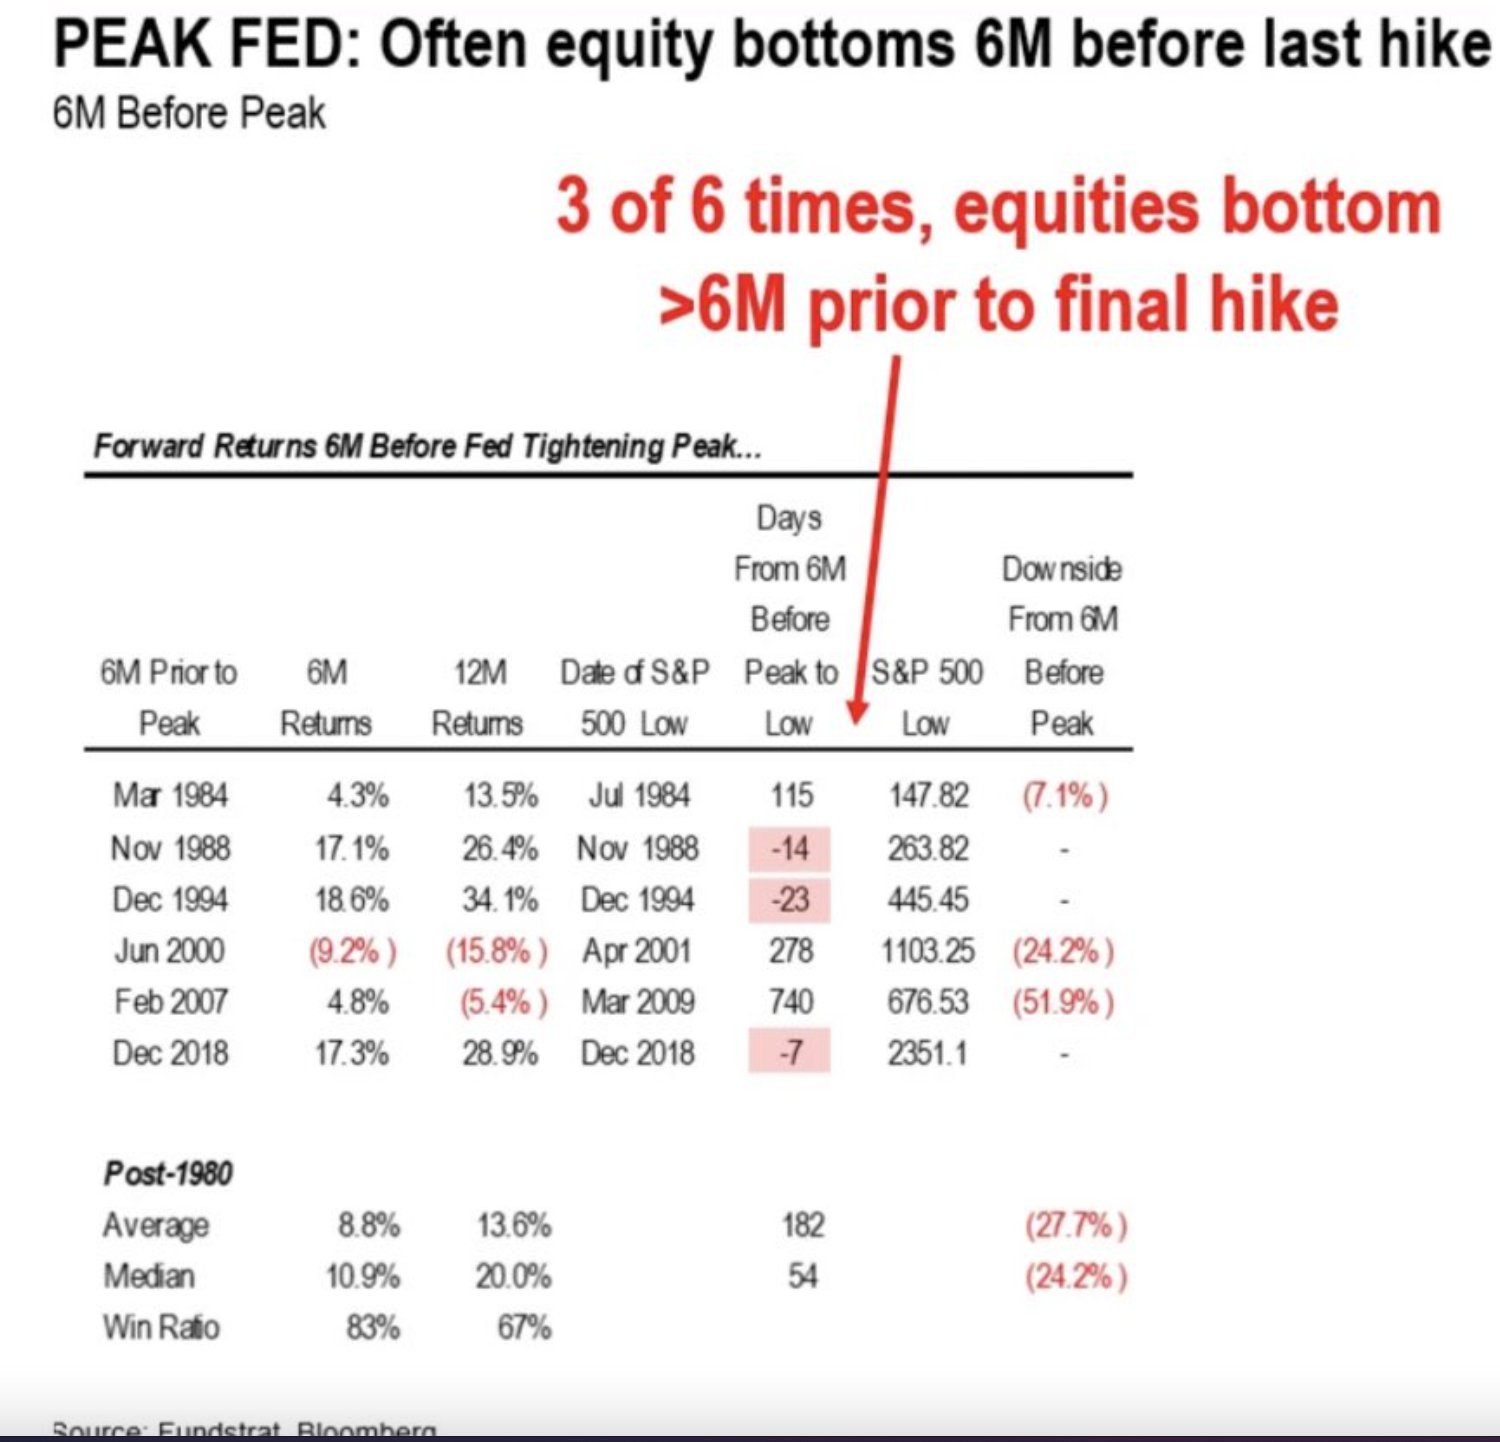
Stocks have usually bottomed greater than 6 months before the final rate hike. There is currently a strong bid for a 75bps rate hike come the September 2022 FOMC meeting. Keep in mind that there is no FOMC meeting for the month of August, as the FOMC Committee meets for the annual Jackson Hole Summitt.
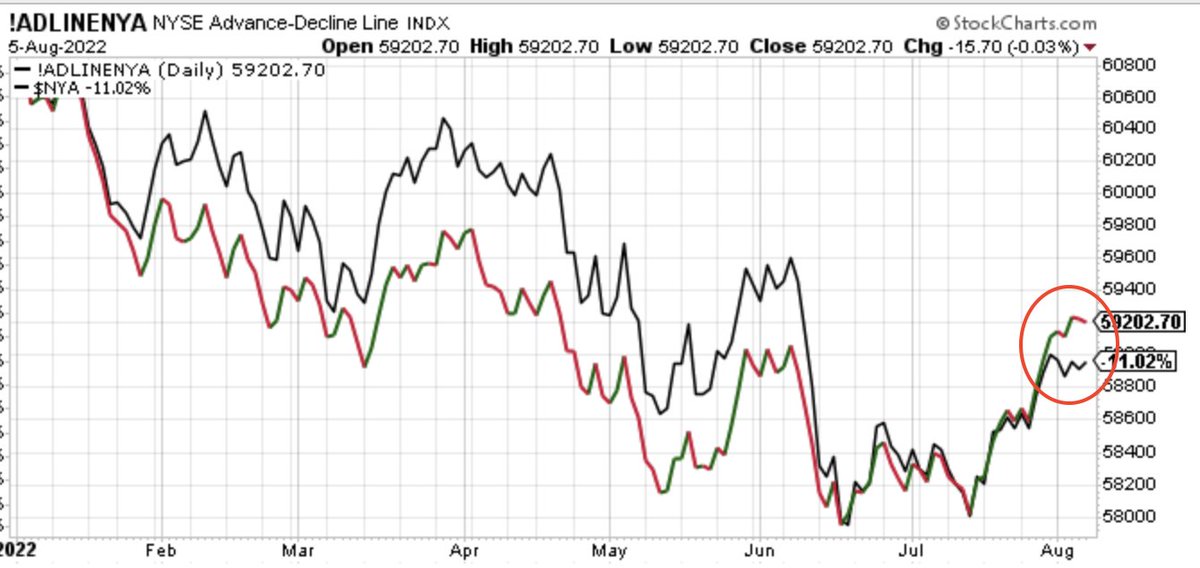
Chart of the Week:
The NYSE A/D Line climbed above its June highs. The NYSE, however, is not quite back to its respective June highs and diverged in August. There is a technical analysis rule of thumb that suggests “breadth leads price”. If this rule of thumb holds true, it would find the NYSE getting above its June highs near-term. It’s not too far from it as of this past Friday’s close.
Tom Bowley:
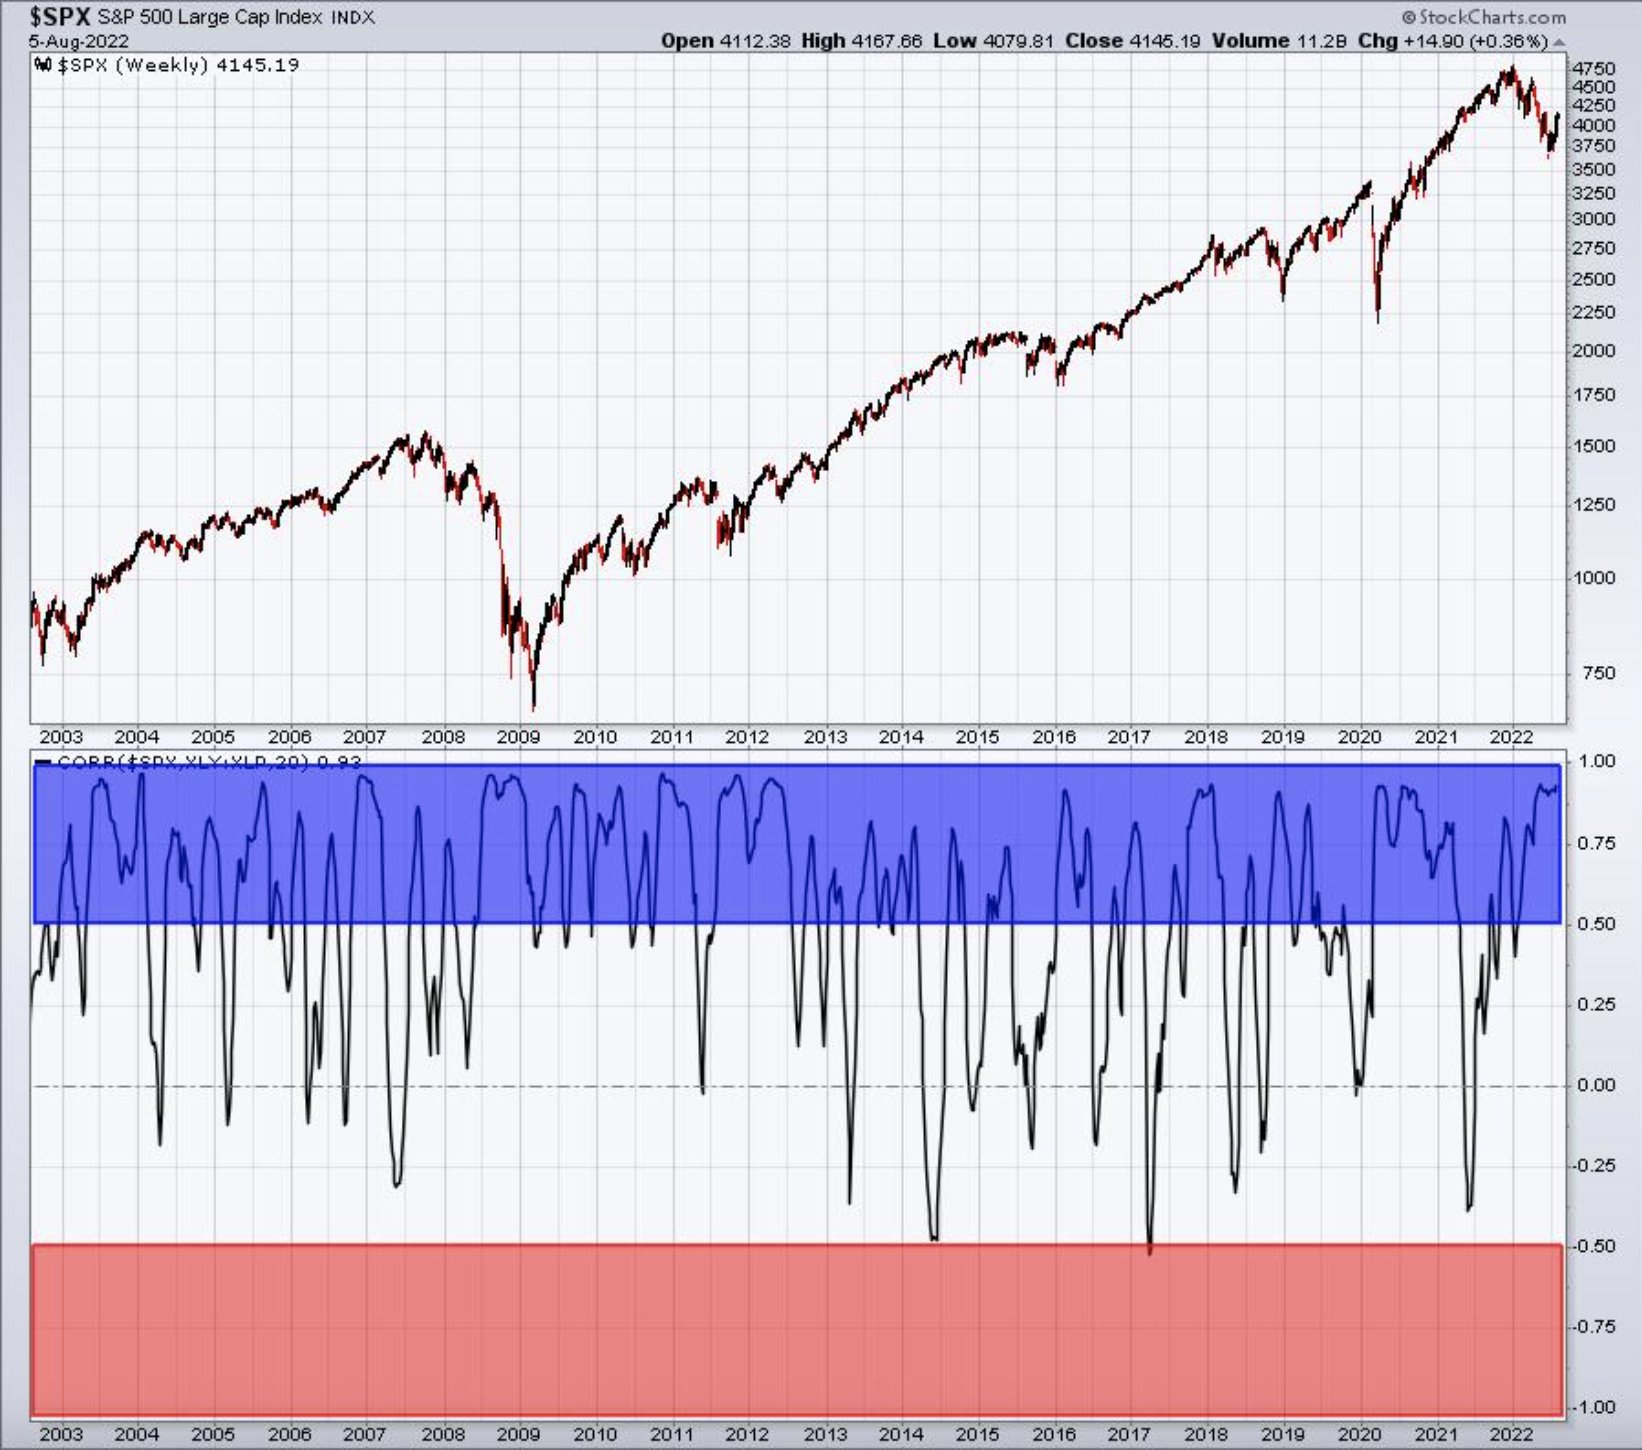
There has been a positive S&P 500 – Consumer Discretionary:Consumer Staples correlation during the most recent market rally. A heavy rotation into Consumer Discretionary stocks has been present since the June lows, suggesting investors were willing to invest in cyclicals once again, and avoid the more defensive areas of the market. Investors believe in the strength of the economy. Strip away all the macro-narratives; this chart tells investors what matters.
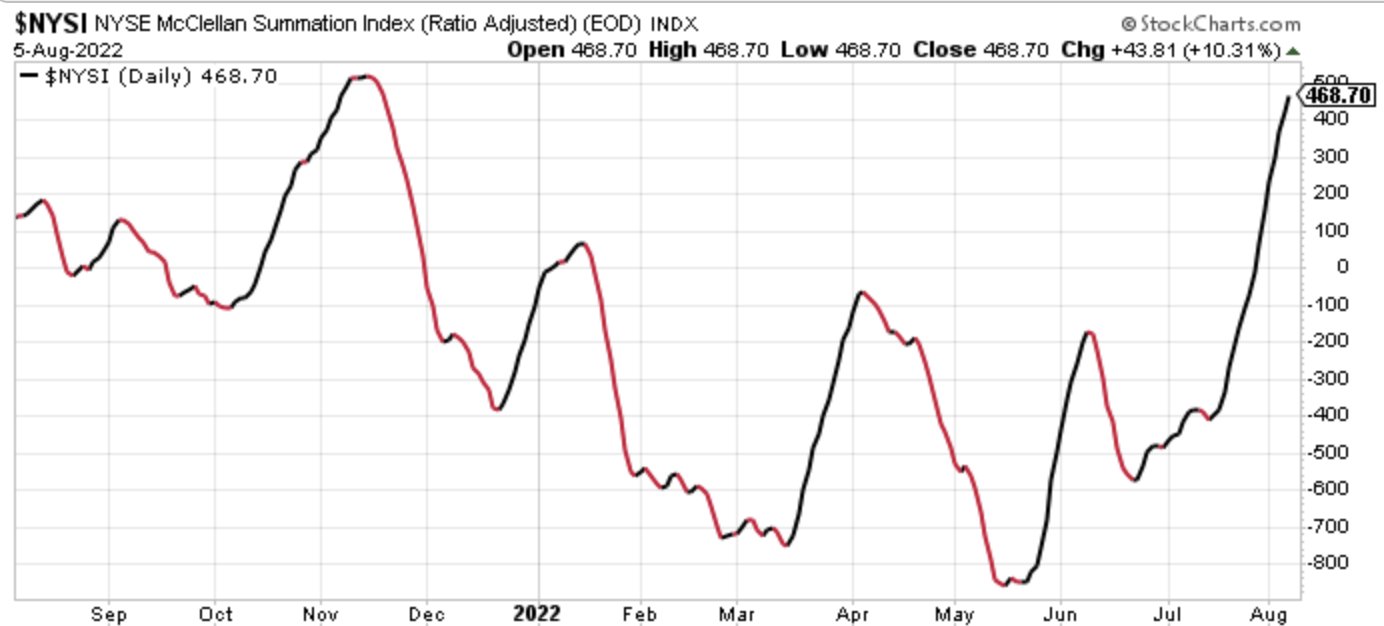
NYSE Summation Index (NYSI) is on the verge of crossing 500, after a market correction of greater than 10% (1st chart). Since 2003: 2003, 2009, 2010, 2011, 2016, 2018, 2019 and 2020, all bullish signals. 2nd chart and comments are from @ukarlewitz (blue perp. lines = signal).
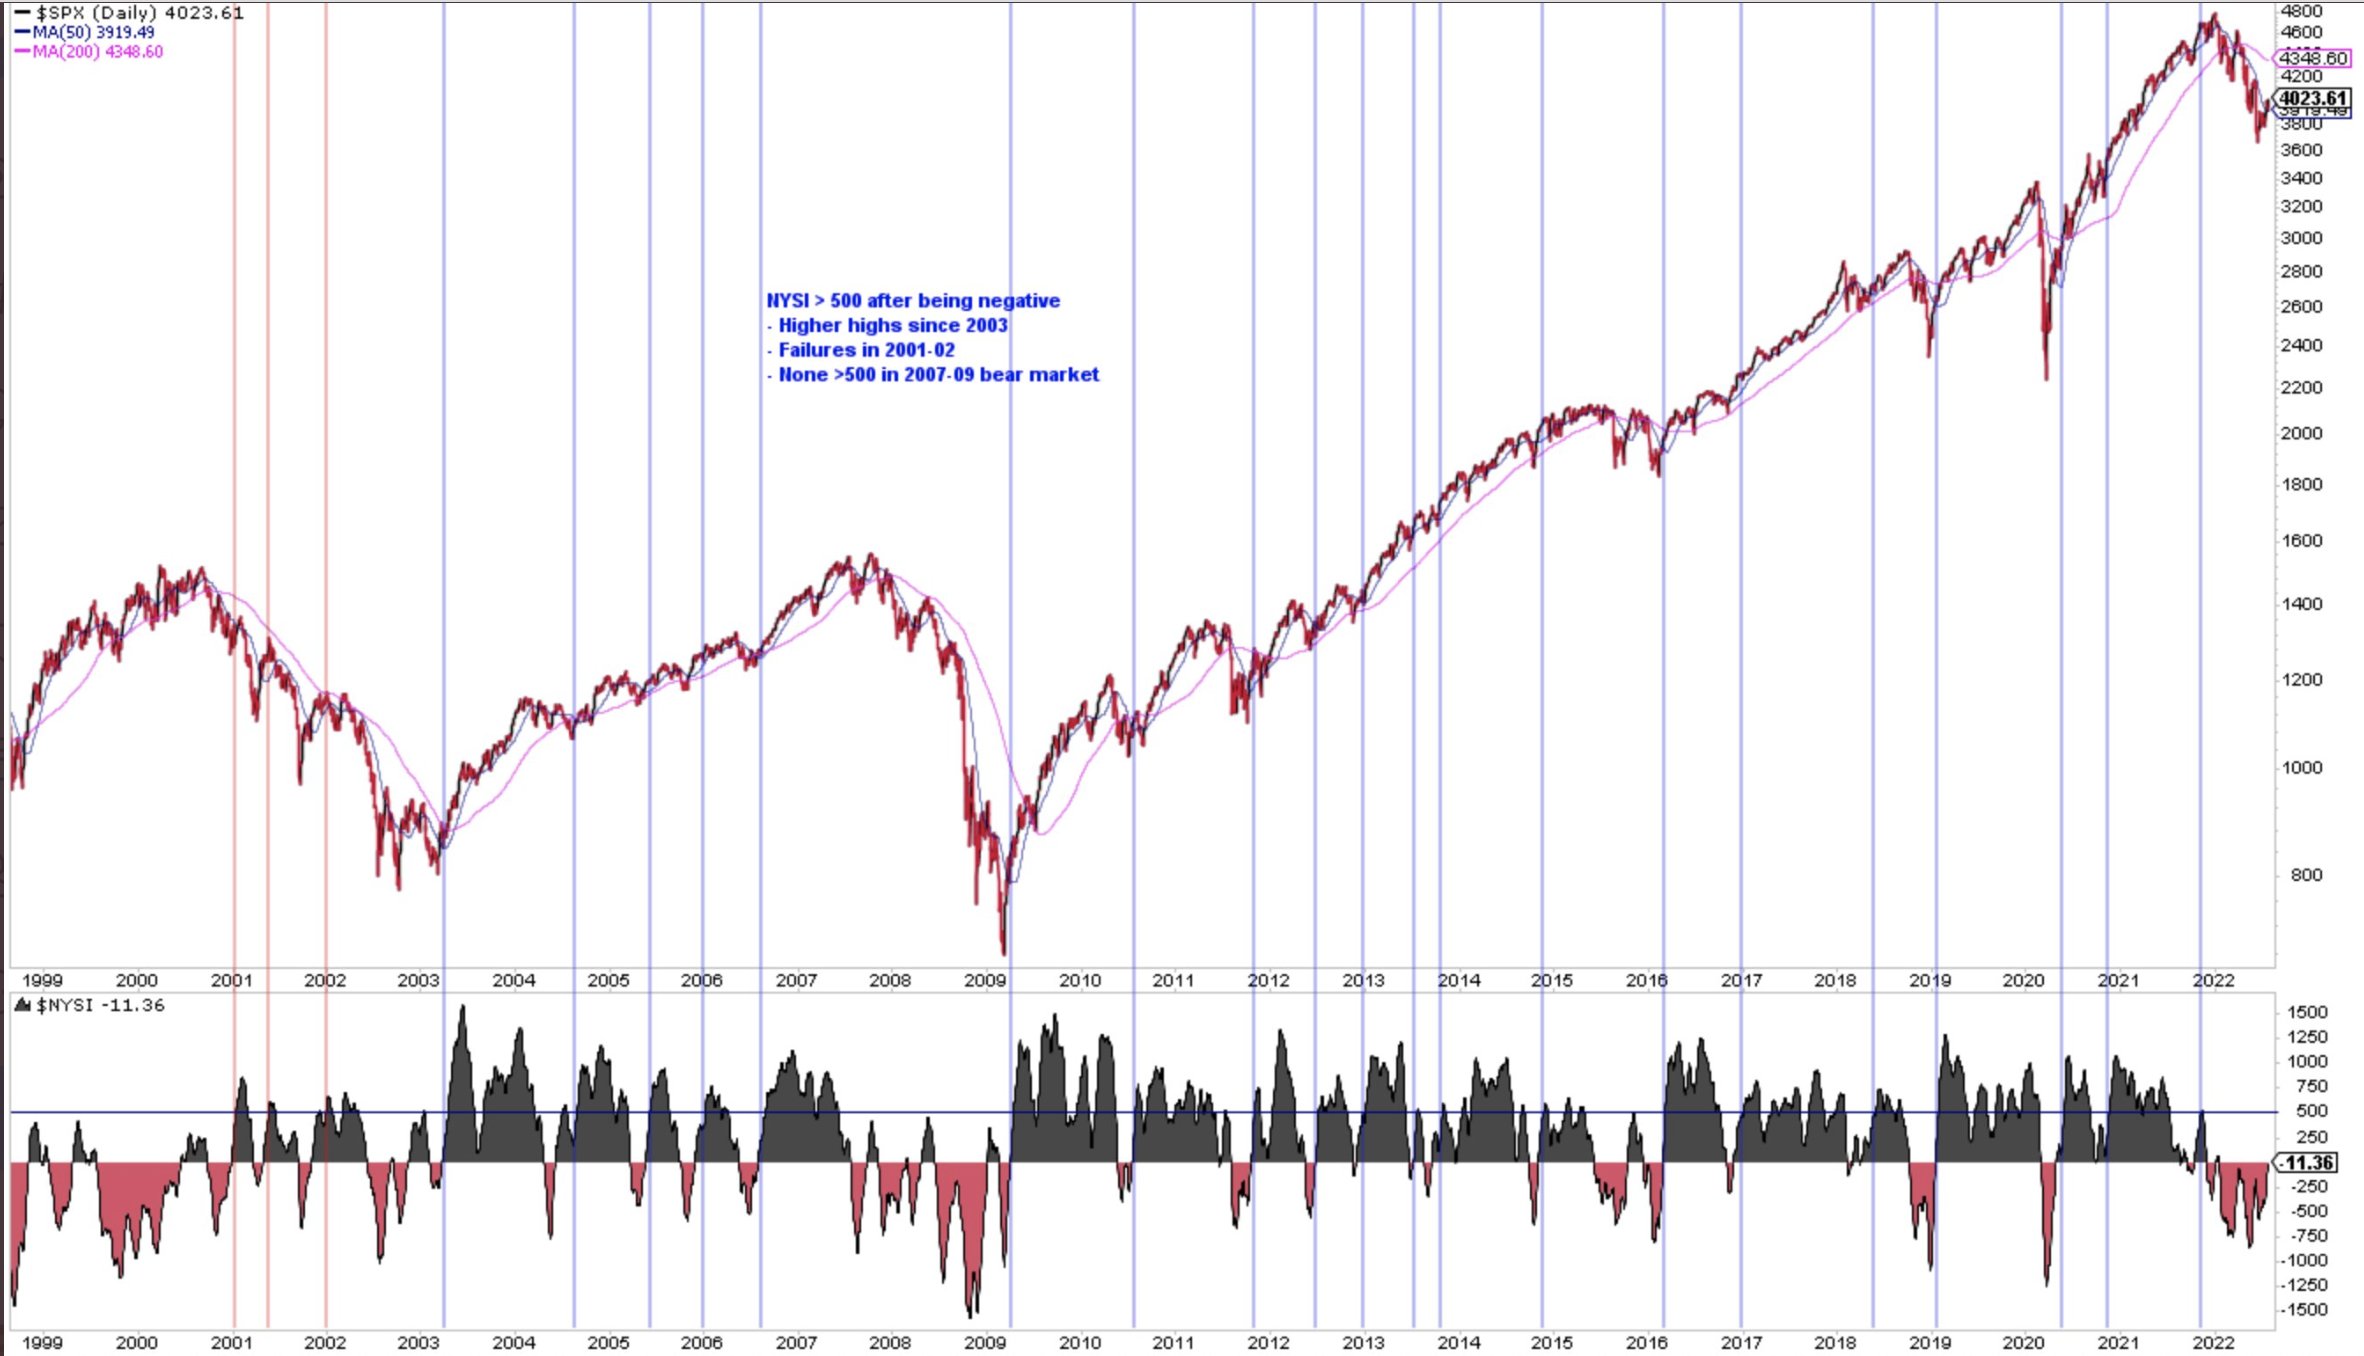
Don’t forget what we outlined about the NYSE Summation Index previously.
“Market’s bounce off July lows could have further to go as inflation pressures start easing”, Stifel’s Barry Bannister. The firm’s chief equity strategist hiked his year-end S&P 500 target to 4,400 from 4,200. The new target implies upside of 6% from Thursday’s close.

- Historically, when the NYSE Summation Index cycles from below -750 to UNCH, a Bull Market formed.
- Negative -750 in March and rallied back up to -100.
- Dropped to a low of -850 in May and has been rallying ever since.
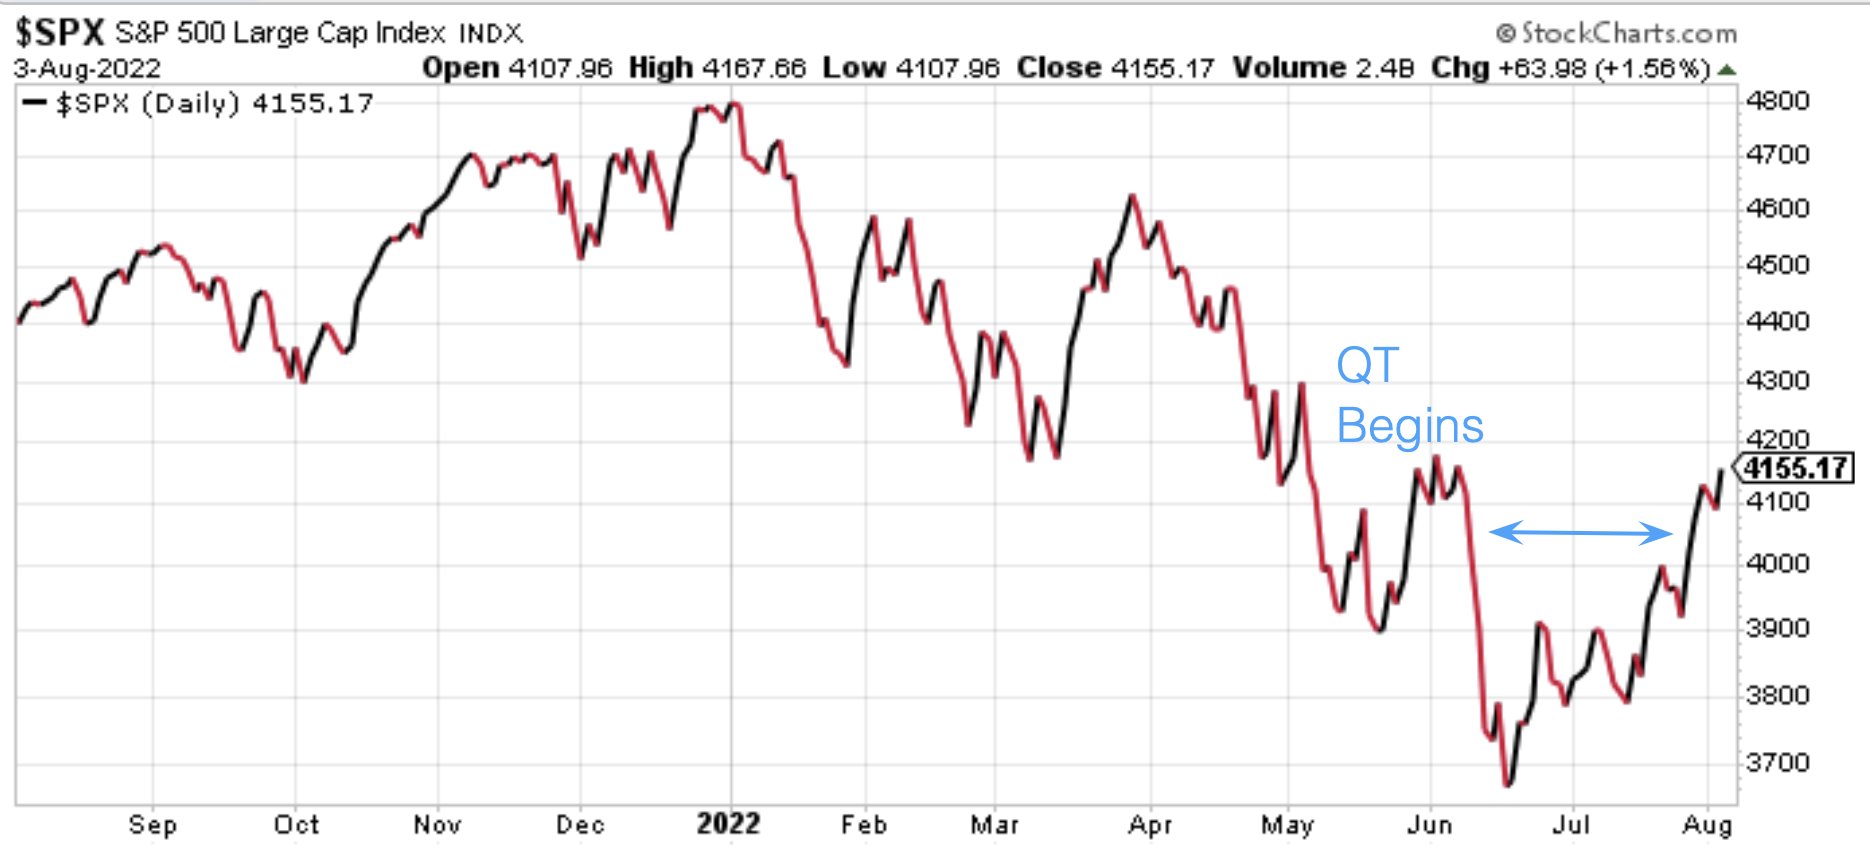
There has been great concern and outright fear of the Quantitative Tightening process, whereby the FOMC reduces its balance sheet. QT began its latest cycle in June of 2022, and continues forward at a pace of roughly $45bn a month until September where it climbs to roughly $95bn a month. Notice that the S&P 500 was trading around 4,150s back in June when QT began, and trades around this same level here in August. For more insights and myth busting about the feared QT, please feel free to watch our video on the subject matter from April 2022.
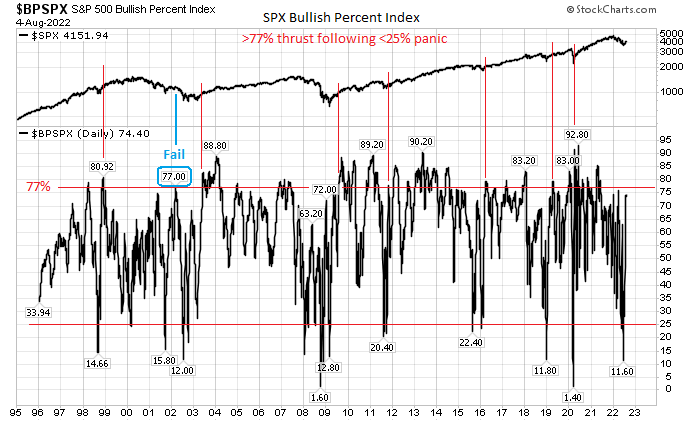
S&P 500 Bullish Percent Index (BPI):
The S&P 500 Bullish Percent Index remains short of the 77% threshold that has signaled cyclical advances since 1998. The only time it failed was in mid-2002, during the post 9-11 year recessionary economic conditions. Currently at ~74. (Mark Ungewitter)
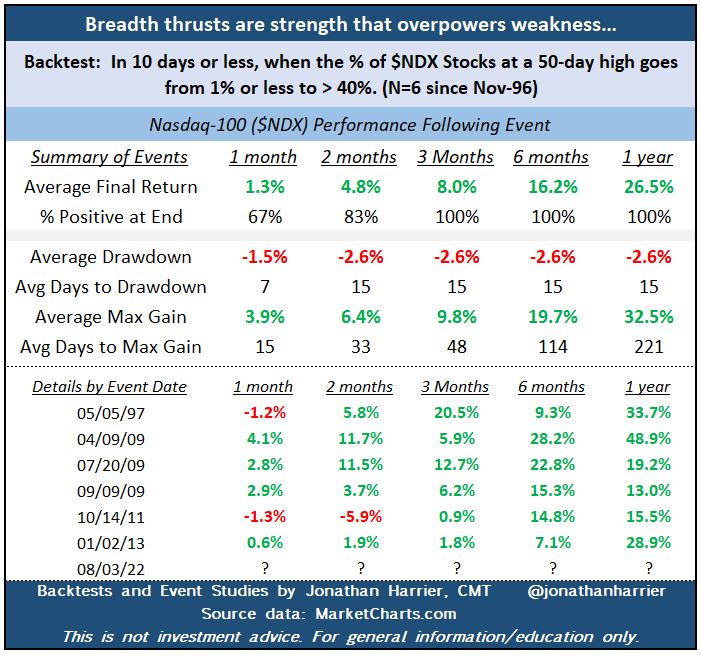
New breadth thrust measure for the Nasdaq 100:
When the % of Nasdaq-100 stocks are at a 50-day high goes from </= 1% to > than 40% within 10 days. Drawdowns early & low 1 Year Average: +26% with -2.6% drawdown. All up at 3/6/12 months. Summary data & event specifics in the table provided by Jonathan Harrier.
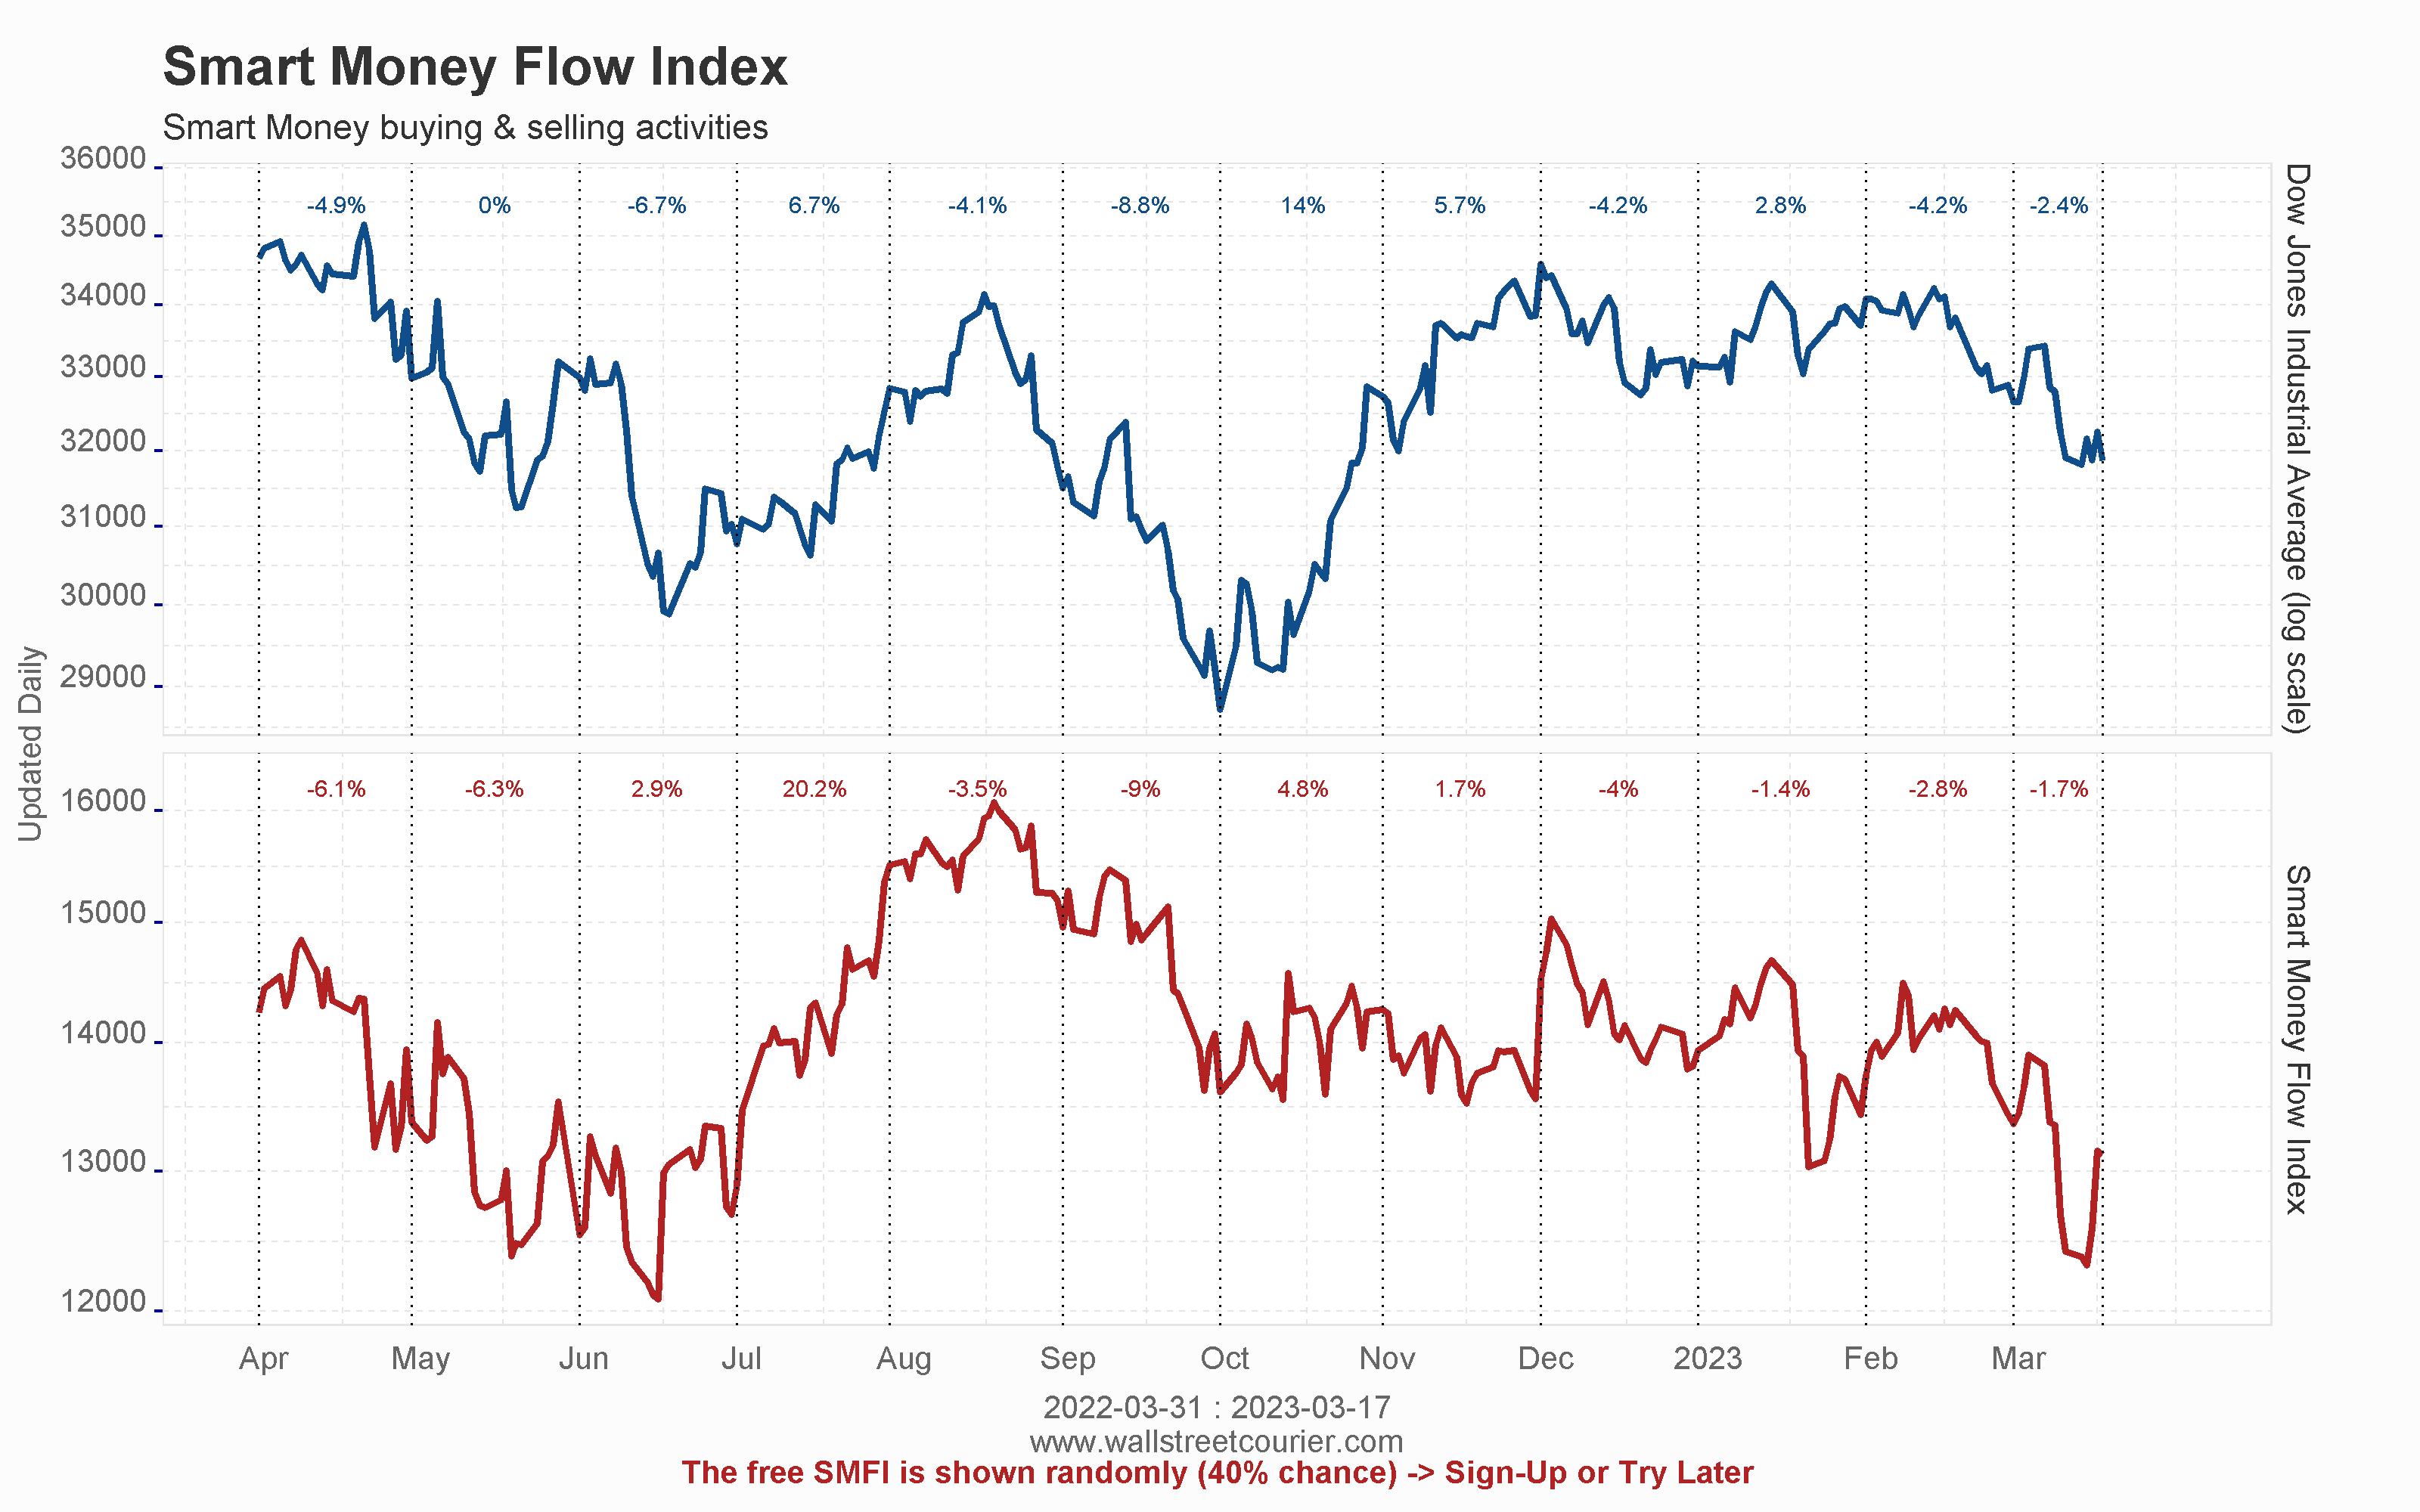 Smart Money Flow Index (SMFI):
The Smart Money Flow Index is calculated according to a proprietary formula by measuring the action of the Dow during two periods: shortly after the opening and within the last hour. The first minutes represent emotional buying, driven by greed and fear on the part of the crowd, based on good and/or bad news. During the opening, there is also a lot of buying on market orders, as well as short covering. Smart money typically waits until the end, and they tend to test the market beforehand by shorting heavily in order to gauge the market’s reaction. Afterwards, the big investments are made. These heavy hitters tend to have the best possible information available, and they have an edge on all the other market participants.
They have continued to buy into August. CFTC report sees increased long S&P 500 Futures institutional positioning, reduced shorts. Non-Commercial hedgers added short futures exposure during same period.

The earnings growth rate for the second quarter is 6.7% for week end 8/5, compared to an earnings growth rate of 5.8% last week and an earnings growth rate of 4.0% at end of the 2nd quarter (June 30). While Q3 and Q4 EPS estimates have been revised lower to inject a lowered full year 2022 EPS, we wouldn’t be surprised to see consistent beat rates in the Q3 earnings season come November. Our outlook presently considers some growth re-acceleration in the back half of the year.
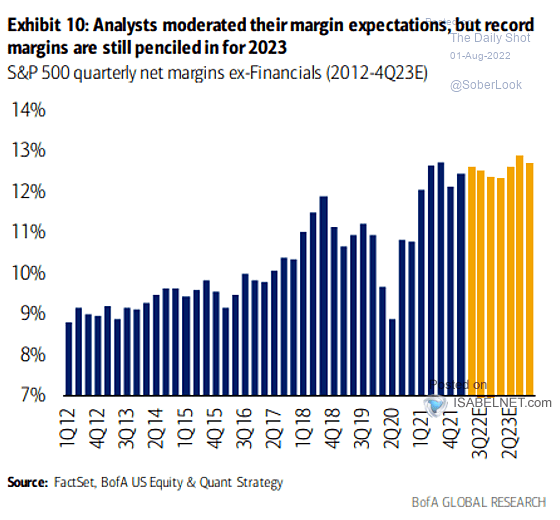
The financial media pundits have been telling us “it’s peak margins” for nearly a year now. Nothing peaks for a year! That’s called plateauing! We may not see margins go higher immediately, but a peak infers a descent, which hasn’t occurred either. Oh financial media!
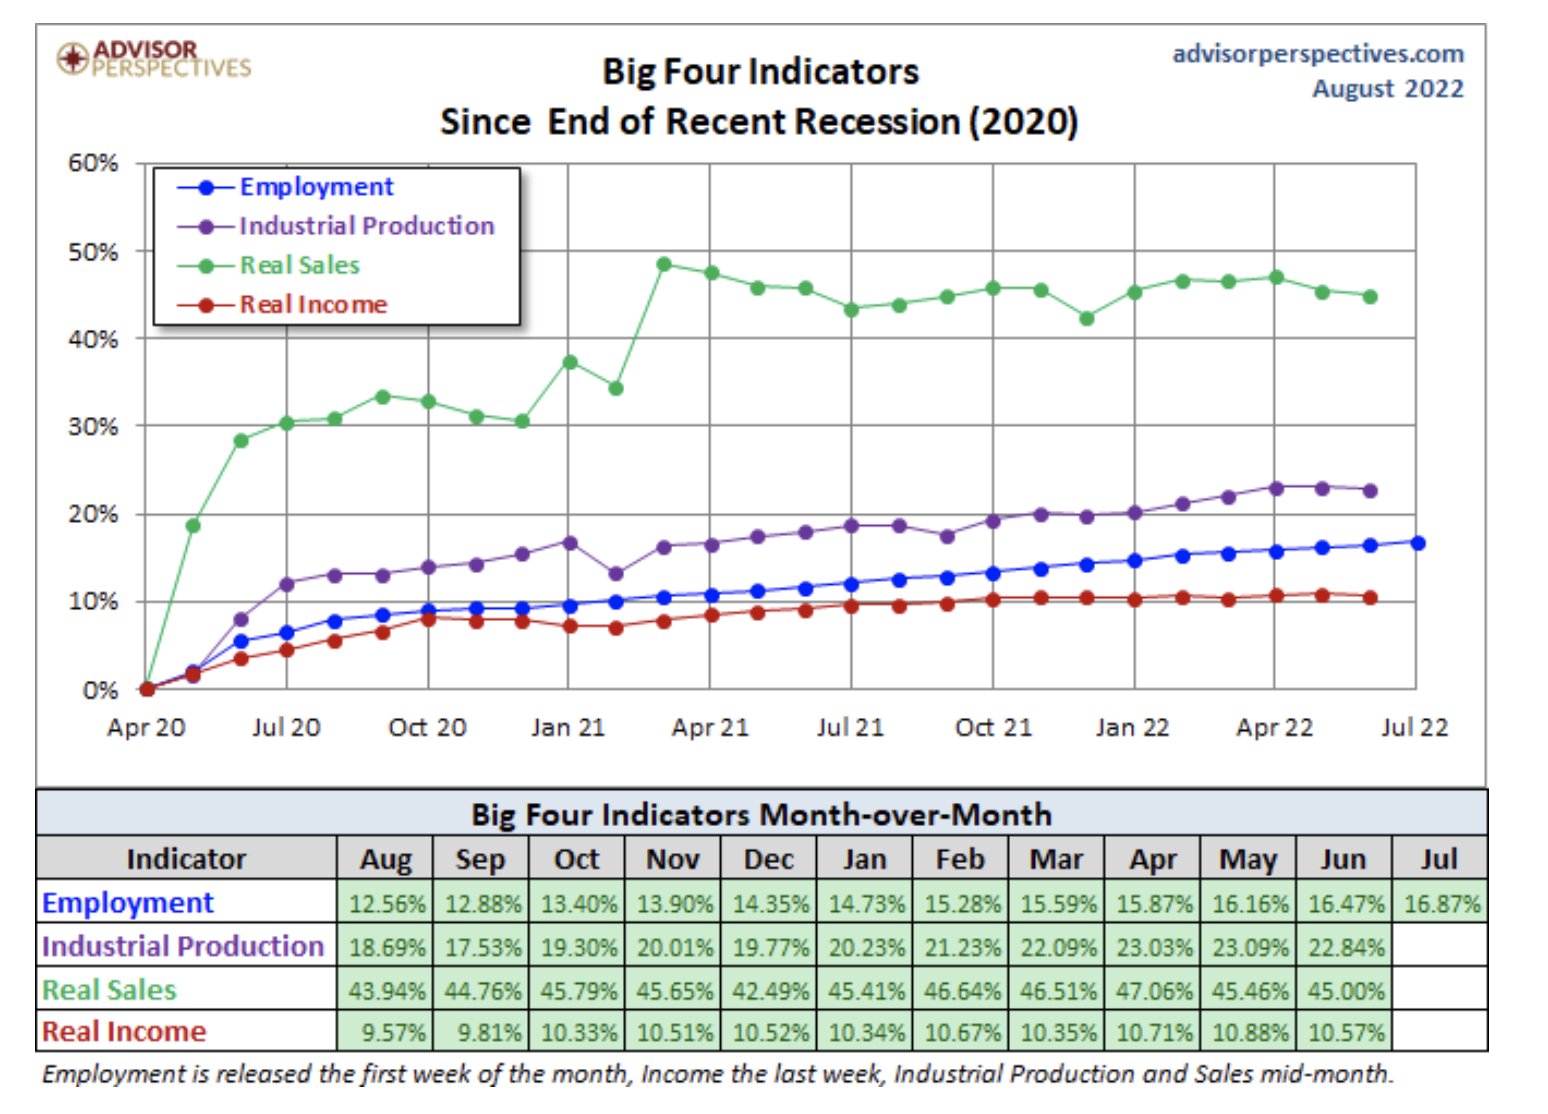
Big 4 Indicators:
Starting the new monthly series in the green and after the latest Nonfarm Payroll report. Industrial Production and Real Sales will likely remain positive. If the trend is reliable the economy is still likely to see 2 months of Real Income growth ahead. No, if ECRI weekly is your focus, you aren’t following proper cyclical weightings in this economy cycle.
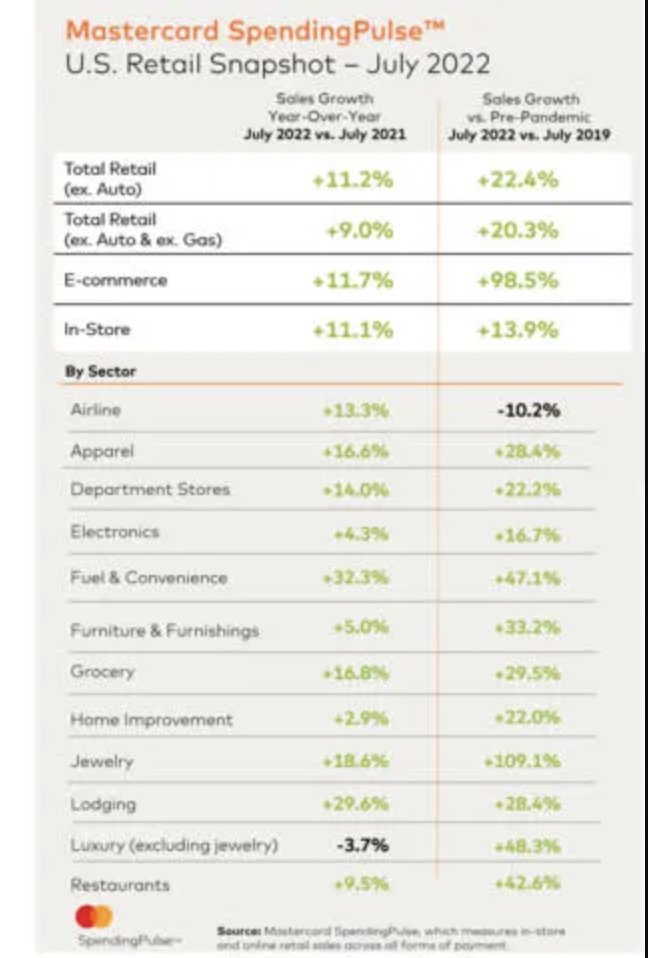
Mastercard SpendingPulse:
Retail spending excluding automotive increased +11.2% YoY in July, while retail sales excluding automotive & gas rose +9.0%. E-commerce sales were up 11.7% YOY, a sharp increase after months of softer growth. This has been the highest YoY growth YTD from the June reporting cycle!
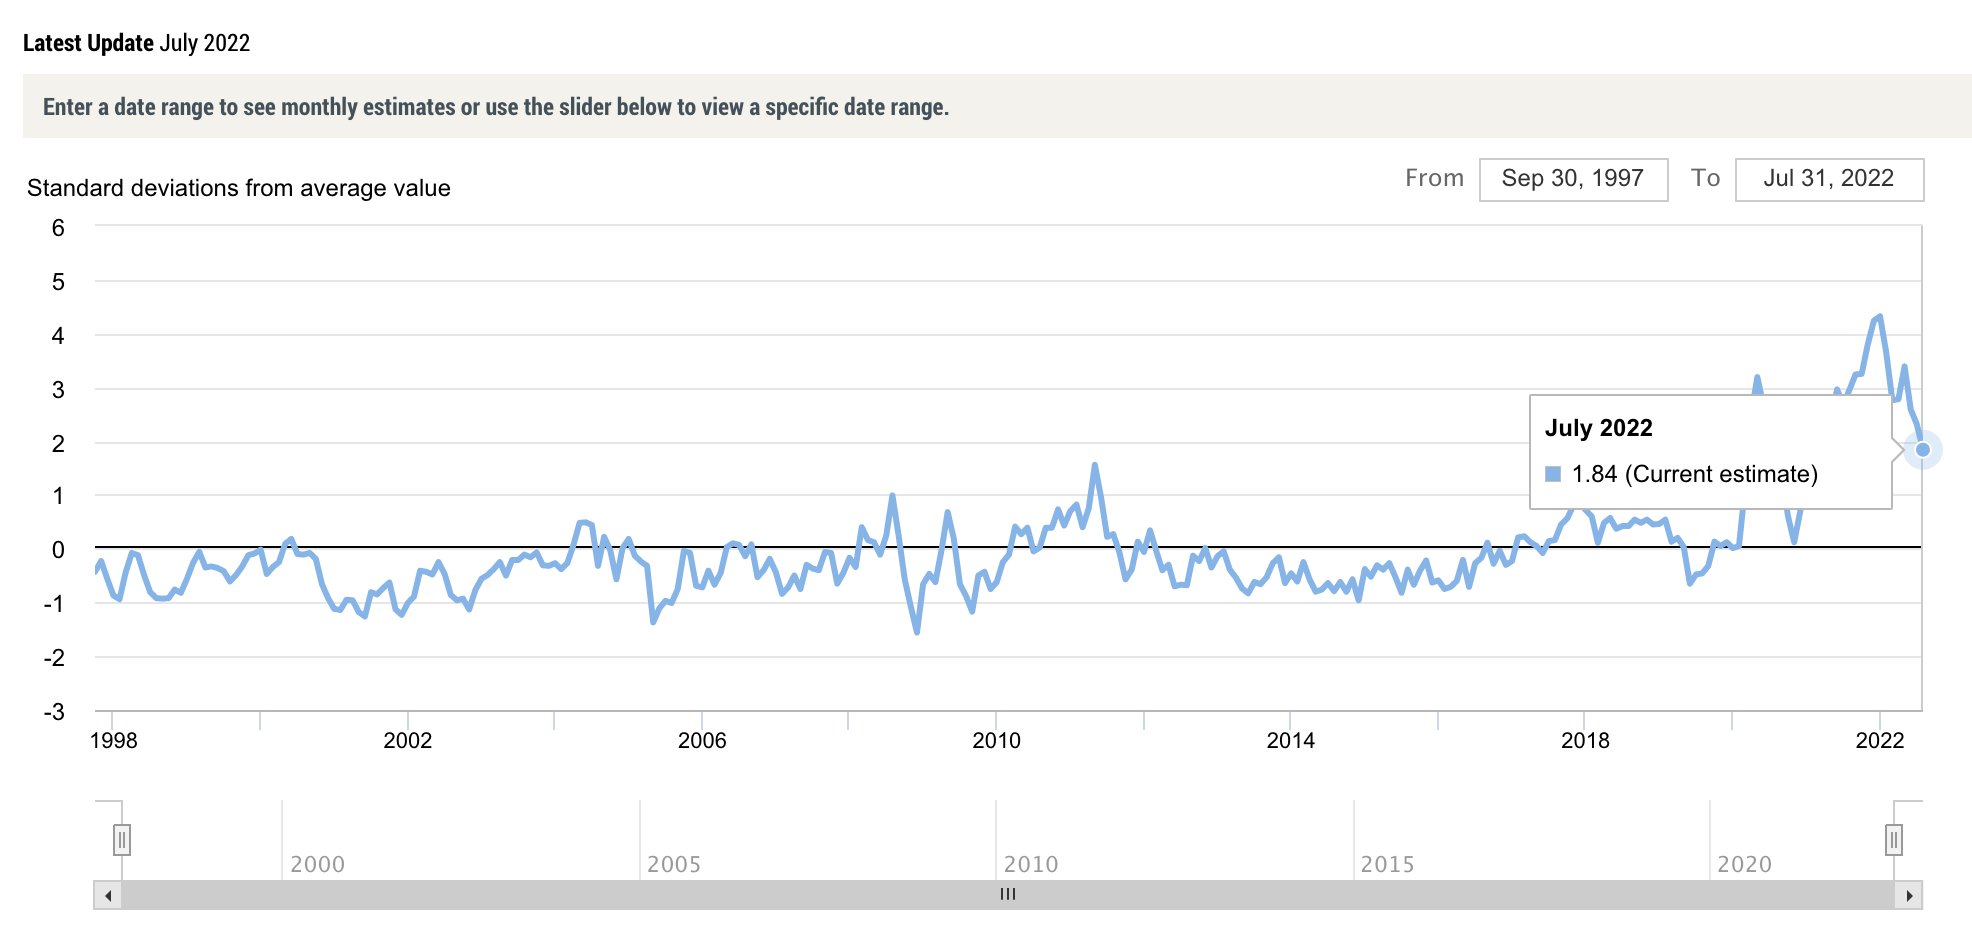
NY Fed Global Supply Chain Pressure Index continues to show improvement month-after-month. Best level since February 2021.


