
Welcome back to the markets and what promises to be a very light trading day. U.S. equity futures are pointing to another negative open on Wall Street after the Thanksgiving Day holiday. Wednesday proved to be another bearish day even with the Dow Jones Industrial Average (DJIA) and Nasdaq (NDX) finishing basically flat and the S&P 500 (SPX) finishing higher by 8 points. The problem with the end result for the major indices on Wednesday was that they were all significantly higher than where they closed. At one point on Wednesday, the Dow was higher by just over 200 points and gave up the entire move. Instead of buying the dips, investors continue to sell the rips, as fears over slowing growth, a strong U.S. Dollar, trade war with China and Fed tightening remains front of mind with investors.
The S&P 500 will also have a good deal of work to do if it aims to finish within the weekly expected move. For the week ending November 23rd, the expected move is $47. In order to finish within the weekly expected move, the S&P 500 will need to climb some $40 on Friday; this is highly unlikely given the expectation for light volume and an early closing time of 1:00 p.m. EST.
A “sell the rip” market has taken its toll on investor sentiment, which has dropped significantly in November according to the American Association of Individual Investors.
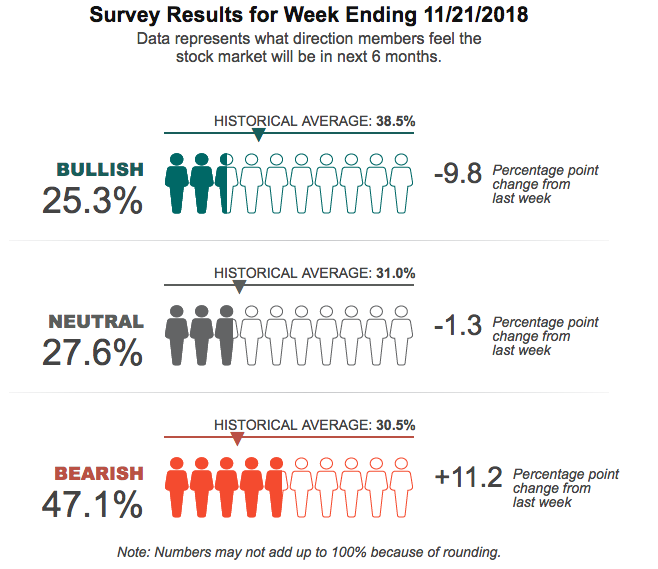 As shown in the sentiment survey above, bull sentiment has deteriorated below the historic average and for a 3rd straight week. Bearish sentiment is, unnaturally, above its historic median average and has trending higher in November. Much of the dire sentiment is tied to the S&P 500 performance, which has proven to buck the seasonal trend. In terms of how bad the S&P 500 performance has been in Q4 so far, with the S&P 500 falling 9.08% QTD, it has been the sixth-worst start to the fourth quarter in the history of the S&P 500. The only worse Q4s (through 37 trading days) came during some of the worst years for the stock market (1929, the 1930s, 1973, 1987, and 2008).
“Below is a table showing the worst starts to Q4 for the S&P 500 through 37 trading days. Any drop of more than 2% at this point in the quarter made the list. As shown in the table, the average change for the S&P for the remainder of these years has been a gain of 2.77% with positive returns 78.26% of the time. For all other Q4s in the S&P’s history, the average change for the remainder of the year has been +1.61%.”

While the focus of the Friday media-trading day will aim at retail holiday sales and Black Friday, crude oil’s plunge on Friday is attempting to steal the headlines. The narrative surrounding crude oil prices is always a net negative from the media and analysts. When crude oil prices are high, it’s said that the price at the pump will crimp consumer spending, even though that has NEVER proven to be the case. When the price at the pump is low, due to lower crude oil prices, it’s said that low prices are a negative read on the economy. Crude oil can’t win for trying! In response to recent price movements, JP Morgan has cut its outlook for oil from an average of $83.50 per barrel in 2019 to $73 per barrel. JP Morgan has said that in order to balance the market, OPEC will need to cut production by at least 1.2 million barrels per day. Nonetheless, given the negative sentiment surrounding the ‘black gold”, it’s something investors are forced to consider.
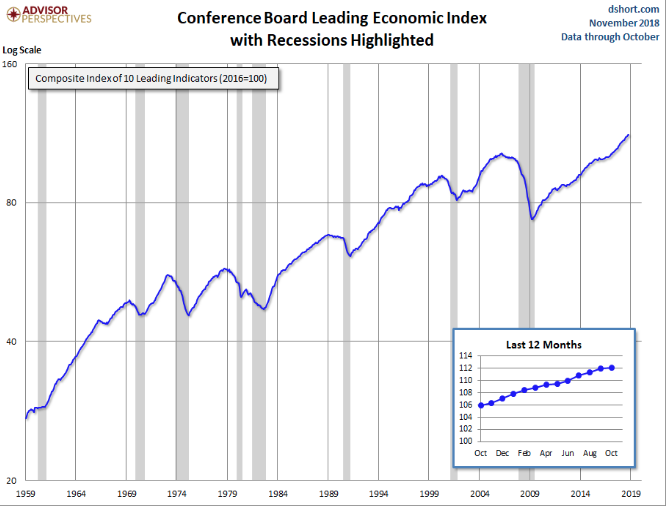
In terms of economic data, the leading economic index rose 0.1% in October after 0.6% and 0.5% gains in the prior two months, the Conference Board said Wednesday. Economists polled by FactSet had forecast a 0.1% rise.
“The index still points to robust economic growth in early 2019, but the rapid pace of growth may already have peaked. While near-term economic growth should remain strong, longer-term growth is likely to moderate to about 2.5% by mid- to late 2019.”
Here is a log-scale chart of the LEI series with documented recessions as identified by the NBER. The use of a log scale gives us a better sense of the relative sizes of peaks and troughs than a more conventional linear scale.
While the economic data and corporate earnings results have been in lock step through 2018, the market has ignored the results in favor of a thesis that depicts a slowdown in both results for 2019. Although the statistics suggest the rough start for the S&P 500 in Q4 should alleviate to some degree, this may largely hinge on the upcoming meeting between Donald Trump and his Chinese counterpart Xi Jinping at the G-20 Summit next Friday.
“Expect a photo opportunity, a “mock deal,” and temporary market relief from the much-touted meeting, said Bo Zhuang, chief economist and director of China research at TS Lombard. We don’t think this deal will be engineering a long-term truce between the two countries.”
Zhuang said China doesn’t want to provoke further escalation in bilateral relations with the U.S., but Beijing may actually let the Chinese yuan weaken should the tariff fight continue.
As we look to end a rough week on Wall Street for investors, Black Friday aims to shine a ray of light with respect to consumer spending and economic activity. According to Thomson Reuters, Black Friday and Thanksgiving Thursday sales are off to a strong start. U.S. shoppers hit department stores on Thanksgiving evening and spent $1.75 billion online by 5 p.m. EST.
Smartphone sales lifted overall online spending by 28.6 percent by Thursday evening from a year ago, according to Adobe Analytics, which tracked 80 of the top 100 U.S. online retailers including Wal-Mart (WMY) and Amazon.com (AMZN).
“Thanksgiving is on track to be a blowout day … fastest growing day that we have ever seen in terms of major shopping holidays online,” said Taylor Schreiner, director at Adobe Digital Insights, the research arm of Adobe Systems.”
The bear market sentiment is currently reining supreme and the cause of increased levels of fear in the market. Having said that, investors should always position and manage their portfolio with a long-term outlook in mind. Panic is never the friend of an investor, especially in a mechanical, algorithmically driven market. Momentum has taken hold of the market, much as it did in January, but in the opposite direction. At some point, the negative momentum will break and reverse course, again as it did in January.
Algorithmic and/or high frequency trading types of trades sometimes account for north of 90% of daily volume. In truth, this is precisely why the moves, both up and down, are so extreme and seem never ending when a trend takes hold. According to Jon Nejarian of CNBC’s Fast Money, “The action over the past five or six weeks appears to be a selective selling of stocks with the highest multiples and stocks that have had the best returns year-to-date. The algos seek out those targets of opportunity and hit these stocks rapid-fire, selling them harder as they drop. That is not what we’re used to seeing when human beings are behind the trades.”
Moreover, the issue with these targeted algorithmic trading programs is that they’ve targeted the most heavily weighted stocks on the Nasdaq Index or ETF (QQQ). The top holdings of the QQQ, the Invesco ETF tracking the Nasdaq 100, are Apple, at 13.2%, Microsoft (MSFT) at 10.2%, Amazon at 9.8%, Alphabet (GOOGL) at 4.7% and Facebook (FB) at 4 percent. When algorithmic selling hits the QQQ, these five stocks account for nearly 42% of that index. When this programmed selling ends or begins to end, the snapback will be hard and heavy, but when is the question.


