
This past weekend was a non-Research Report weekend for Finom Group. Nonetheless we sent the following notes to our Premium, Contributor and Master Mind Options members so as to set the stage for the trading week ahead. We are now making these notes available to our Basic members and the general public. Upgrade your subscription today to receive our weekly Research Reports and State of the Market videos for just $5.99 monthly (Cancel anytime). Here is a link to help!
Last weekend found most publications offering random takes on the latest sales of airline stocks and lock of dip buying from Warren Buffett. The market largely brushed off the fear-driven narratives in favor of recognizing that reopening the economy in phases held a greater calculation of trough economic conditions and the resumption of economic growth for the back half of the year. Make no never-mind about it folks, this will prove an arduous time for the global economy, but there is likely no where to go but up from here. Having said that, we don’t exonerate the potential pitfalls along the path to recovery, which will likely be hyperbolized in the daily media narratives to come.
Analysts are watching for any signs that the bottom of the economic downturn is near. Goldman Sachs Group Inc. analysts have been tracking varied measures such as gas demand, Starbucks mobile application downloads and traffic in restaurants as measured on the reservation website OpenTable for signs of a recovery. Gas demand, though it has fallen tremendously, started improving over the past week, while other data tracking flow through workplaces and transit showed small gains as some states have reopened.
“There are some small, early signs that life is resuming some form of normalcy,” the analysts said in a research note Thursday. “We expect these small signs of recovery to continue as the country gradually reopens and consumers resume their daily activities.”

That lead in there was from Saturday’s edition of the business section within the Wall Street Journal. To build upon that, there was a good deal of bullish breadth in the market this past trading week in fitting with some of the signs of life in the economy. While we analyze the closing values, rate of change and market internals they are not able to predict the future for us. They can, however, inform us as to the probabilities going forward.
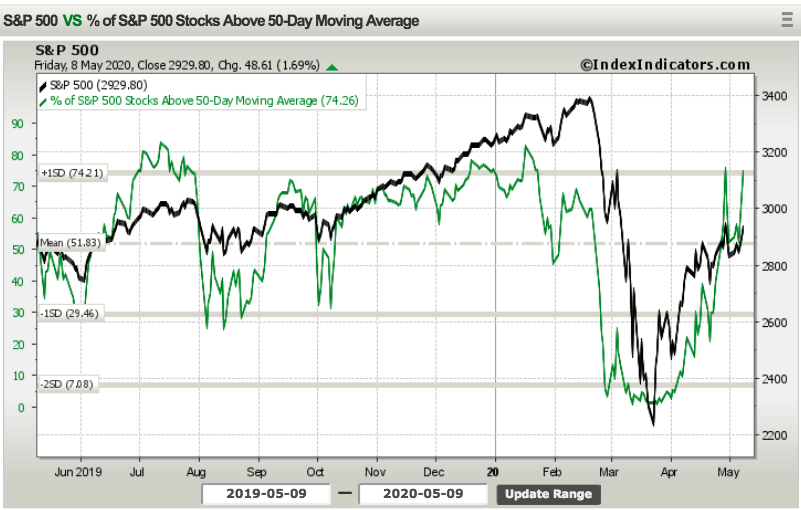
It’s very clear to see, from the chart above that the breadth of the market has improved from the previous week and from the lows in March. Based on the percentage of stocks trading above their 50-DMA, we are forced to recognize that there are more stocks participating in this relief rally. The relief rally began, in earnest 6 weeks ago and has had small pullbacks along the way. Each pullback thus far has proven a buying opportunity. The support for the market has not been so much in the way of broad market buying activity, but a combination of the favorable equity risk premium, fiscal and monetary policy enactment and outsized short positioning in a low liquidity regime.
Recall the following notes within our April 19th Research Report below:
“Moreover, while Strategas Research points out that 99% of stocks have moved above their 20-DMA, the percentage of stocks making new 20-day highs has not even reached 50 percent. Getting this above 55% would provide further evidence of broad-market healing that is necessary to support a sustained price rally, as evidenced in the chart/table below from Ned Davis Research.”
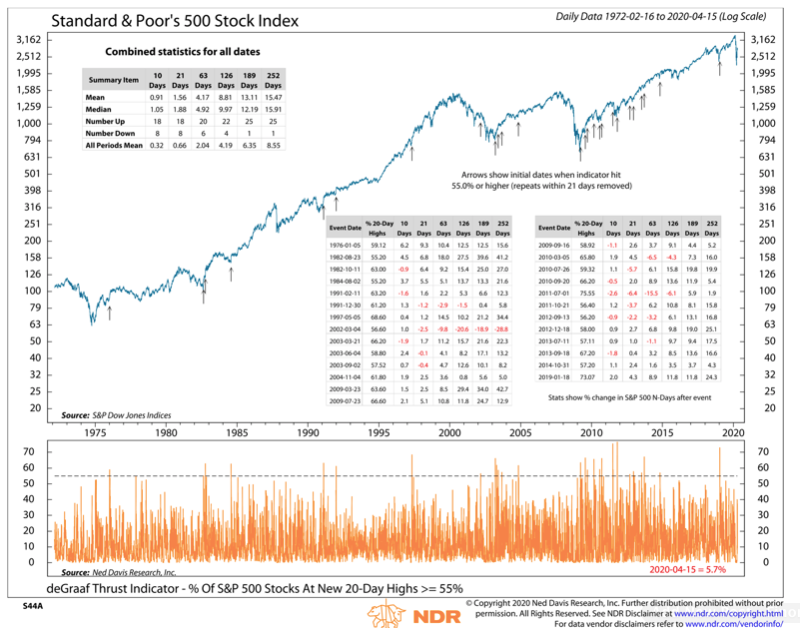
Has this breadth strength been achieved as we reiterate and re-emphasize market breadth internals vary? Well, let’s take a look while recognizing that Ned Davis Research said we need to be aiming for the percentage of stocks trading at 20-day highs equaling at least 55 percent. Why 55%: The market breadth has improved, but breadth thrusts are still elusive!!
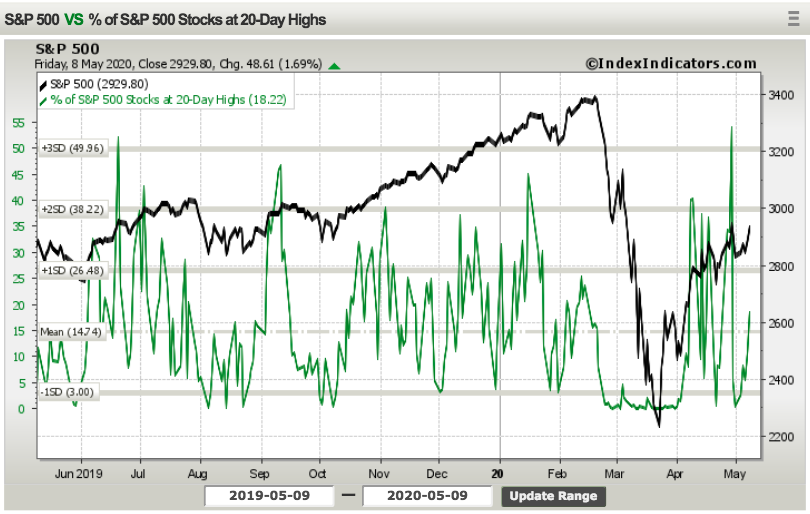
That big spike last week took the percentage of S&P 500 stocks trading at 20-days all the way up to 54, but not 55. Nonetheless, we can see there was modest improvement in this breadth indicator this past trading week. Truth be told, one can look at most breadth indicators for the week that was; by and large the majority showed improvement and with a risk-on slant. What do we mean by that?
We’ve been wanting to see certain sectors of the market begin to show greater performance than in past months to give us further reason to believe that the relief rally was something more than just a significant snapback after the fastest bear market in history. For the last couple of weeks, the market has delivered that which we desired to see in not just improving breadth but also sector performance.
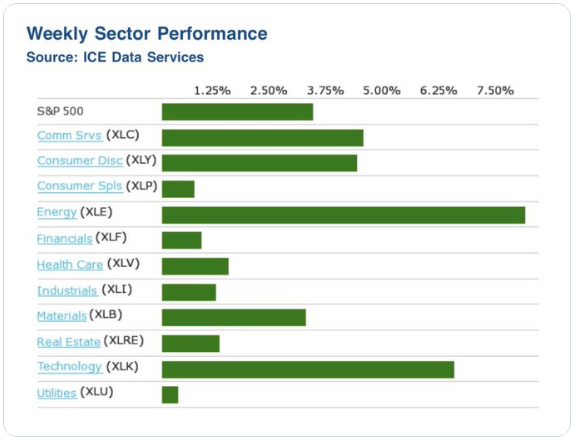
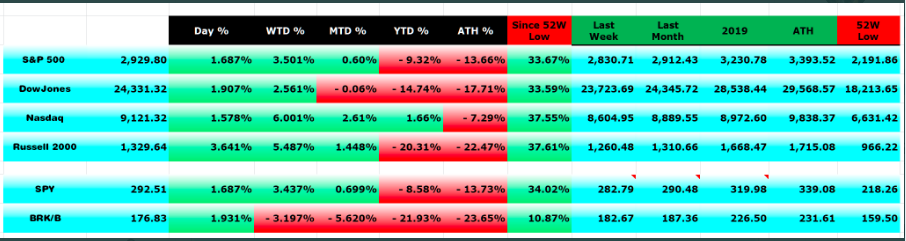
What we deem to be offensive positioning would be found in sectors like Consumer Discretionary, Energy and Technology. While we’d also like to see Financials perform better and they still give us reason to remain cautiously optimistic, eventually the Financials will have to add support for the market to sustain a bullish trend. But here’s the other thing that may have gone under the radar during the whole relief rally to-date. The fact is that small caps have been the leader. The main reason this goes under the radar is due to the volatile percentage moves within the Russell 2000 (RUT) which can easily give up some 3-5% on a day where the S&P 500 is down maybe 1-2 percent. But here are the facts about what’s been the leading market since the March 23rd low:
- Since the March lows, RUT has rebounded the most among the top indexes.
- 1. IWM +37.61%
- 2. NDX +37.55%
- 3. SPY +33.67%
- 4. DIA +33.59%
If you’ve been following markets over the last several weeks, all you’ve likely heard is how the large mega-cap tech stocks have been keeping the market afloat. The five largest stocks in the U.S. (Microsoft, Apple, Amazon, Alphabet, and Facebook) have done extraordinarily well this year and since the March lows, but to say they’ve been doing all the lifting would be inaccurate. Take for example the fact that of the 2,052 U.S. stocks with market caps above $500 million, 101 (4.9%) have hit 52-week highs so far in May and none of them are named MAGA or Facebook stocks. The table below from Bespoke Investment Group lists the 19 U.S. stocks with market caps above $20 billion that have hit 52-week highs so far this month. Looking at the list, only one of the names listed (PayPal) has a market cap above $100 billion and just four others have market caps above $50 billion.
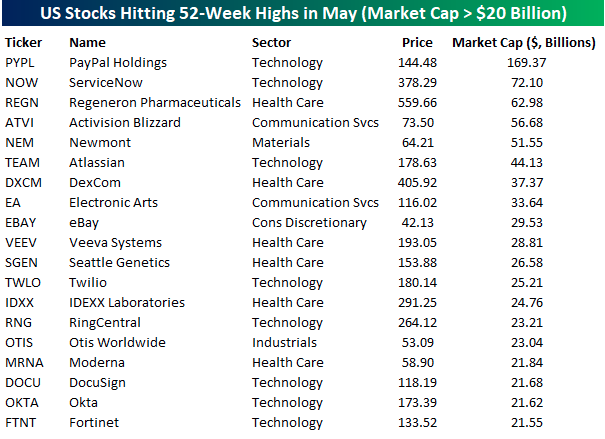
While mega-cap stocks may not be the ones hitting 52-week highs presently, one part of the argument behind which factors are driving the market that is partially accurate is that tech stocks are leading. Breaking out the table above by sectors, 8 of the 19 names listed are from the Technology sector. Behind Technology, the next most heavily represented sector is Health Care with 6 stocks in the table. However, when we expand the universe to all stocks hitting 52-week highs with market caps above $500 million, Technology doesn’t even top the list. With 49 stocks from the Health Care sector hitting 52-week highs this month, it tops the list followed by Technology with 26. Behind these two, no other sector accounts for even 10 names.
In speaking of new 52-week highs, this particular breadth reading comes to mind. We also want to see the number of 52-week highs minus the number of 52-week lows improve. It’s not the most consequential indicator, in fact it ranks toward the bottom of our list of breadth indicators at Finom Group, but for the sake of argument and building upon the aforementioned favorable breadth readings…
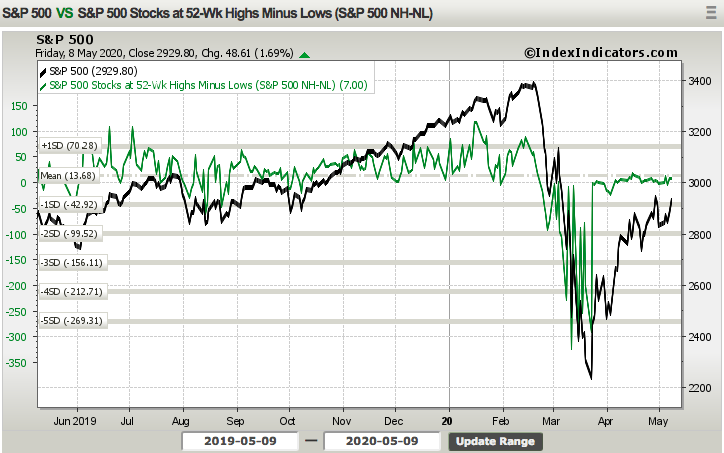
The NH-NL chart of the S&P 500 shows that this breadth indicator has done very little since early April. Nonetheless, on a week-over-week basis, it rose from -2.0 to 7 at the end of this past trading week. Improvement! And for every good chart or breadth reading, as we like to say, there is one that proves concerning or “not so good”.
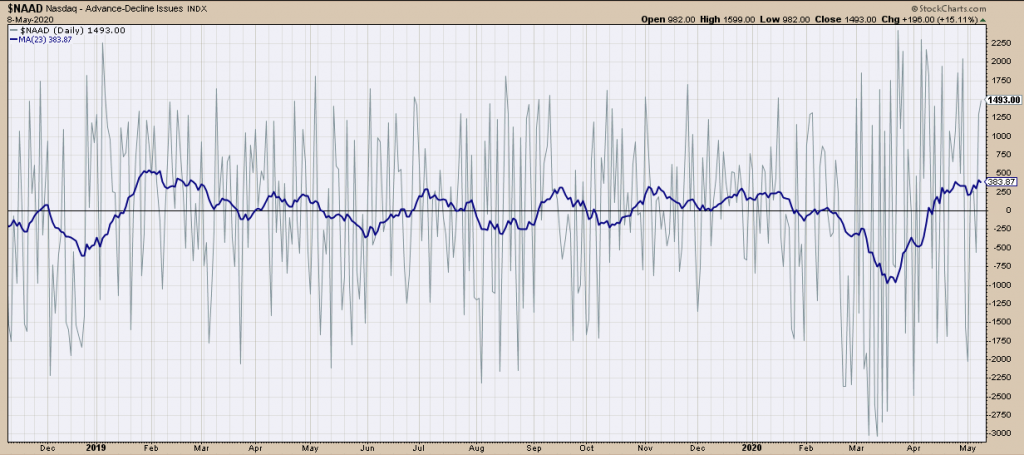
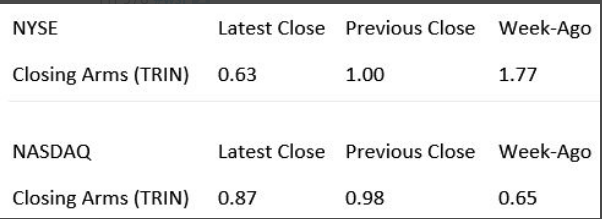
The Nasdaq A/D chart above suggests… well it pretty much validates that the index is quite overbought. The argument to suggest the overbought condition is relative to the recent oversold condition might prove valid, but given current levels, we would suggest treading cautiously with Nasdaq trading in the interim. While this chart does raise a yellow flag of sorts the NYSE and Nasdaq TRIN readings recognize that there has been rather strong buying demand this past week.
- Arms Index or TRIN = (advancing issues / declining issues) / (composite volume of advancing issues / composite volume of declining issues). Generally, an Arms/TRIN of < than 1.00 indicates buying demand; > 1.00 indicates selling pressure.
- So when we look at the closing value of TRIN from Friday, here is what we find: (buying demand)
Now, here are some relevant statistics to consider going forward. And when you see them, they might make the hair on the back of your neck stand on end at first. After the initial reaction and computing, however, we think the statistics will bring a certain degree of confidence on how to go about capital allocation when the market consolidates for price.
- Only 5 times in the last 70 years have we seen the S&P 500’s 7-week ROC produce the kinds of gains we’ve currently seen and each time the low in the stock market had already been achieved.
- See below statistic:
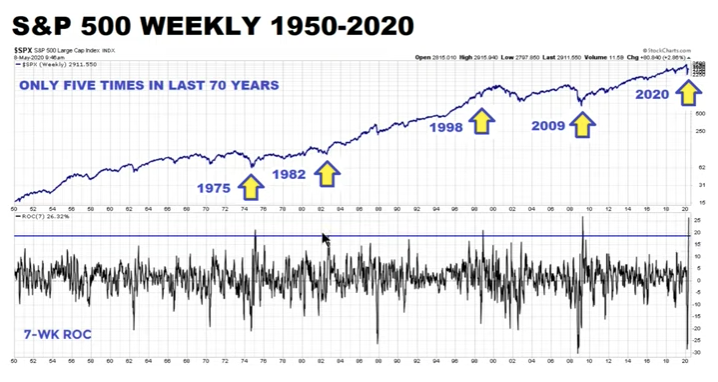
- The week that just ended was May 8th 2020, eleven years to the day of the last time the 7-week gain was 20% or greater!
- The S&P 500 is up 27.11% the last 7 weeks.
- That’s the single best 7-week stretch the index has seen since 1950.
- Ironically, the 7 weeks prior saw the index fall -28.54%, the 3rd worst 7-week decline since 1950.
Despite the aforementioned historical data, there still remains a good deal of consideration, concern and rhetoric amplifying the re-test thesis. This comes, especially, after Double Line Capital’s Jeffrey Gundlach outlined his short on the S&P 500 at 2,862. Keep in mind that Gundlach is a bond fund manager who is typically, if not always, found without favor for equity markets.
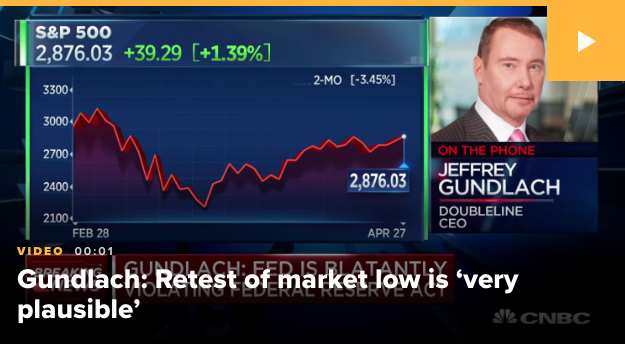
“I’m certainly in the camp that we are not out of the woods. I think a retest of the low is very plausible,” Gundlach said on CNBC’s “Halftime Report.” “I think we’d take out the low.”
“Actually I did just put a short on the S&P at 2,863. At this level, I think the upside and downside is very poor. I don’t think it could make it to 3,000, but it could. I think downside easily to the lows or beyond … I’m not nearly where I was in February when I was very, very short.”
Gundlach likely cares very little for the historical data noted above and likely also deems the current situation unique in many aspects. We certainly can’t deny the unique variables at play in the market and economy presently residing over the recession and bear market. Having said that, human behavior is pretty constant in the market, regardless of what is taking place in the economy. One could also make the argument that to the degree monetary and fiscal policy has been implemented, it lends that much more favor to the market over time. And beyond the rhetoric or even individual investor biases held close to the brokerage account positions at play, more technical analysis suggests a retest of the initial low is historically improbable.
Back on April 15th we offered the following in our article titled Are Bears Hibernating Ahead of Next Leg Lower or…?
Williams %R, or just %R, is a technical analysis oscillator showing the current closing price in relation to the high and low of the past N days (for a given N). Its purpose is to tell whether a stock or commodity market is trading near the high or the low, or somewhere in between, of its recent trading range.{\displaystyle \%R={high_{Ndays}-close_{today} \over high_{Ndays}-low_{Ndays}}\times -100}

In Williams’ most recent notes, the technician denotes that the major averages have exacted a 50% retracement from the March 23rd lows. As Williams pointed out, “The history of the last nine bear markets going back to 1972 shows that once we have had a 50% rally, back where we are now in the S&P 500, lows are not re-tested. And a rally less than 50% may give way to a re-test. Anything greater than 50%, we just don’t retest.”
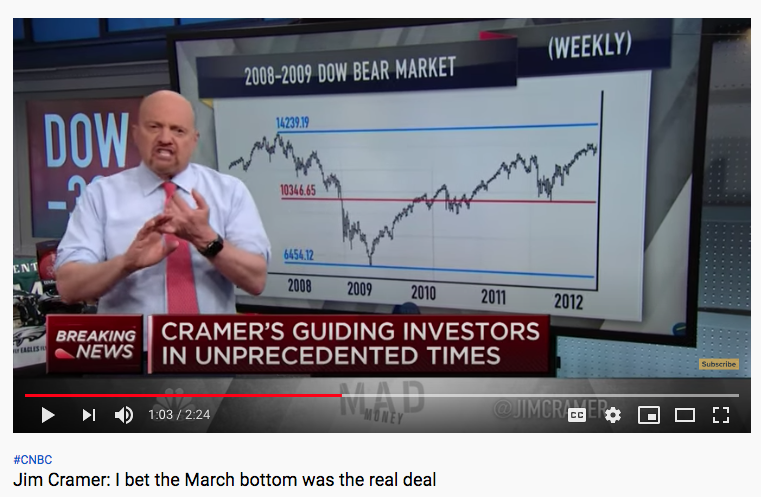
Mad Money host Jim Cramer recognized Larry Williams’ latest notes and historic data regarding 50% bear market retracements in his more recent episode.
Based on everything we know about past bear markets and have witnessed in the current bear market, the facts suggest that even as the macro picture remains uncertain, the technical market picture offers strong probabilities. The low may have proven to be the 2,191 level set in March, but a full retest doesn’t seem to be in the cards based on the historic data. This is not to suggest that consolidation of the relief rally won’t take place going through earnings season and an economic shutdown that is likely to last through all of April.
Here’s what we also know regarding the Williams %R indicator for bear markets:
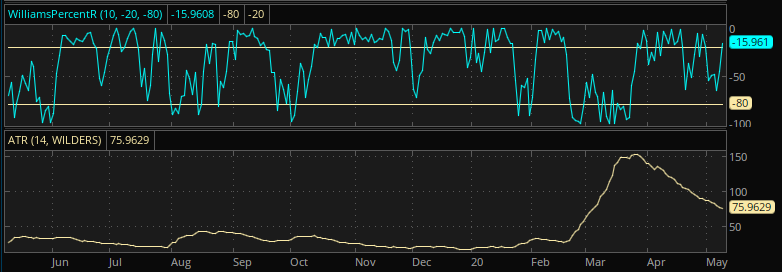
If the Williams %R makes a major low that coincides with the ATR (Average Trading Range) peaking and a 55% retracement of a bear market decline, the S&P 500 has never, ever fully re-tested the initial bear market low. As we can see from the chart of the two indicators above, that is exactly what happened in late March of 2020. What this outlines is not how much consolidation the market will perform, but what investors are best found doing when it does, BUY THE DIP!
Beyond the charts, breadth and massive short positioning that seems ever growing in the last month and with the S&P 500 largely trading sideways…
… there is the whole common sense and logic aspect of the economic shutdown cause by the pandemic. We see a good many analysts and market participants hyperbolizing over how the economy will reopen and if it will reopen this year. We also hear a lot of commentary questioning whether schools will reopen. Finom Group’s chief market strategist Seth Golden offered his views on the subject recently. He bottom-lined it by saying there is no probability suggesting that the government would deprive children of an education for 2 consecutive school years. And he’s right, that has never happened before as a civilized nation of states. Logically, we can put all the pieces of the argument together to rationalize that an economy can’t get back to work with unsupervised kids at home while parents are at work. The two factors are connected without fail. Seth does concede that many school districts may choose to delay the start of the school year until after Labor Day which would offer that much more time for drug treatments for COVID-19 to materialize, while herd immunity also advances daily. But that’s really about the best concession Seth is willing to offer at this time. Society works from the ground floor up, and the ground floor is education!
Moreover, we think the market has already, also figured this out. It’s too illogical to believe the government would deny education for two consecutive years. To the extent POTUS openly declares the harm to the economy by remaining shuttered, the same proclamation would likely ring true if school closures for a second year was proving an increasing probability.
When it is all said and done, tough decisions have to be made. The mortality rate is not high enough to keep the economy closed any more than it is high enough to withhold a child’s education, which is understood as part of our individual civil liberties. And that is even before we think about “at risk groups”.
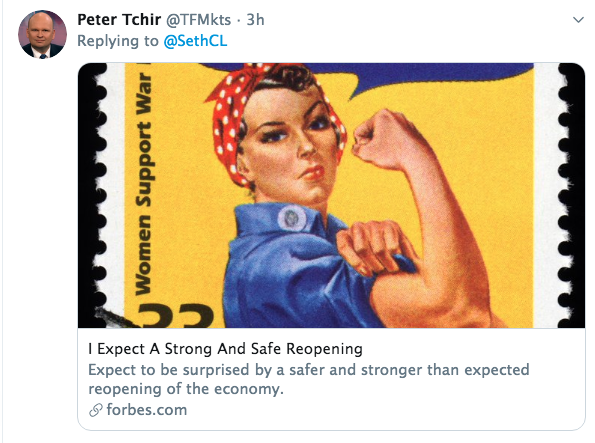
In the latest narrative from Peter Tchir, he discusses the risk groups and the data concerning COVID-19. Peter is among the few to openly espouse his bullishness on the markets and belief that the reopening process will prove safer and stronger than most think.
Nursing Homes or Long Term Care Facilities
- In Virginia 480 out of 827 deaths have occurred in LTC facilities. 58%.
- In New Jersey 4,691 out of 8,952 deaths have occurred in LTC facilities. 52%.
- In Massachusetts 2,837 out of 4,702 deaths have occurred in LTC facilities. 60%.
- In MA, there were 1,297 deaths reported in the past week. A tragic loss of life, with 66% of those deaths occurring in nursing homes.
I could not find this data for every state, but across the nation, LTC facilities have born the brunt of the virus. The loss of life is depressing.
I do not know what can be done to fix the tragic loss of life in these facilities, but there is clearly a problem that needs to be addressed. While I cannot help with fixing the issues that have caused this level of loss at these facilities, the fact that it is so concentrated, helps in terms of getting the reopening working.
Nursing homes and LTC facilities need to be addressed to save lives, but in terms of reopening, it is clear that they need to remain as distanced as possible until a solution to address the needs of these facilities is found.
I do not mean to sound callous, my heart breaks at this loss of life, but it is important that 50% of deaths in many states are occurring in relatively closed ecosystems that can be distanced during the reopening.
Youth
I don’t even differentiate between young and young and healthy, partly because I cannot find good data at that level of granularity and partly because youth allow seems a powerful factor.
The States of Connecticut and MA have reported 0 deaths under the age of 20! The combined population of these two states is 10.5 million people and not a single loss of life to anyone under the age of 20.
Texas the state with the second largest economy last year, and 29 million people has had 2 confirmed deaths under the age of 20 (Texas only reports details after a final investigation, so that could be revised higher).
According to the CDC, the flu has caused 174 pediatric deaths this year. Again, according to the CDC 61,000 people died in America due to the flu in the 2017-2018 flu season. The age make-up, as tracked by this chart on the flu resembles the age breakout of COVID-19 that we are experiencing.
Under the age of 40, MA and CT have reported 19 and 23 deaths respectively. Not last week, but since the start of the virus. Texas, which only reports details after a full investigation as 21 deaths under the age of 40 (out of 453 deaths that have been fully investigated).
This is great news! The youth of this country are getting COVID-19 but not dying at alarming rates. This group is not immune to the flu either. Also, we haven’t even addressed comorbidity yet, which means these numbers, which seem very low to me, are overstating the risk.
Comorbidity
In MA, where comorbidity is only reported on cases that have completed their investigation, the comorbidity rates is 98.3%!
New York State provides granular data on comorbidity. 89.5% of deaths involved comorbidity. Admittedly, hypertension is the largest factor and that is more common than I’d like, but the data is telling a consistent story.
We should all strive to be healthier. That is one takeaway, but this dual risk factor is also important as we think about risk groups and the reopening.
Everyone Else
There is a clear progression in every state on deaths as you get older. Some of that may be linked to overall being less healthy. I’m not sure. But the state data is clear. The death rate even for the 40 to 50 is generally low (42 in MA, 15 in CT, 20 in Texas). New York State is much worse at 748, but 92.3% (693 out of 748).
I for one am in this “everyone” else category. At the lower end of the age bracket, which is good, but need to work much harder on my cholesterol and cardiovascular health.
I will participate to some extent in the reopening, but will be cautious (or at least what I think is cautious). I carry a mask constantly and have 2 unopened ones, just in case. I don’t think I’ve been within 6 feet of someone (unless separated by plexiglass) more than a few times in 2 months.
The Choice Should Be Yours
Everyone is going to have to decide how to participate in the re-opening, but I think the data supports the anecdotal evidence – that younger, healthy people are likely to try and return to normal as soon as possible. The rest of us, will follow suit as we see fit.
Two weeks ago, I barely saw the data presented in this level of detail. It is still not presented this way in the mainstream media, but as people dig into the data, expect the economy to bounce back faster than most expect. It won’t be a full recovery by any means, but for now, I expect the reopening to be more robust and safer than most people seem to expect.
Data Dependent
I will be closely watching for signs that I am wrong. One sign that I will not be watching is confirmed cases. Yes, confirmed cases are going to go higher as we reopen. Part of that will be attributable to the reopening and part will be that we are just ramping up testing in many parts of the country, so officially categorizing people who have been sick for some time as ‘new’ cases. I know the media will latch on to the confirmed cases, possibly to support the no reopen view, but hopefully, as the data demonstrates, the groups most likely to participate in the reopening can get the virus and not have significant risk.
Hospital bed usage will be a key metric to watch. Many of the state sites I visited have very useful information on the availability of medical care in their state. I, for one, was impressed at the level of organization many of the states have demonstrated, and that is only based on public information, and I assume they have more details behind the scenes.
Changes in mortality rates, information about antibodies, a vaccine, will all influence my outlook. I’m optimistic that more progress on the medical front will occur and that the data will continue to support a rational, voluntary approach to reopening.
The reopening is not without risk, but there seems to be reasonably safe approaches to reopening.
I did not argue the other side of the issue, that with well over 20,000,000 people unemployed, there are great risks from not reopening. I think there is evidence to support the reopening as it is, but if you factor in the potential problems of not getting the economy sorted, it seems even more worth the risk.
There is nothing to stop anyone from maintaining shelter in place, but don’t be surprised if the reopening is more successful than many expect. Be Safe! There is nothing that says we can’t be safe, respect our risk profile, and reopen.
I remain bullish on markets, in a large part, because I expect the reopening to be successful based on the data I have. The issues surrounding the virus and the reopening transcend the market, but if I’m right, America and the economy will win.
Investor Takeaways
For the week to come we expect some choppy price action, but we don’t deny that breadth improvement suggests the greater probabilities for upward price movement, through the early part of the trading week. The S&P 500 is likely to achieve the 61.8 fibonacci level at 2,934/5. (SPX chart below with Fibs)
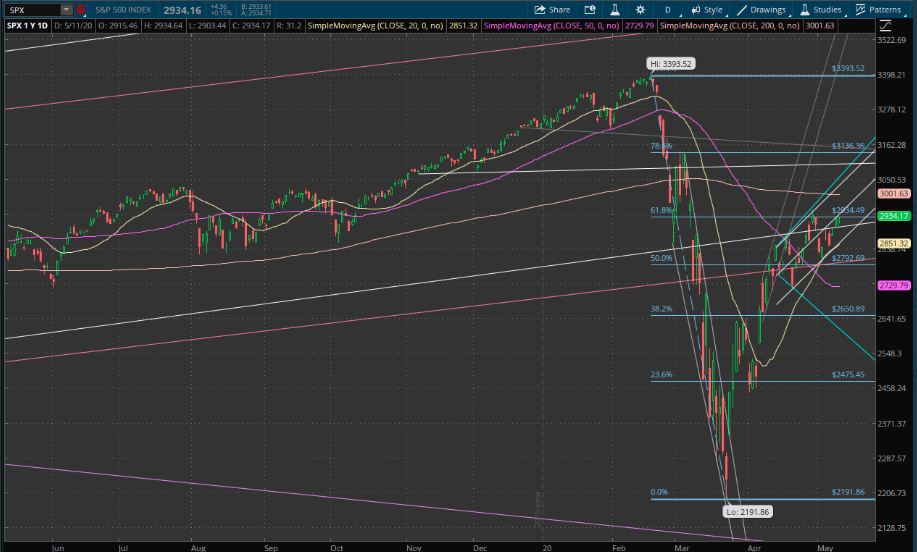
A close above 2,934 sets the stage for the benchmark index to challenge the relief rally high of 2,959 from two weeks ago. Nothing is set in stone and headlines could derail breadth momentum, but until then, the bulls have the wind at their sails.
The VIX closed at its lowest level since late February this past week, declining to below 28 by the end of the trading week. Having said that, are infamous 10-day ROC has found levels typically associated with a near-term bounce in the VIX. As such, Finom Group recognizes the potential for the VIX to decouple from its typical inverse relationship with the S&P 500.
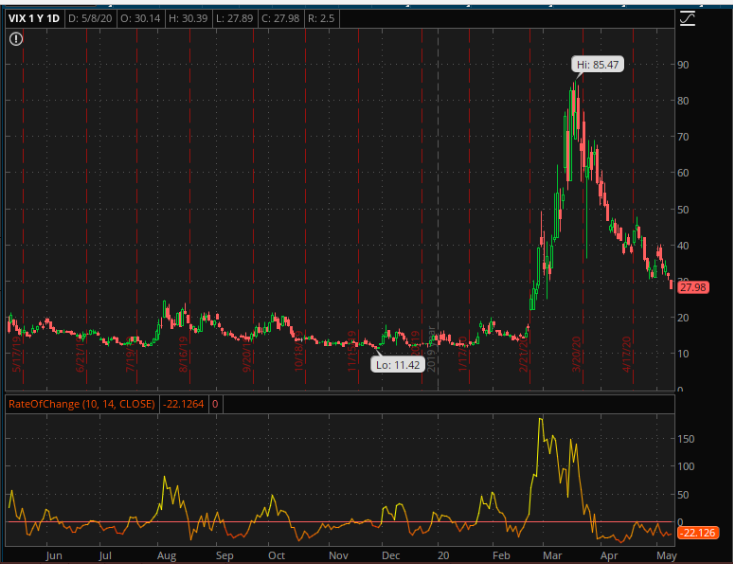
The bottom chart identifies the 10-day ROC whereby it doesn’t like to stay below the -20 level for very long before popping back up above the 0-bar, even if ever so briefly. Keep in mind our verbiage outlining the potential for the VIX to rise absent the S&P 500 declining. The inverse relationship between the 2 indexes is only viable 85% of the time, not 100% of the time.
Analysts, strategists and economists will continue to focus on the relative strength of the relief rally and general valuation in an environment where earnings are forecast to decline between 20%-30% in 2020. The “disconnect” mantra will continue to litter the investing landscape. But again make no mistake about it folks, in real-time, the fast moving stock market and usually slower moving economy seem disconnected, but in reality they aren’t. One leads, the other lags, which throws off real time perceptions and reinforces the usual underperformance from fund managers and strategists alike. Stay on plan, review your process daily, stick to what works, remain flexible and with a cautiously optimistic outlook that recognizes the unwavering American spirit of ingenuity.


