Global equities found a sharp risk-on rally as rounds of economic data from China and the United States positively spurred investor sentiment. After a marked improvement in China’s PMI data, the U.S. released both monthly retail sales and ISM manufacturing data. Before getting into the U.S. data, let’s briefly take a look at how China’s manufacturing sector reported.
The Caixin/Markit Manufacturing Purchasing Managers’ Index (PMI) came in at 50.8 for March. Analysts had expected it to come in at 49.9 for a second month, according to a Reuters poll of economists.
New orders climbed to their highest level in four months, while the index for new export orders returned to expansionary territory, “showing that both domestic and external demand rebounded moderately,” wrote Zhengsheng Zhong, director of macroeconomic analysis at CEBM Group, a subsidiary of Caixin. Markit and Caixin said in a joint press release that staffing levels at factories rose in March to mark their first expansion since October 2013.
In the United States, monthly retail sales served as the appetizer ahead of the release of ISM manufacturing data. As it was with December 2018 retail sales, February retail sales were a disappointment on specific levels. Retail sales dropped 0.2% in February, hurt in part by a severe cold spell across the country. Economists polled by MarketWatch expected sales to climb 0.3 percent. As is always the case, revisions to the February data are likely. And speaking of revisions.
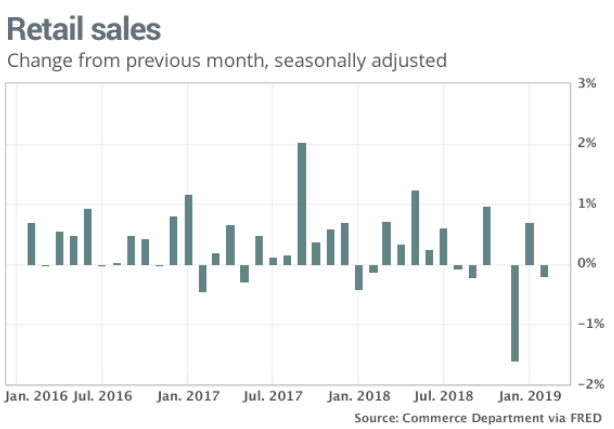
The government on Monday revised sales in the first month of the year to show a 0.7% increase instead of 0.2 percent. The revision or difference between the initial January sales and the .7% final number is an outsized revision and likely insists that the December 2018 drop of -1.6% found data creeping into the January period and without proper gathering in a timely manner, due to the elongated government shutdown. More often than not, revisions to the previous month range between flat-.3 percent.
“Our bottom line is that U.S. consumers remain on firm footing, though rising gasoline prices could curb growth in spending in other categories,” said chief economist Richard Moody of Regions Financial.”
When we dig deeper into the February retail sales report we recognize the good, the bad and the ugly, so to speak. Although the MoM drop in retail sales was the just the 2nd such decline in just the last 3 months, retail sales continue to climb YoY. In the latest report, retail sales rose by 2.2%, a deceleration from the greater than 3% annualized growth rate through much of 2018, as tax refunds have been delayed through the government shutdown period.
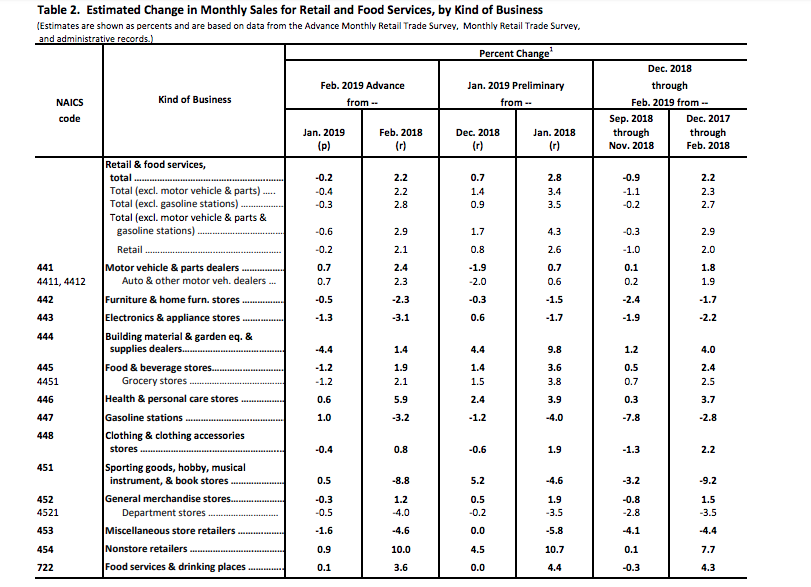
In terms of MoM category declines, Building materials, grocery store and electronics & appliance stores were the outliers in the retail sales report. The 4.4% drop in Building materials and greater than 1% drop in grocery store sales reflects the deep freeze in the northeast that persisted in February. This is typical for the Q1 period as both 2017 and 2018 both found monthly retail sales declining MoM in the February period.
Moreover, while autos and Nonstore sales (online) were higher MoM and YoY, department stores continued to struggle. Department store sales fell .5% MoM and a whopping 4% YoY. It’s painfully clear that Nonstore sales continue to take a bite out of traditional brick and mortar retail sales.
Another factor boosting Nonstore sales, besides the benefits of harsh weather impact forcing consumers to increase purchase activity online, is the steady closures of physical stores annually. Last year, Toys R’ Us and The Sports Authority closed all locations and liquidated most assets. We can see the affect of both of these brand closings in the YoY Sporting Goods, hobby, music and books category, which dropped a whopping 8.8% YoY. Due to the nature of these specialty sales, the consumer is largely pushed online for the consumption of these goods as most department store retailers simply don’t have the selection provided by Toys R’ Us and The Sports Authority. Additionally, it would be an erroneous assumption to suggest the closings of the brands would find existing department store chains benefitting much if at all. Sports Authority closings have not found Dick’s Sporting Goods outperforming, while the smaller Hibbett Sports has announced it will close 100 locations in 2019, nearly 9% of its physical store locations.
We can further validate store closure impacts on retail sales within the YoY results of the electronics and appliance category. HHgregg and Sears store closures have not helped J.C. Penney sales and as the retailer has announced it will discontinue selling appliances in 2019. When we look at category YoY results for electronics and appliances, it proves one of the biggest declines in the month of February.
Unfortunately, as it pertains to the Sporting Goods, toy and appliance categories, we expect the total chain closures mentioned to weigh down retail sales throughout 2019, but which captures no attention in media headlines. With record low unemployment and wages having risen at their fastest pace in nearly a decade, the consumer is forced to adjust to many factors impeding spending, which includes not just weather, but ever declining physical store choices and visitations. Now let’s take a look at the ISM manufacturing data.
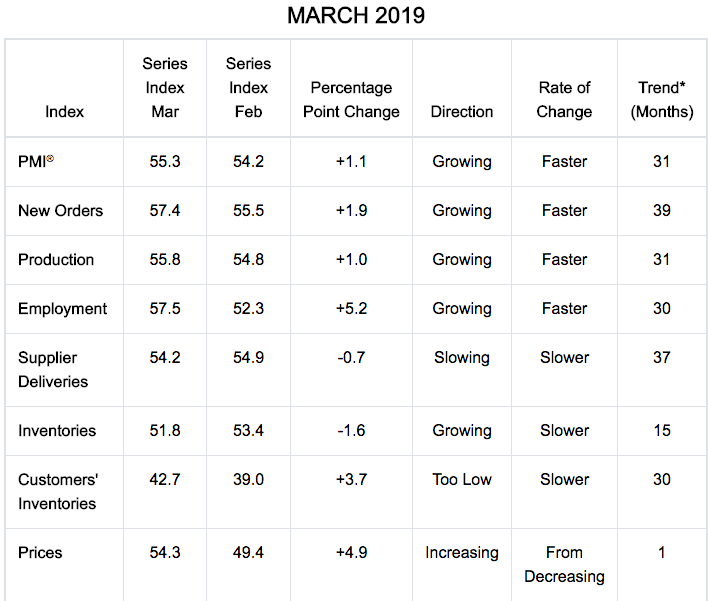
The Institute for Supply Management said its manufacturing index rose to 55.3% last month from 54.2% in February.
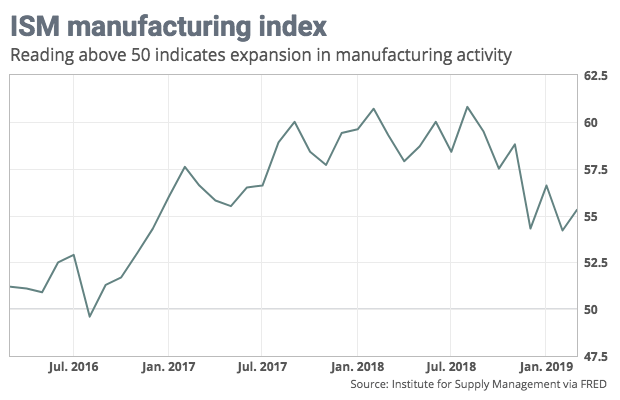
While the ISM manufacturing data improved, another measure, the IHS Markit manufacturing purchasing managers index, fell to 52.4 vs. 53 in February, the lowest reading since June 2017.
Within the ISM data sets, the index for new orders jumped 1.9 points to 57.4%, while production rose 1 point to 55.8%. Employment surged 5.2 points to 57.5%. Sixteen of the 18 U.S. manufacturing industries surveyed by ISM expanded in March.
“There is nothing in the details of the data or the comments to make you think the expansion is going to come to an end anytime soon,” said Richard Moody. He added that U.S./China trade dispute did not dominate the comments from supply managers. “There is an expectation that sooner or later we will get a relatively benign outcome to the trade dispute and we can go back to worrying about being able to find workers and transportation.”
One of the more telling points within the ISM manufacturing data is inventory levels. As we mentioned, with great detail, how we analyze and forecast the probabilities for future ISM manufacturing demand, we look at inventories as a primary guide, but not the only guide. Also, in our weekly Research Report titled, Risk Asset Prices Rerated for Growth: Has the Global Economy Found It’s Low Period?, we outlined our forecast for global PMIs.
As we can see from the ISM table below, inventory levels are back to “low levels”. This foreshadows future orders and manufacturing under normal economic conditions.
In addition to the table above, we can also comment on the impact from geopolitical feuds centered on trade.
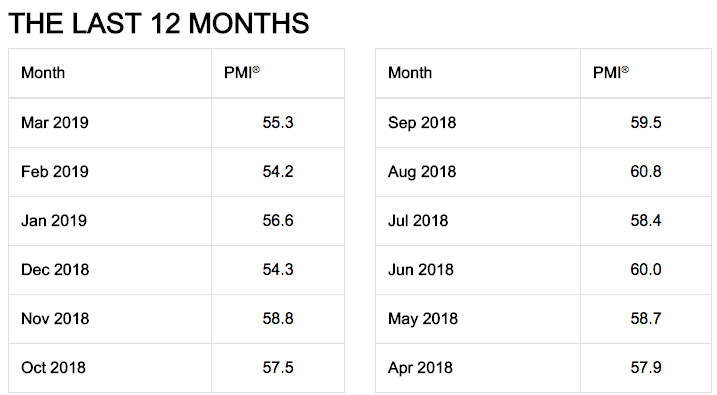
It’s no secret as to why the June to August period showed such strong ISM readings, given the desire for many companies to increase orders ahead of and shortly after trade tariffs were implemented on goods from China. This frontloading of orders created an artificial increase in manufacturing and shipping (as displayed in the sharp rise in BDI as well as container shipments for the period), but subsequently increased customer inventory levels, which demanded a longer period of slack between new orders. Hence, the deterioration in the ISM since. It’s all there folks, it’s all connected. The variables at play resulting from the ongoing trade feud have pervaded economies of scale. But all is not lost, as trade deals are in the works and anticipated near-term.
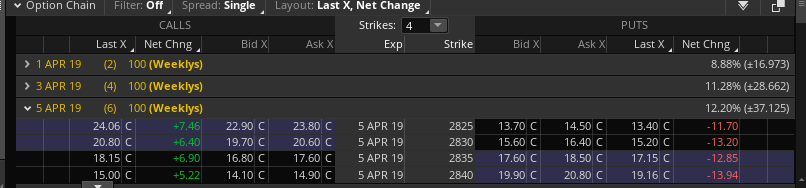
Heading into the trading day for Tuesday April 2, 2019, the S&P 500 is already closing in on its weekly expected move of $37/points and after gaining nearly $33/points on Monday. Equity futures are looking relatively flat even as pan-European indices are higher across the board.
While the bond yield curve has emerged from a state of inversion last Friday, thee is an early bid for bonds Tuesday, forcing yields lower. Investors will likely continue to monitor yields as the debate over a possible Fed rate cut later this year proliferates in the media.
Much of the market commentary centering on the typical negative correlation between bonds and yields simply doesn’t manifest itself in the data in any overtly negative way. It’s often assumed that when bonds and stocks go up together (yields go down), the bond market is warning equity investors of an imminent plunge.
While bonds and stocks are typically negatively correlated, looking at data back to 1988, SocGen found that 44% of quarters saw both global bond & equity markets rise together.
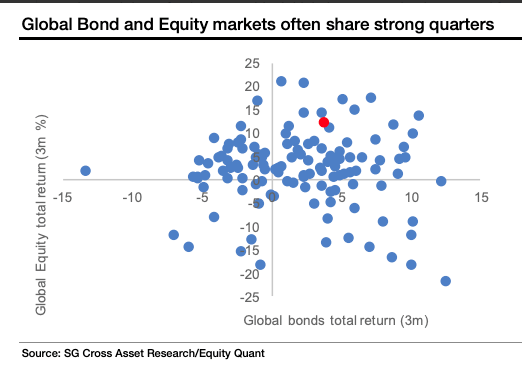
As such, when Mark Yusko, Founder, CEO & Chief Investment Officer of Morgan Creek Capital Management, suggests the bond market is sending a bad signal for equity investors, it defies both the history of the equity market and the statistical data offered by SocGen.
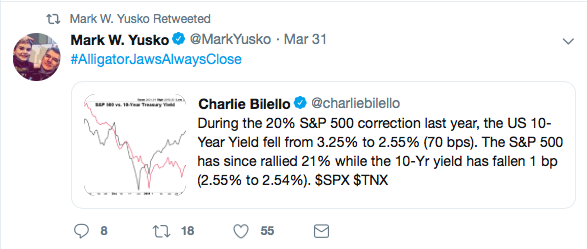
Typically, the “alligator jaws” do close, but only with equity prices going higher long-term. As such, the tweet from Yusko is more a market timing call issued with deviant bias. Such is his way within the permabear mantra. Anywhere a negative bias can be issued within the current state of the market, it will be tweeted folks.
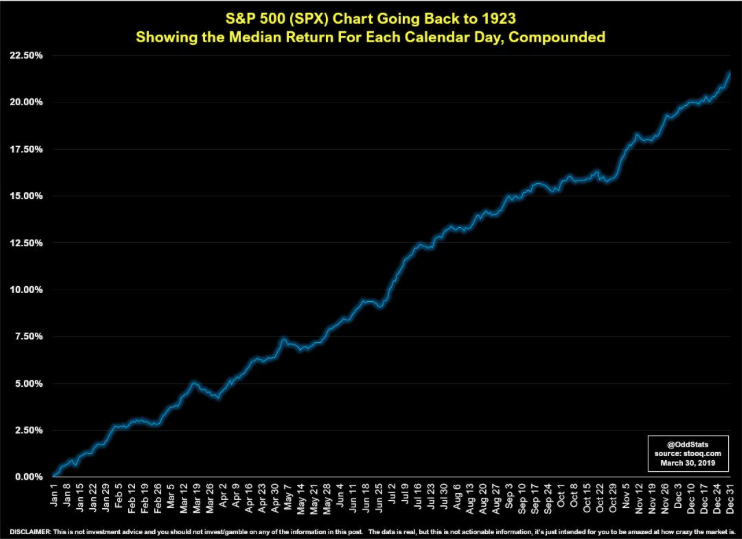
As far as how the market works over time folks, here is a chart from OddStats that identifies the stock market since 1923.
The day after April Fool’s day investors are also one more day removed from the Ides of March warnings that didn’t pan out for those particular market pundits and analysts. Recall from early March, Nomura’s Charlie McElligott warned investors with detailed analytical points of reference as to why the market would likely decline sharply in the month of March. With his analysis failing to hit the mark, his more recently updated notes serve to move the goal posts out to the first week of April. How convenient for McElligott? The following notes were issued last Thursday:
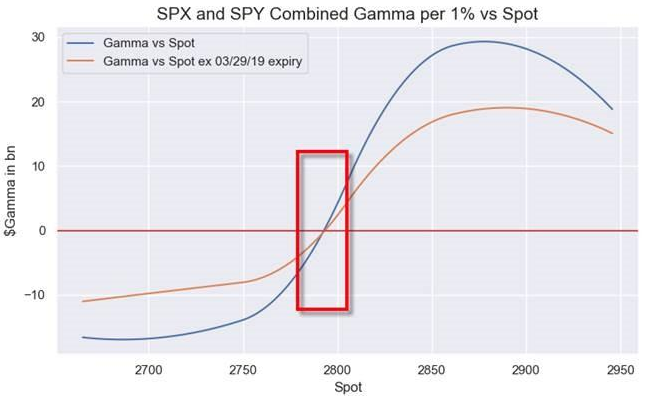
“It has to happen now”, as he currently estimate SPX/SPY consolidated Dealer Gamma to turn “negative” in approximately the same area ~2790 area the bank’s CTA pivot level… “so this next five days is the “PEAK WINDOW” for this “alignment” of Dealer Gamma, Rebalancing flows and CTA sell triggers.”
- “Spot” S&P still remains meaningfully above CTA sell-triggers (SPX and even moreso NDX remain comfortably “Max Long,” although position sizes / $ exposure is just a fraction of last year’s Jan18 / Sep18 peaks)
- Dealer “long Gamma” remains at current levels and “holds” us, only turning “negative” (per our latest inputs) approx 20 handles lower in SPX ~ 2790
Which means that if stocks can resist a late March dump, it may be smooth sailing, as looking ahead into April, three drivers emerge:
- “Seasonals” out the first two weeks of April shows a very growth-y “Cyclicals over Defensives” trend since 1994
- The “Rebalance Analog” shows very POSITIVE out-trade as a “post April 1” SPX upside catalyst—especially looking-out the 5-6 days after (see table below):
- Finally, Mid-April will earnings “kickoff,” which sees PMs “tune out macro noise” and also means that corporates will thereafter begin to emerge from the “blackout”—particular Banks which have certainly been a negative optic of the past few weeks in light of the rates move
Putting all this together, and looking at the near future, McElligott predicts that the marginal pressure for US equities is likely to tilt positive for the S&P500 as we push into April for the following reasons:
- Yes, Systematic Trend “sell triggers” in SPX again move mechanically / dangerously higher looking-out nine days (and WAY HIGHER 3 weeks out)—but in meantime, Spot remains well above said pivot levels
- Spot also remains above dealer Gamma pivot (comfortably in “long gamma” zone currently)
- “EPS commencement” in mid-April when Equities PMs “tune out macro noise”
- Emergence from the “Buyback Blackout” at same time (for Banks especially)
- “Extreme Pension Rebalancing” analog turns positive the 1w after the “turn”
- Powerful seasonal since ’94 with USEQ “Cyclicals over Defensives” over the first two weeks of April.
Having found his previous notes without efficacy, McElligott has changed his tune to some degree, but offers himself some wiggle room most notably in the future and with regards to a market decline. Naturally, the market will eventually decline, but when and why is difficult to determine, even with a plethora of experience and data at-hand. Kind of like predicting the next recession. A recession will occur, but when and why is often a difficult and fruitless predictor exercise to engage. With this in mind we take a look at a recent CNBC survey centered on the YTD market rally and underlying economy.
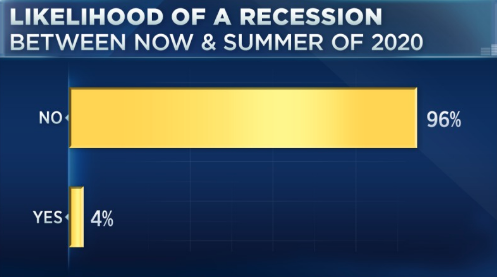
According to a majority of Wall Street professionals, the market outlook remains positive. More than 96% of respondents to CNBC’s “Halftime Report Stock Survey” said they do not see a recession in the next year, and just about 70% saying they are optimistic. Not a single strategist among the 27 respondents had a negative outlook. Just under 30% are neutral overall, which is lower than the 34% from last quarter’s survey.

Also, as shown in the chart above, the vast majority of survey respondents said they believe the Fed will hold steady, at least for the time being. About 89% said they expect the central bank to do nothing, with roughly 4% predicting a hike. About 7% said they believe a rate cut is on the horizon.
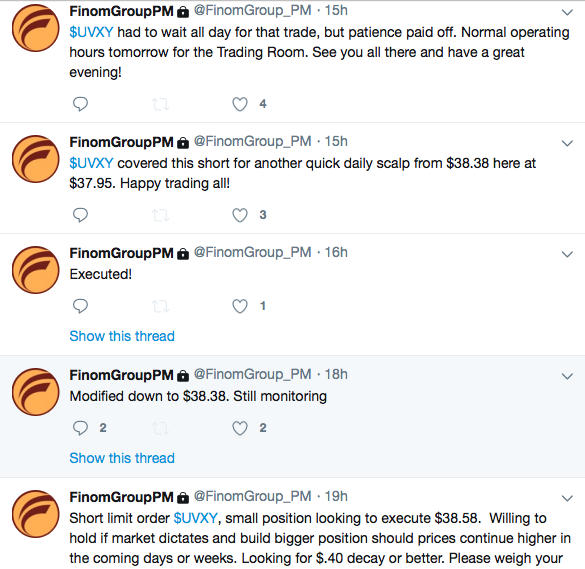
And that’s our Daily Market Dispatch, setting the stage for the trading day ahead. As always, Finom Group will seek to trade what the market delivers. Our daily scalp while the market ebbs and flows with varying degrees of volatility presented a late day trade execution/alert for subscribers, which can be viewed in the screen shots below. Happy Trading!