
In a recent article titled Gundlach Warnings 5-years in the Making, we outlined some of the erroneous reporting by some of the permabear market participants. Jesse Colombo of Clarity Financial was highlighted within the article as we denoted the following:
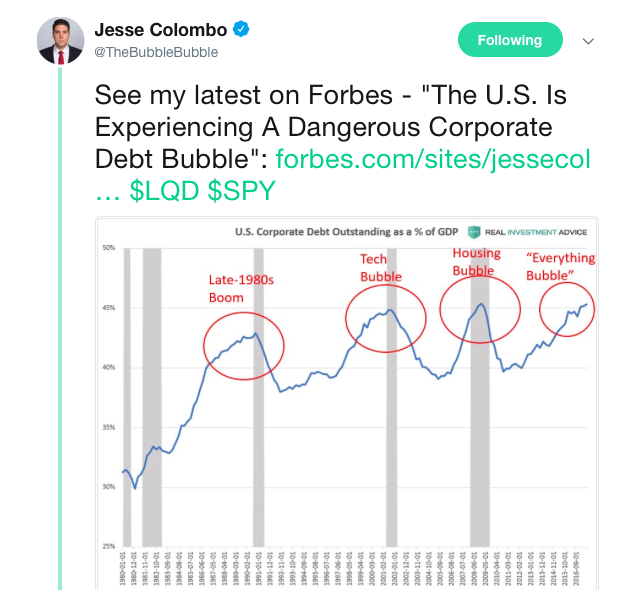
“What you will notice in Colombo’s article, as it is within Gundlach’s narrative and perspective, is debt quantity and not the serviceability of said debt. There is NO stress testing of said debt or balance sheet analysis, just debt quantity and its historic comparisons. Furthermore, here is what Colombo offers with regards to buybacks and dividends as a usage of corporate borrowing. He even offers a nice chart.”
But Clarity Financial has more than one financial analyst. Lance Roberts is a well-known market apologist and promotes many videos and articles that outline troubled times ahead. Like his counterpart Colombo, Roberts has been issuing these warnings, alerts and be-on-the-look-out-for type of narratives for several years, even as the bull market and economic expansion has carried forward. In his latest warning to the markets, Roberts depicts the inevitable yield curve inversion and recessionary conditions ahead.
To be clear, most economists warn about the yield curve inversion leading to a recession. What Roberts does is a little different. As the author of his works, he can define starting and end points, leave out or insert data as he so chooses, and chooses he does. (See table below)
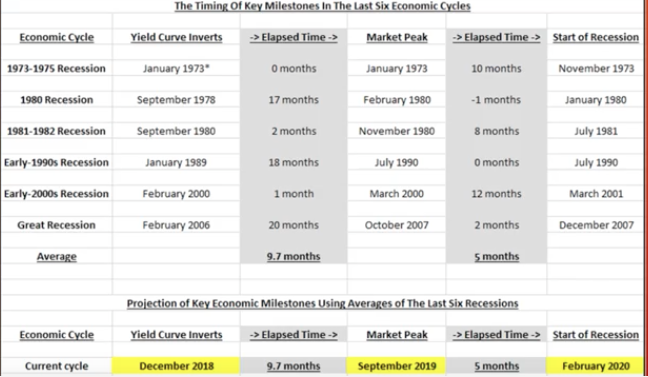
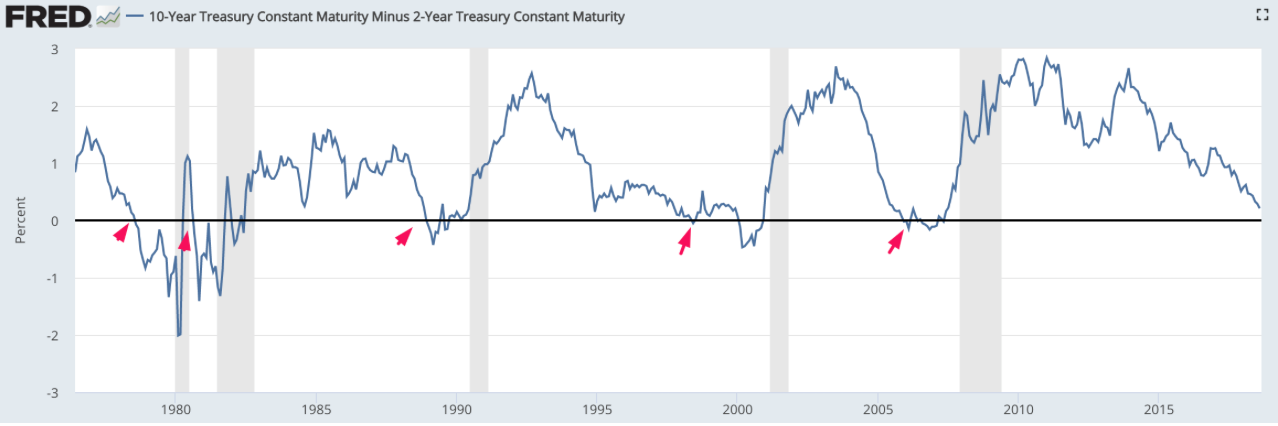
Notice the column depicting the historic yield curve inversion dates. Firstly, Roberts chooses to start his study and disseminations without using the 1968 yield curve inversion. In 1968, the yield curve inverted, but no recession followed. And in 1998, a very flat curve occurred, with an inversion that lasted but a month. No recession followed, although the curve inverted again eight months later, which would eventually lead to the dot-com crash. Roberts leaves out the 1998 yield curve inversion that inevitably did not lead to a recession. As noted earlier, Roberts is the author of his narrative and YouTube video, so it’s his data and his “story”. One can see the yield curve inversions since 1978 in the following chart.
So no, not all yield curve inversions lead to a recession, unless one picks and chooses the historic data to coincide with their desired narrative. Having said that, we must concede that a yield curve inversion does not bode well for the economy given historic precedence by the majority of occurrences leading to a recession at some point. The yield, simply put, isn’t the causation of a recession, but a symptom that leads to other symptoms in the economy ultimately expressing a recession.
Something else we want to point out regarding Lance Roberts’ study. His table displays yield curve inversion and the lapsed time from said inversion to the market peak. Then it identifies the lapsed time from market peak to a recession. By aligning the study and table this way (leaving out 1998 inversion and including a fictional 1989 date), Roberts can avoid the lapsed time between the yield curve actually inverting and the onset of the recession. There is usually quite a large amount of time lapsed between the occurrences as we see in the following study by Ryan Detrick of LPL Financial.
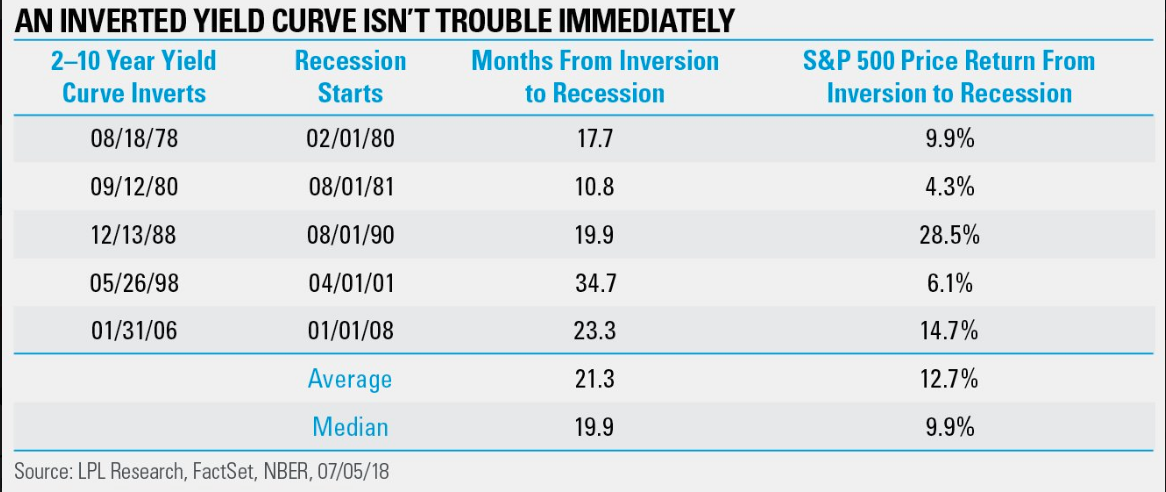
If we take the yield curve inversion study from Ryan Detrick of LPL Financial and compare it to the one from Lance Roberts, we see how the data shifts or leads to other conclusions and considerations. Detrick begins his study using just the last 5 yield curve inversion occurrences. Let’s face it, the world and economy is a much different place than it was from 1968 or 1973, where Robert’s chose his study’s starting point. Detrick does include the 1998 inversion, but also offers a study regarding how many months from inversion until a recession hits. Using Detrick’s data, the average time lapse between inversion and a recession is roughly 21 months or a median of roughly 19 months. Where Detrick doesn’t identify the market peaks ahead of a recession, we can’t rely on the data from Robert’s due to the way he offers the 1989 inversion, which actually occurred in 1988. How do we know it occurred in 1988, well, thank you Internet!
So much of what Clarity Financial, between Jesse Colombo and Lance Roberts, is revisionist and cherry picking of custom fitted to suit their biased market and economic thesis. One could argue that the government on an ongoing basis offers financial data revisions and therefore the data is prone to errors of comprehension. But yield curve inversion isn’t something the government can “fudge” so to speak and in terms of calendar occurence. The calendar is the calendar. What you may really want to know, as an investor, however, is how the market performs once the yield curve inverts.
We are currently in an economic expansion and as such here’s what happens next to the S&P 500 after the 10-year /2-year yield curve inverts for the first time in each economic expansion. Troy Bombardia provides the following table:

You’ll notice that Troy Bombardia is the only one who recognizes that the yield curve actually inverted on December 27, 2005. We’ll give Detrick a pass on his 1/1/06 date (possibly related to first day of New Year trading) of that particular yield curve inversion, but not Roberts with his still one month out (February) citing of the yield curve inversion. This only allows for him to curtail the time frame between inversion and recession, further identifying Clarity Financial’s bias and woeful art of misguiding market participants with faulty or partial data sets.
So why are we drawing out these different studies and data sets? Well, the Federal Open Market Committee (FOMC) will meet again next week and it is very much expected that a rate hike will be announced at this meeting. The .25 bps rate hike will likely lead to a near term inversion of the yield curve. The fact is that most yield curve inversions do eventually lead to a recession, but that recession may be some 18 months-2 years in the making. Even with the probability of a recession that far out, the market may tend to focus on the spreads between 10s/2s for a couple of weeks after the FOMC rate hike and subsequent spread contraction. We’ll see how the markets react next week for sure, but be prepared for anything. Recall, the market very much overreacted to a higher than expected wage inflation number back in February that proved to be innocuous in subsequent months. So, who’s to say….and maybe, just maybe this time is different. At least different than 1978 we can possibly all agree ;-).


